Insights
Cash flow strategy, profitability frameworks, and financial playbooks from the team that manages $650M+ in brand revenue.
No insights match those filters yet. Clear filters to see all posts.
CAC is an output, not a lever. Break it into six funnel stages, rank them by the dollars each one is adding, and fix the stage that is actually capping growth.
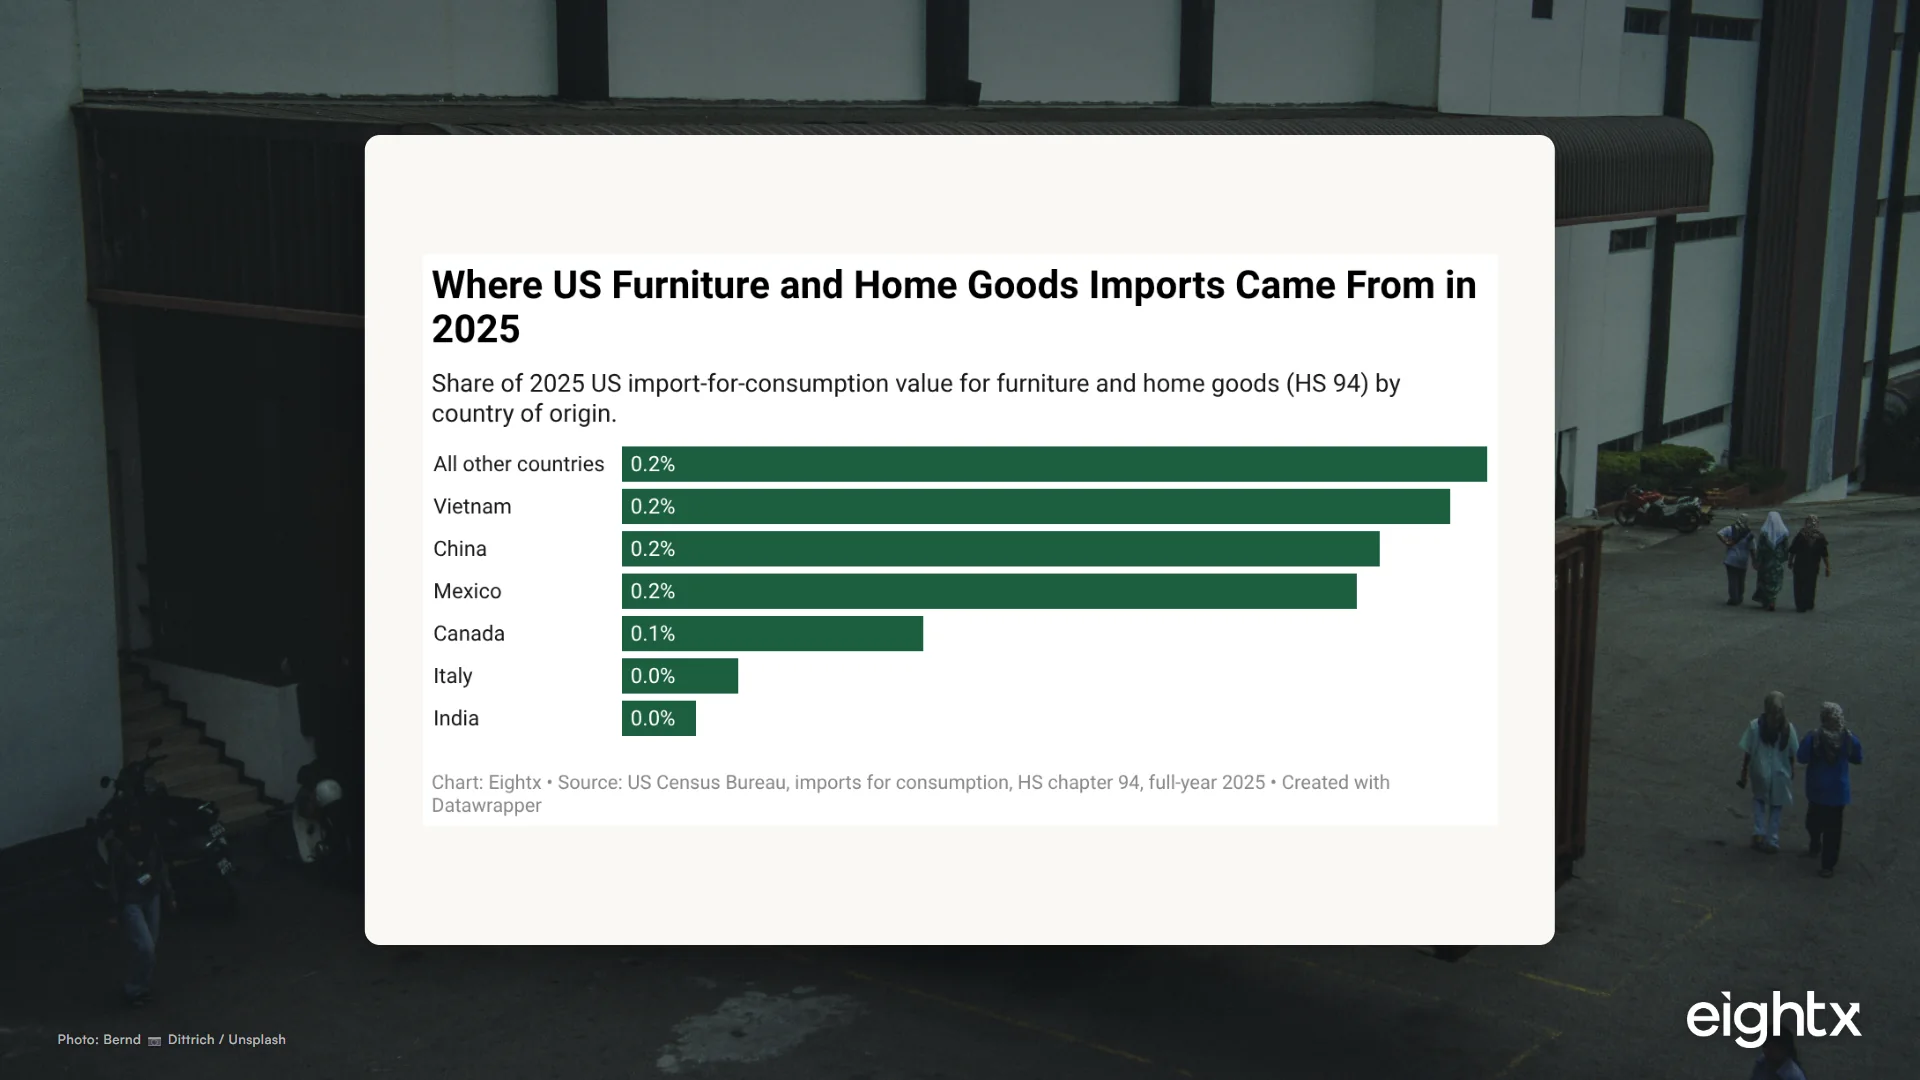
Sandoz's CEO says Europe's medicine supply chain can't avoid a resilience premium. US import data shows American ecom brands are already paying the same tax.
Snap, Dick's, and LiveRamp launched clean-room attribution with a reported $12 ROAS pilot. Here's what reported vs. incremental ROAS actually costs.
QVC Group's Chapter 11 plan was confirmed July 15, 2026, cutting $6.55B of debt to $1.3B. It kept the same pre-filing strategy, and that is the real warning.
Netflix's Q2 2026 revenue grew 13% but shares fell on weak guidance. Here's the ARPU-over-subscriber playbook DTC brands can copy, with Chewy's real numbers as proof.
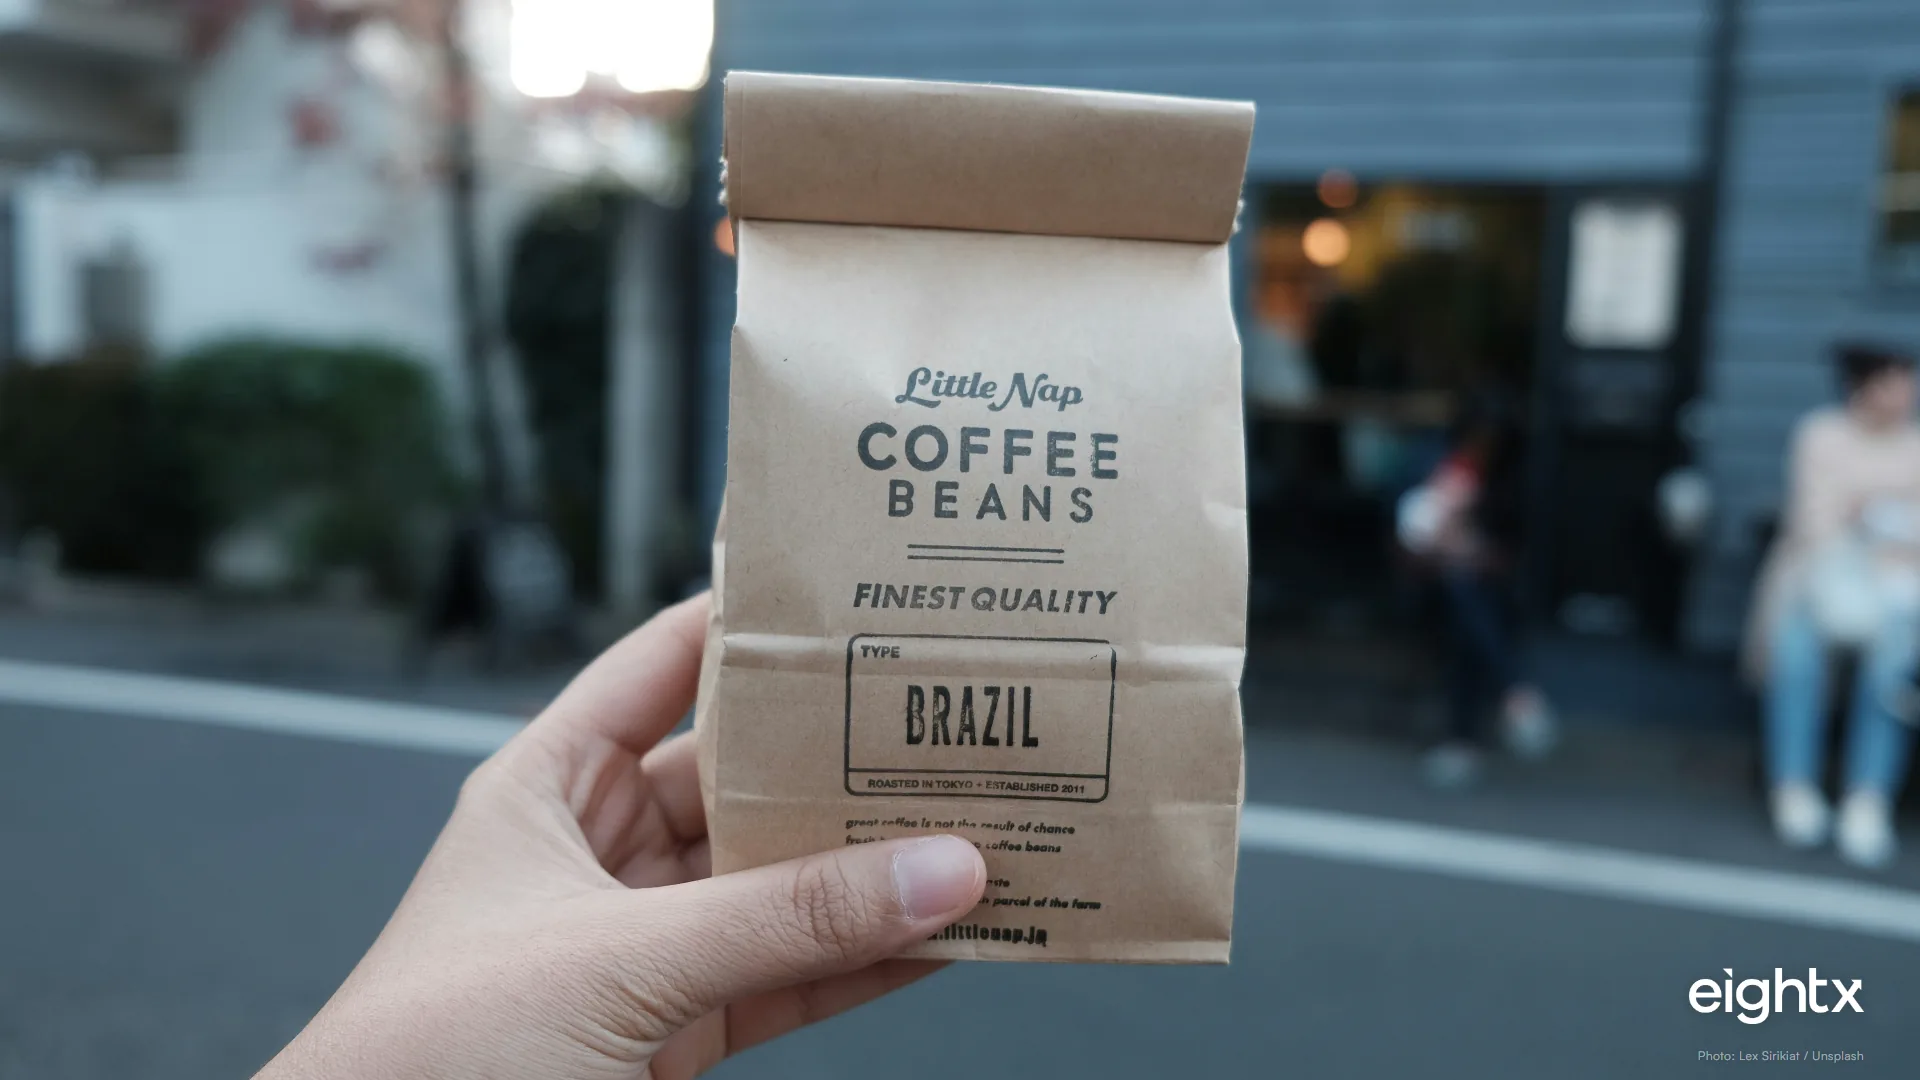
USTR's Brazil tariff, effective July 22, 2026, exempts coffee and orange juice but taxes footwear, ethanol, and sugar at 25%. Here's what's actually exposed.
Verizon confirmed on July 16, 2026 it is selling 274 company-owned stores to franchise operators and cutting 500 jobs. Here's the retail unit-economics math behind the call.
Continuous replenishment vs. periodic ordering: what always-on supply chain infrastructure actually costs to build, from $50K software to $50M automation, and what it saves.
A sloppy year-end inventory count is a tax problem, not an ops problem. Here is the SKU-level count protocol that keeps COGS accurate and your CPA calm.
The 8 accounts a $5M to $15M DTC brand must reconcile before year-end close, the two founders always skip, and the December checklist to hand your bookkeeper.
Cash divided by burn is not your runway. Treasury practice nets committed purchase orders out first, and one real 10-K shows commitments eating 52% of cash.
The five metrics a growth-stage board expects by late February, the three founders bury (LTV:CAC, runway, gross margin), and why burying them costs you trust.
No study says what your CAC does when you double ad spend. Northbeam's 2026 panel: spend +9.6%, CAC +9.7%, separate medians. What elasticity research implies.
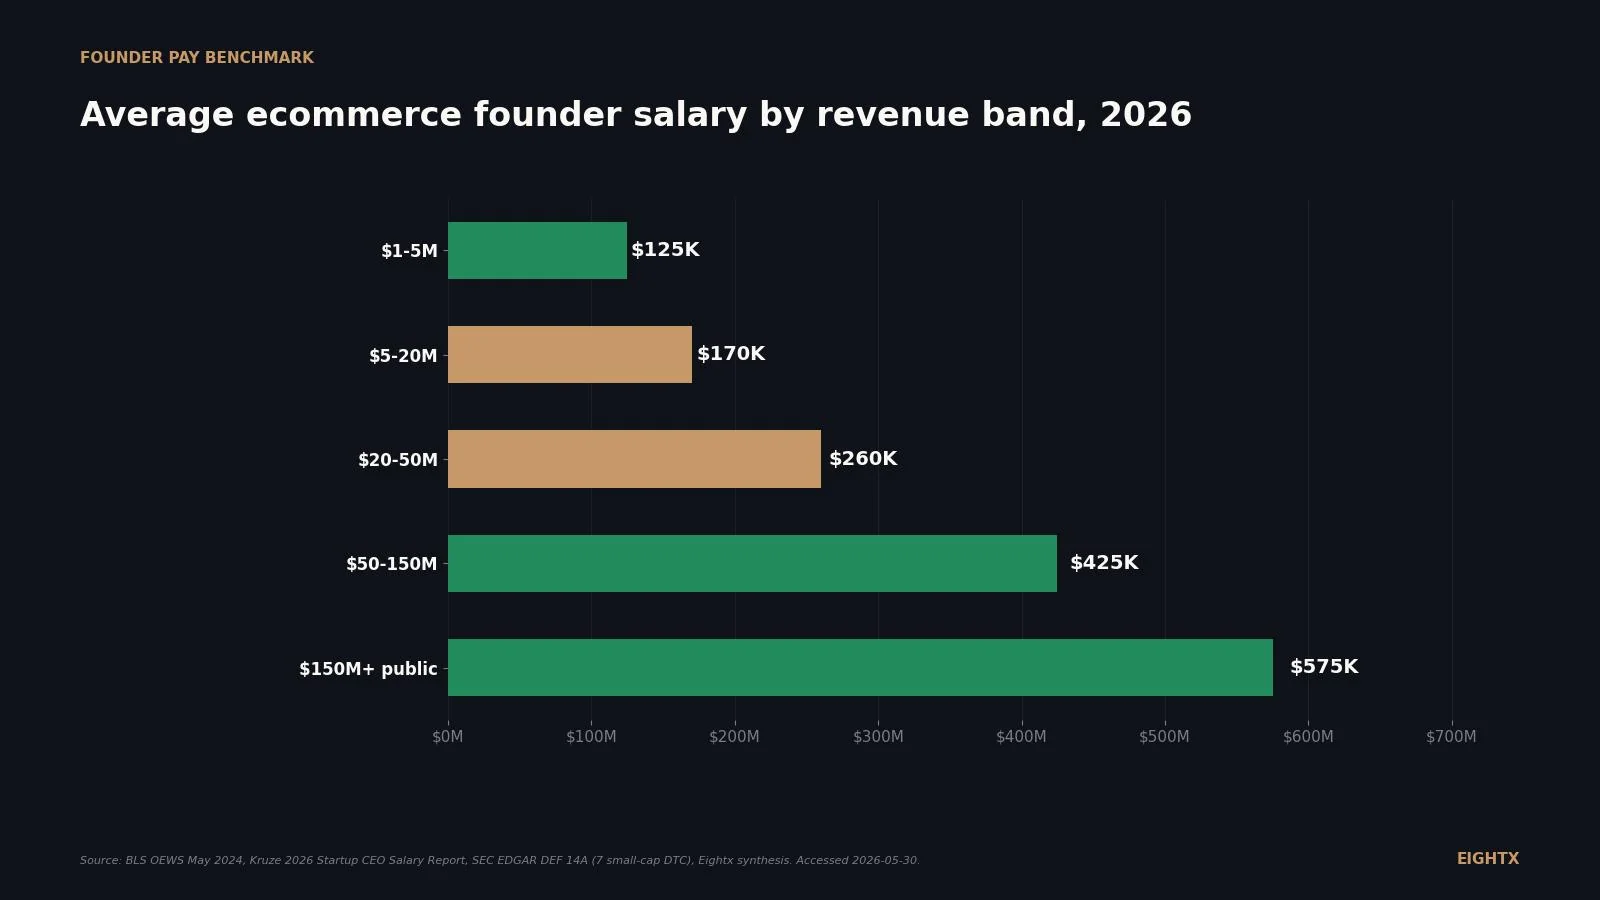
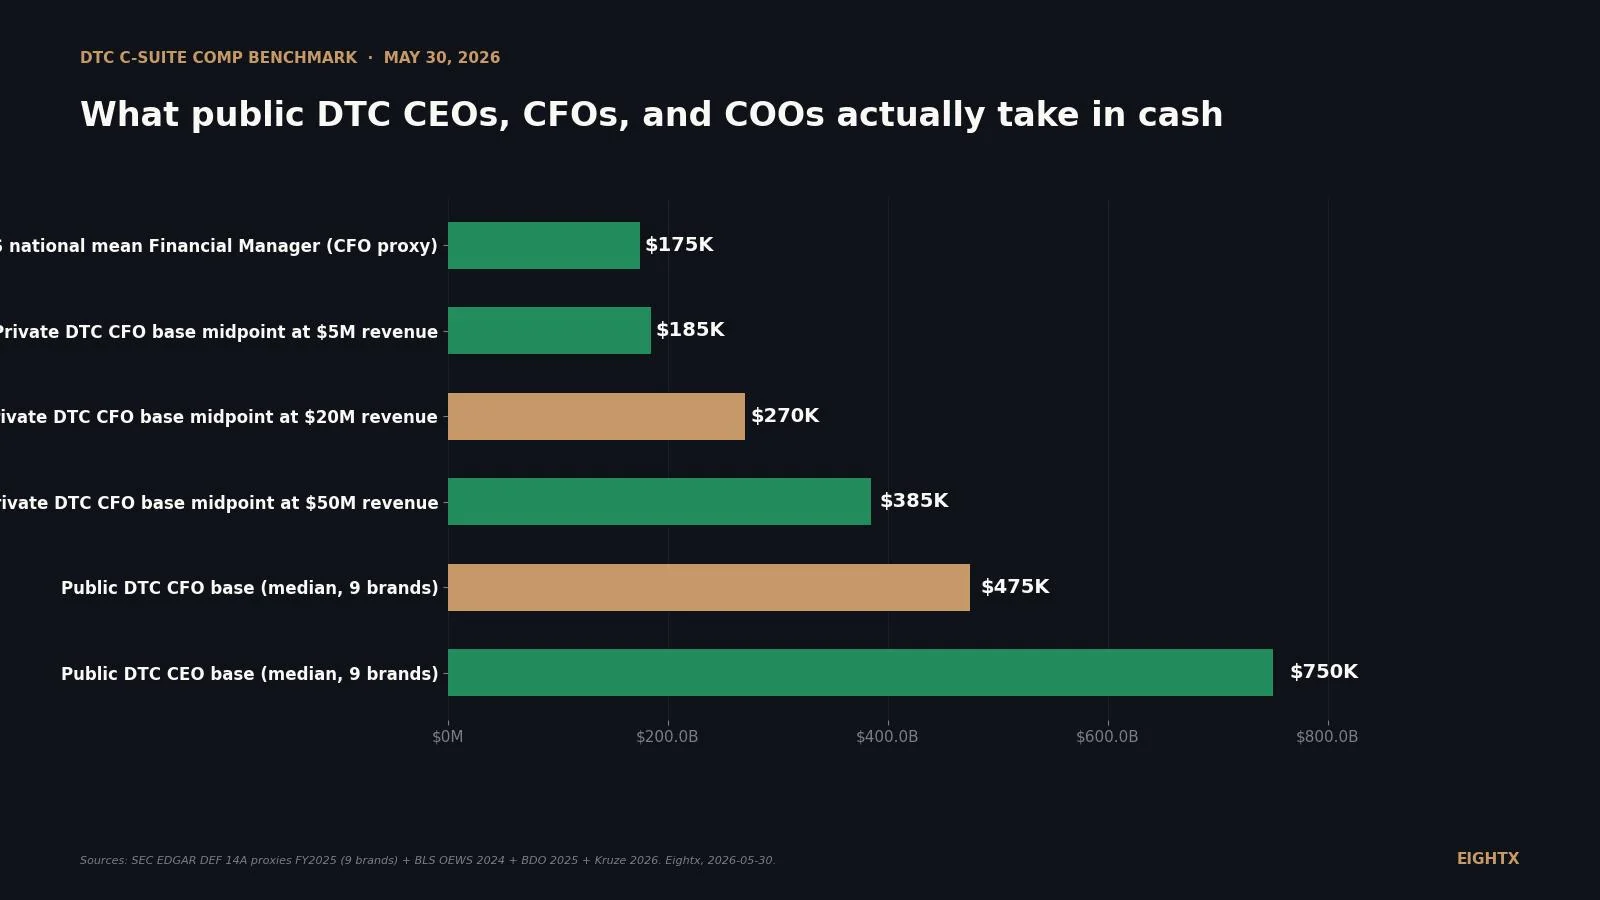
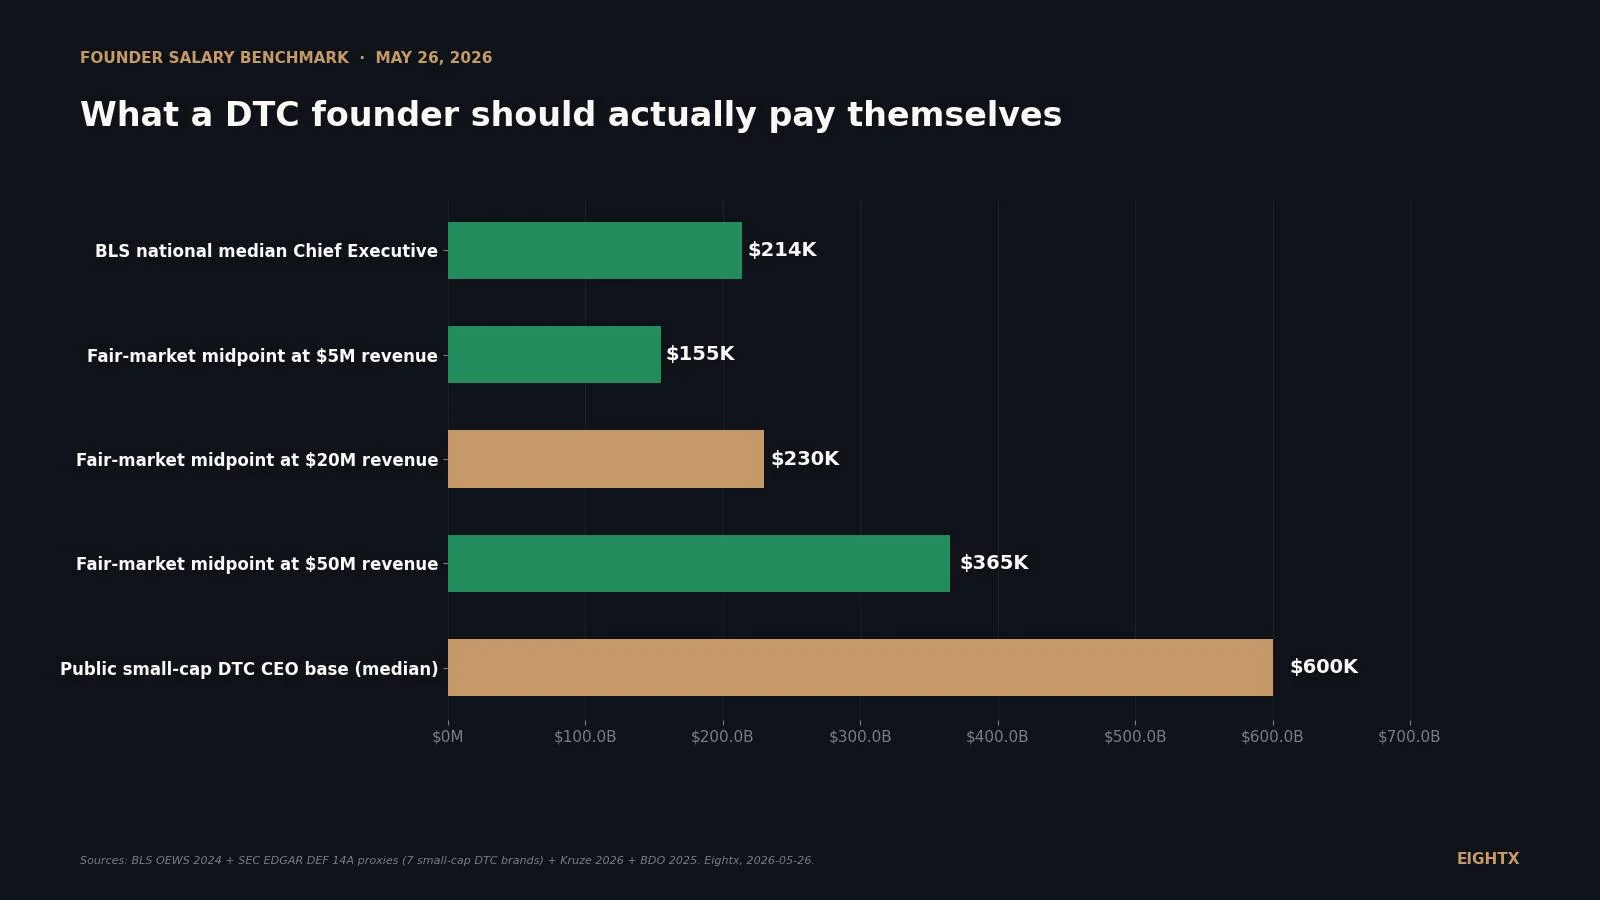
The BLS median CEO wage is $213,990; public consumer brands pay $498K-$808K in base salary. Here's what your under-market draw hides in your EBITDA.
Meta CPMs hit $17.70 on Cyber Monday 2024 and discounts ran 21-29%, compressing DTC contribution margin from 20% to 9%. The scorecard to run the morning after.
No one has published data proving your top-revenue SKU is your worst-margin one. But every cost lever that would cause it is documented. Here's the math to run.
Steve Madden cut China sourcing from 71% to the high thirties in under a year. A teardown of what the tariff pivot cost, what it saved, and why wholesale bled first.
Central Garden & Pet (CENT) revenue fell to $3.13B in FY2025, yet gross margin hit a 5-year high of 31.9%. A teardown of how a $3B roll-up funds durable brands.
Wolverine World Wide hit $1.02B net debt at its FY2022 peak. Six brand sales plus two sale-leasebacks raised $308M. Here is how the paydown worked and where gross margin went.
Nike's DTC push drove gross margin to 46.0% in FY2022, then wholesale retreat left no outlet for a $9.7B inventory glut. Margins fell to 42.7%. The operator lesson.
WD-40's gross margin fell to 49.1% in FY2022, then climbed back to 55.1% by FY2025 on price and mix. What one-product pricing power teaches ecommerce operators.
GoPro revenue fell 44% from $1.16B (2021) to $652M (2025) and gross margin slid from 41% to 34%. A teardown of what single-product concentration does to a hardware brand.
Profitable on paper, broke in the bank? The gap is Days Inventory Outstanding. DIO benchmarks by DTC vertical, public 10-K data, and the math on cash locked in stock.
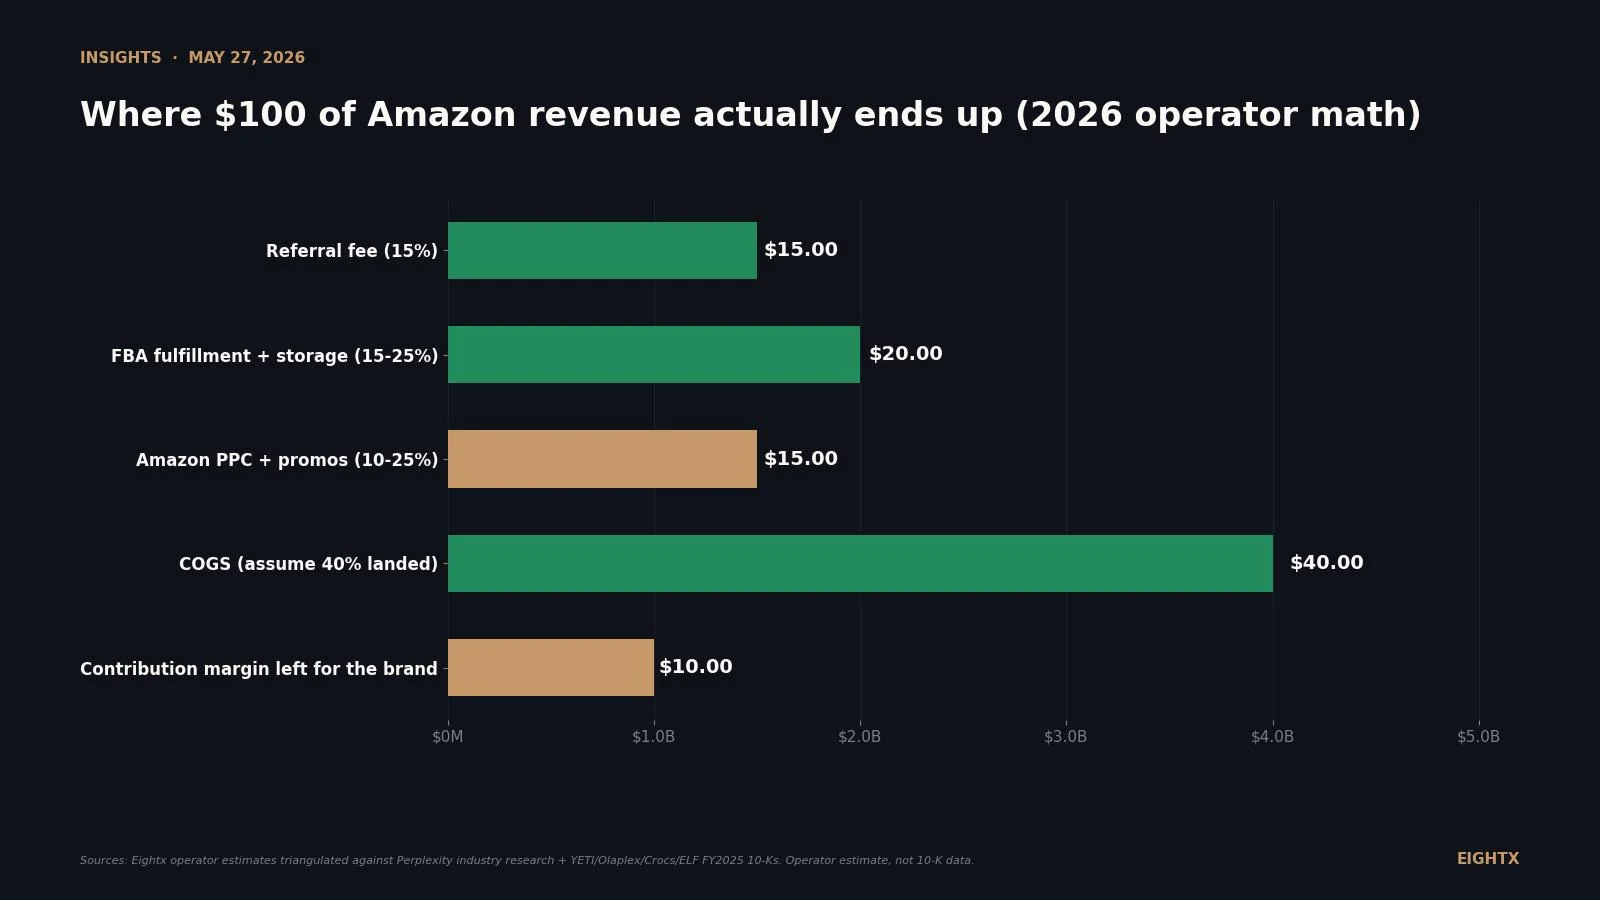
Amazon takes roughly 45% of a $30 apparel sale once you total every fee: referral, FBA, storage, placement, returns, and the ad spend no one calls a fee.
Columbia Sportswear has zero long-term debt and $442M in cash, yet operating margin fell from 14.4% to 6.1% in four years. What a stalled $3.4B brand teaches operators.
A DICK'S Sporting Goods (DKS) teardown from SEC filings: gross margin fell 38.3% to 32.9% and operating margin 16.5% to 6.4% as capex and the Foot Locker deal reshaped it.
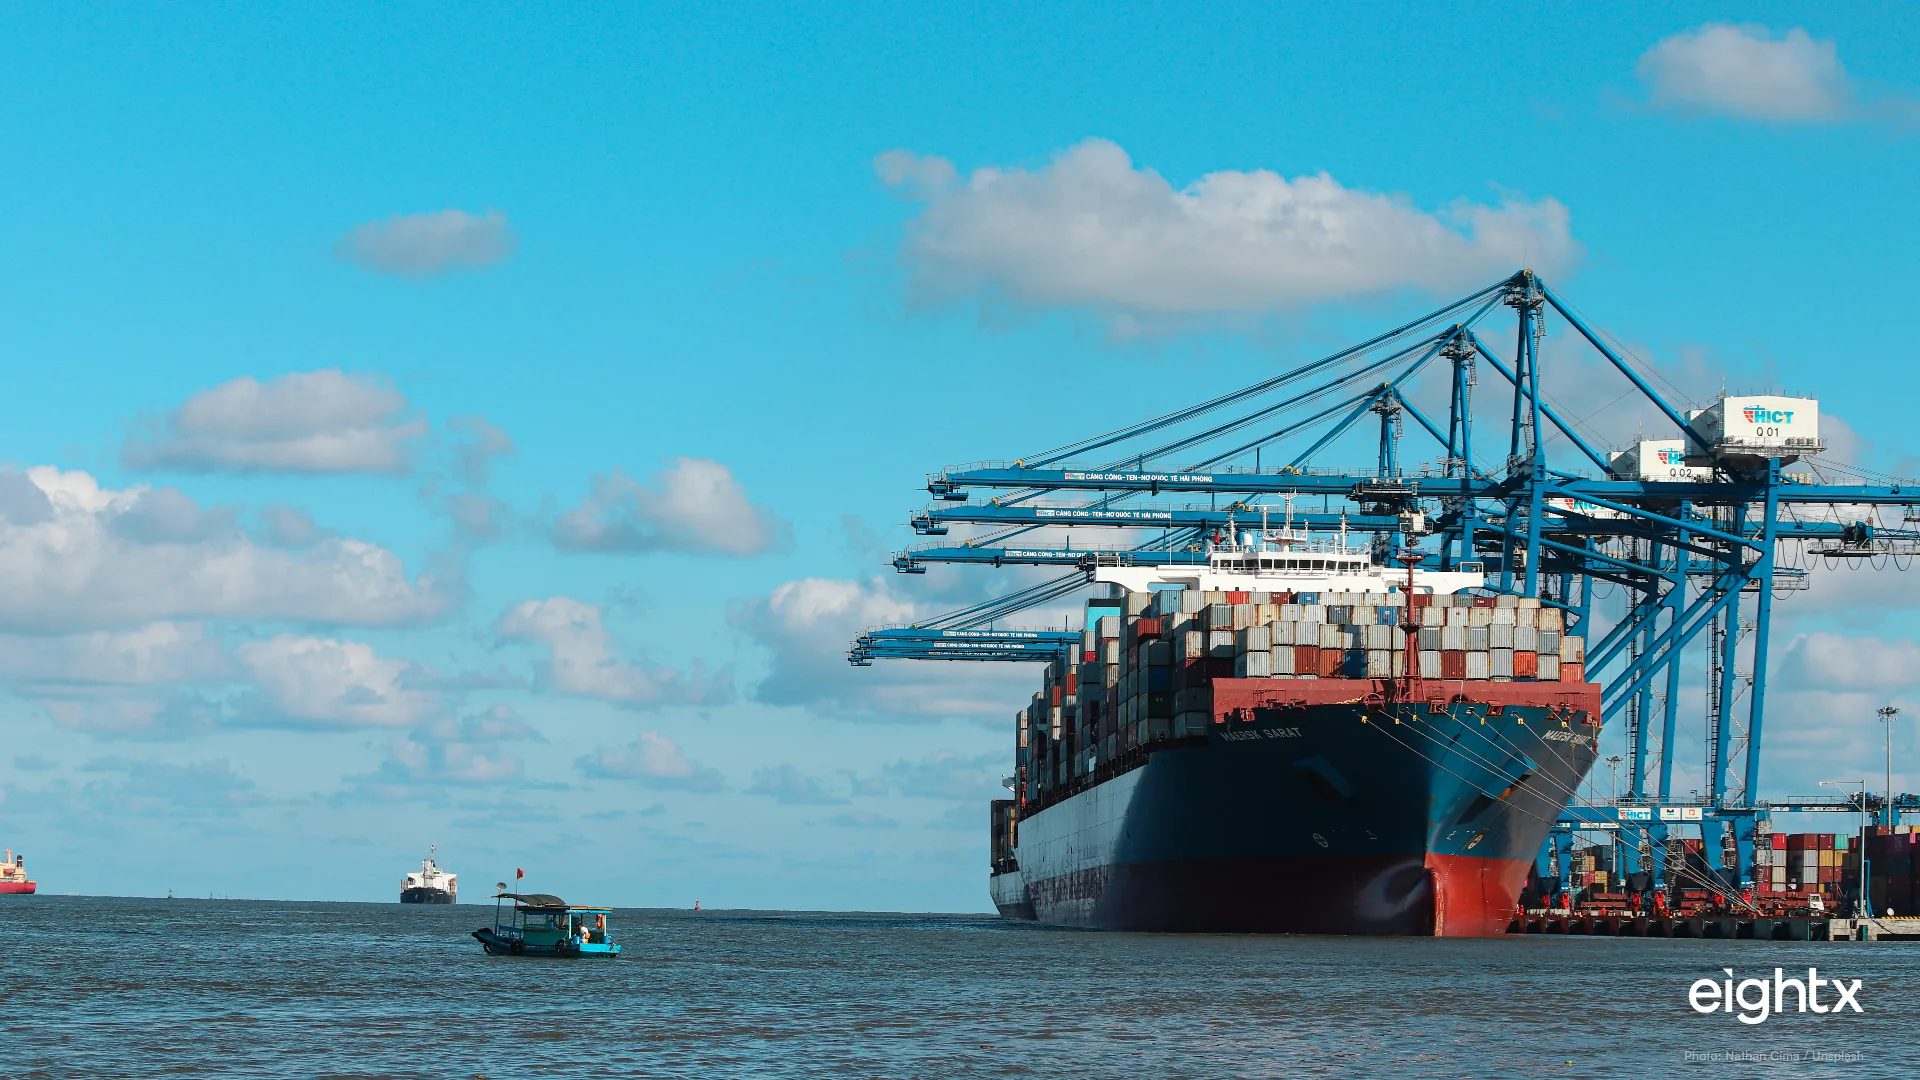
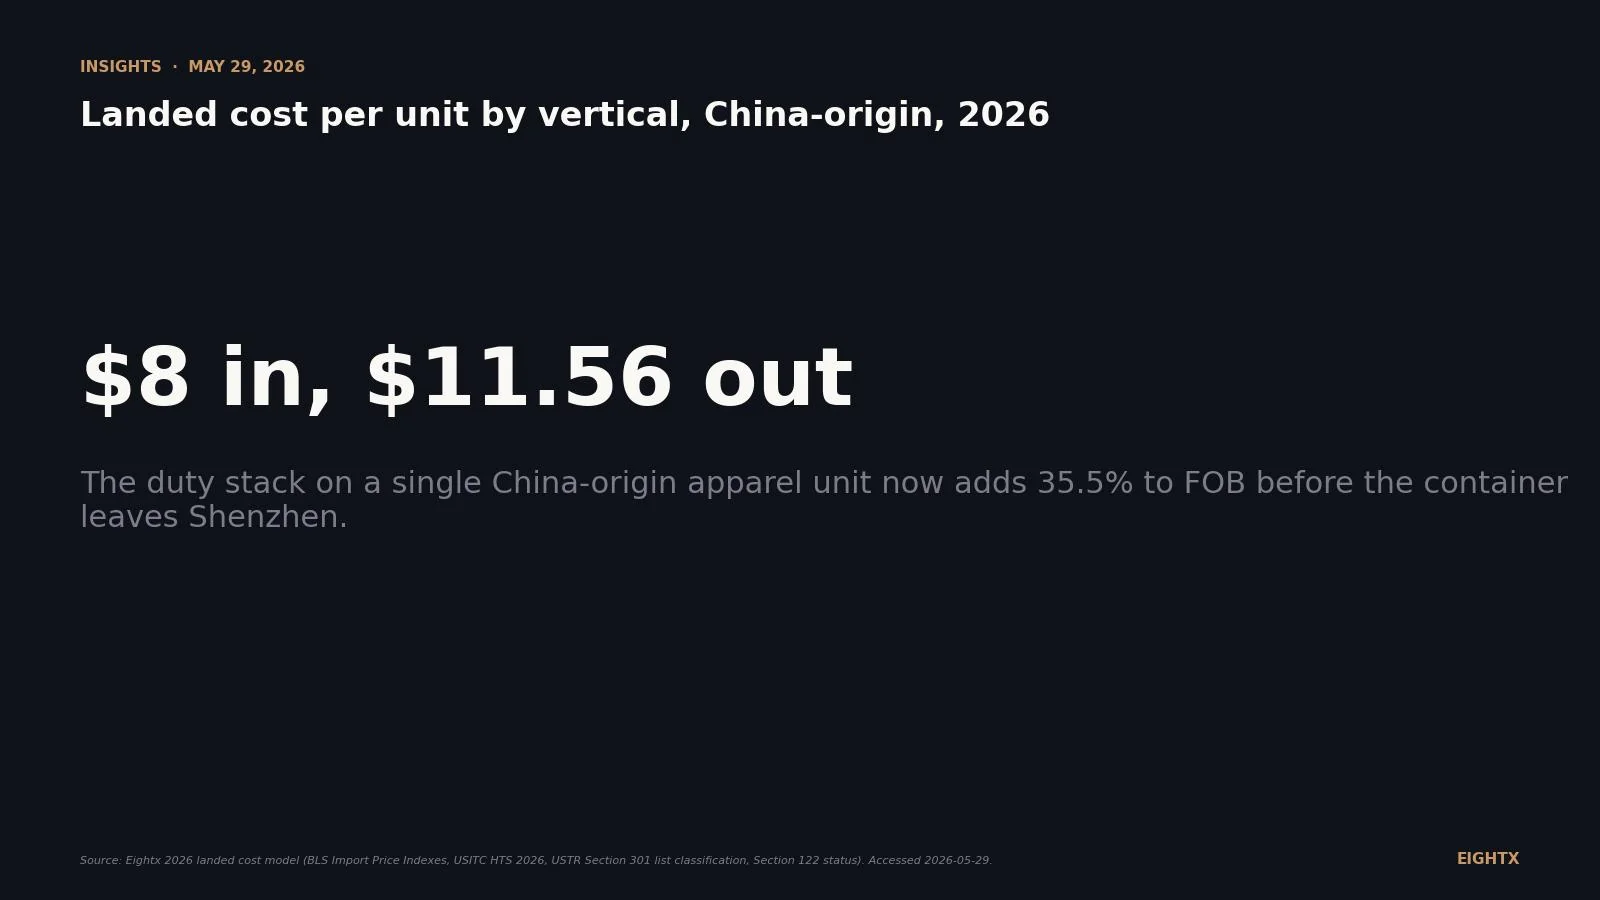
VLCC tanker rates up 4x, war-risk insurance near 1% of hull value, a $192M Maersk Ocean loss: what the 2026 Hormuz crisis has cost, and what it means for your landed cost.
Aldi confirms 90%+ private label and $282.8B in US store-brand sales in 2025. The SKU pricing playbook for CPG brands facing a hard discounter.
Vietnam container freight hit $9,260 the week of July 10, 2026, a four-year high. The tariff gap versus China still dwarfs the freight premium. Here's the math.
General Mills is targeting $3B in savings by 2030 via supply-chain redesign. Here's the contribution-margin-by-SKU framework to run the same analysis on your own product line.
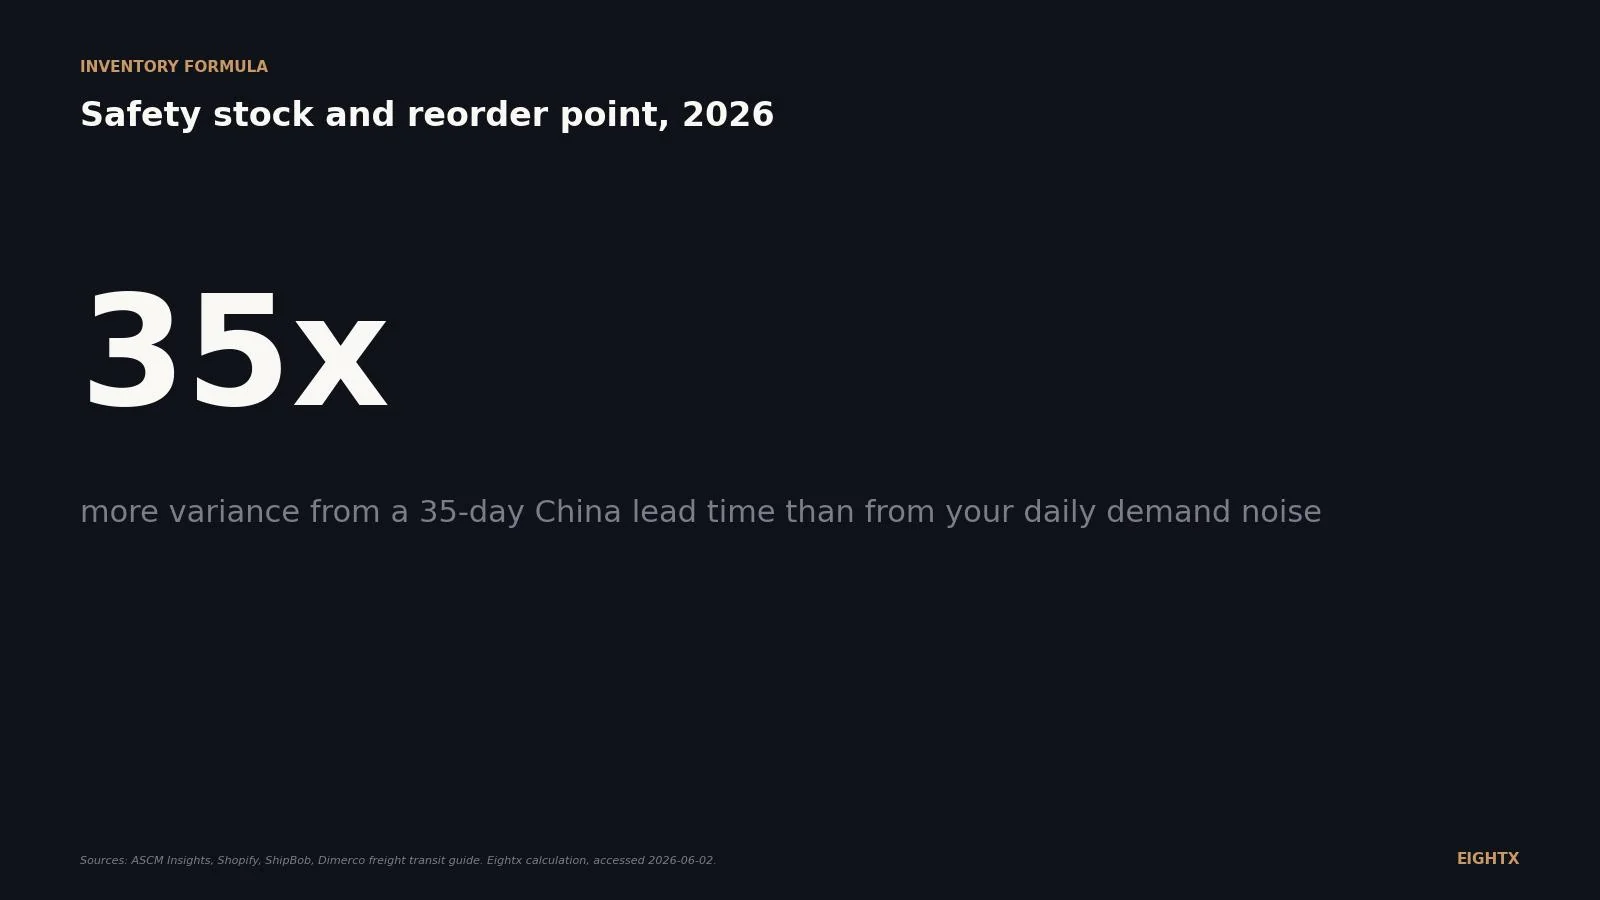
Safety stock costs 20-30% of its value every year in tied-up cash. The Z-score formula, a free calculator, and a case where cutting the buffer freed $84M.
Amazon's 2026 holiday peak fees run Oct 15-Jan 14. The '$0.32 average' leaves out a year-round 3.5% fuel surcharge on an already-higher base fee. See the real all-in cost.
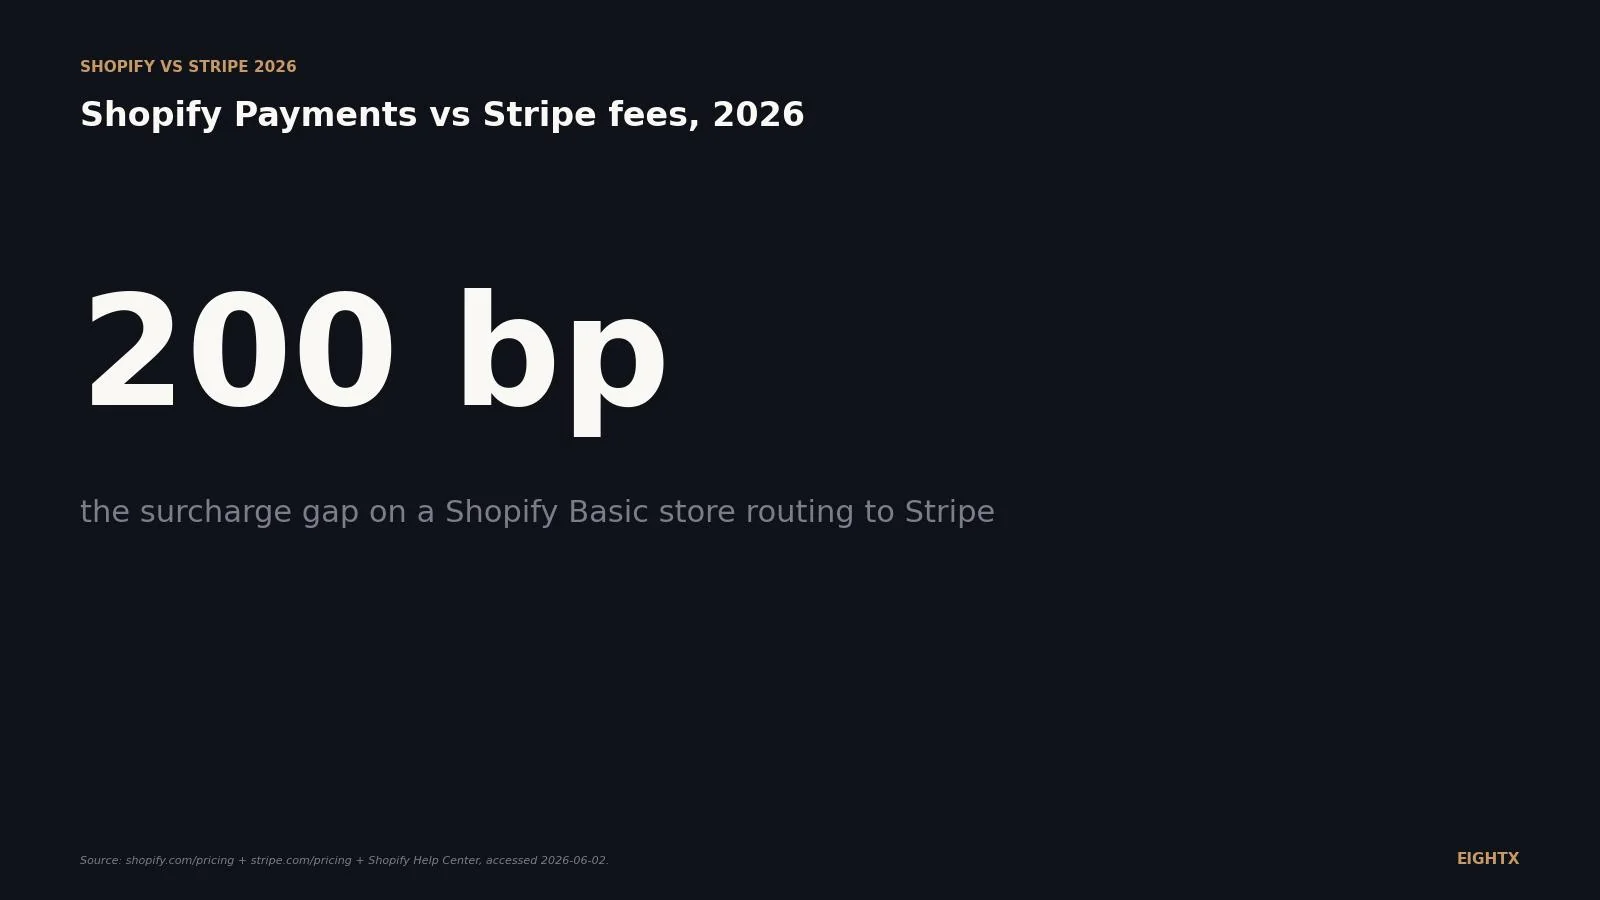
Most Shopify brands pay 3 to 5% of revenue in platform fees before a single ad dollar. A line-by-line breakdown of subscription, processing, surcharges and apps.
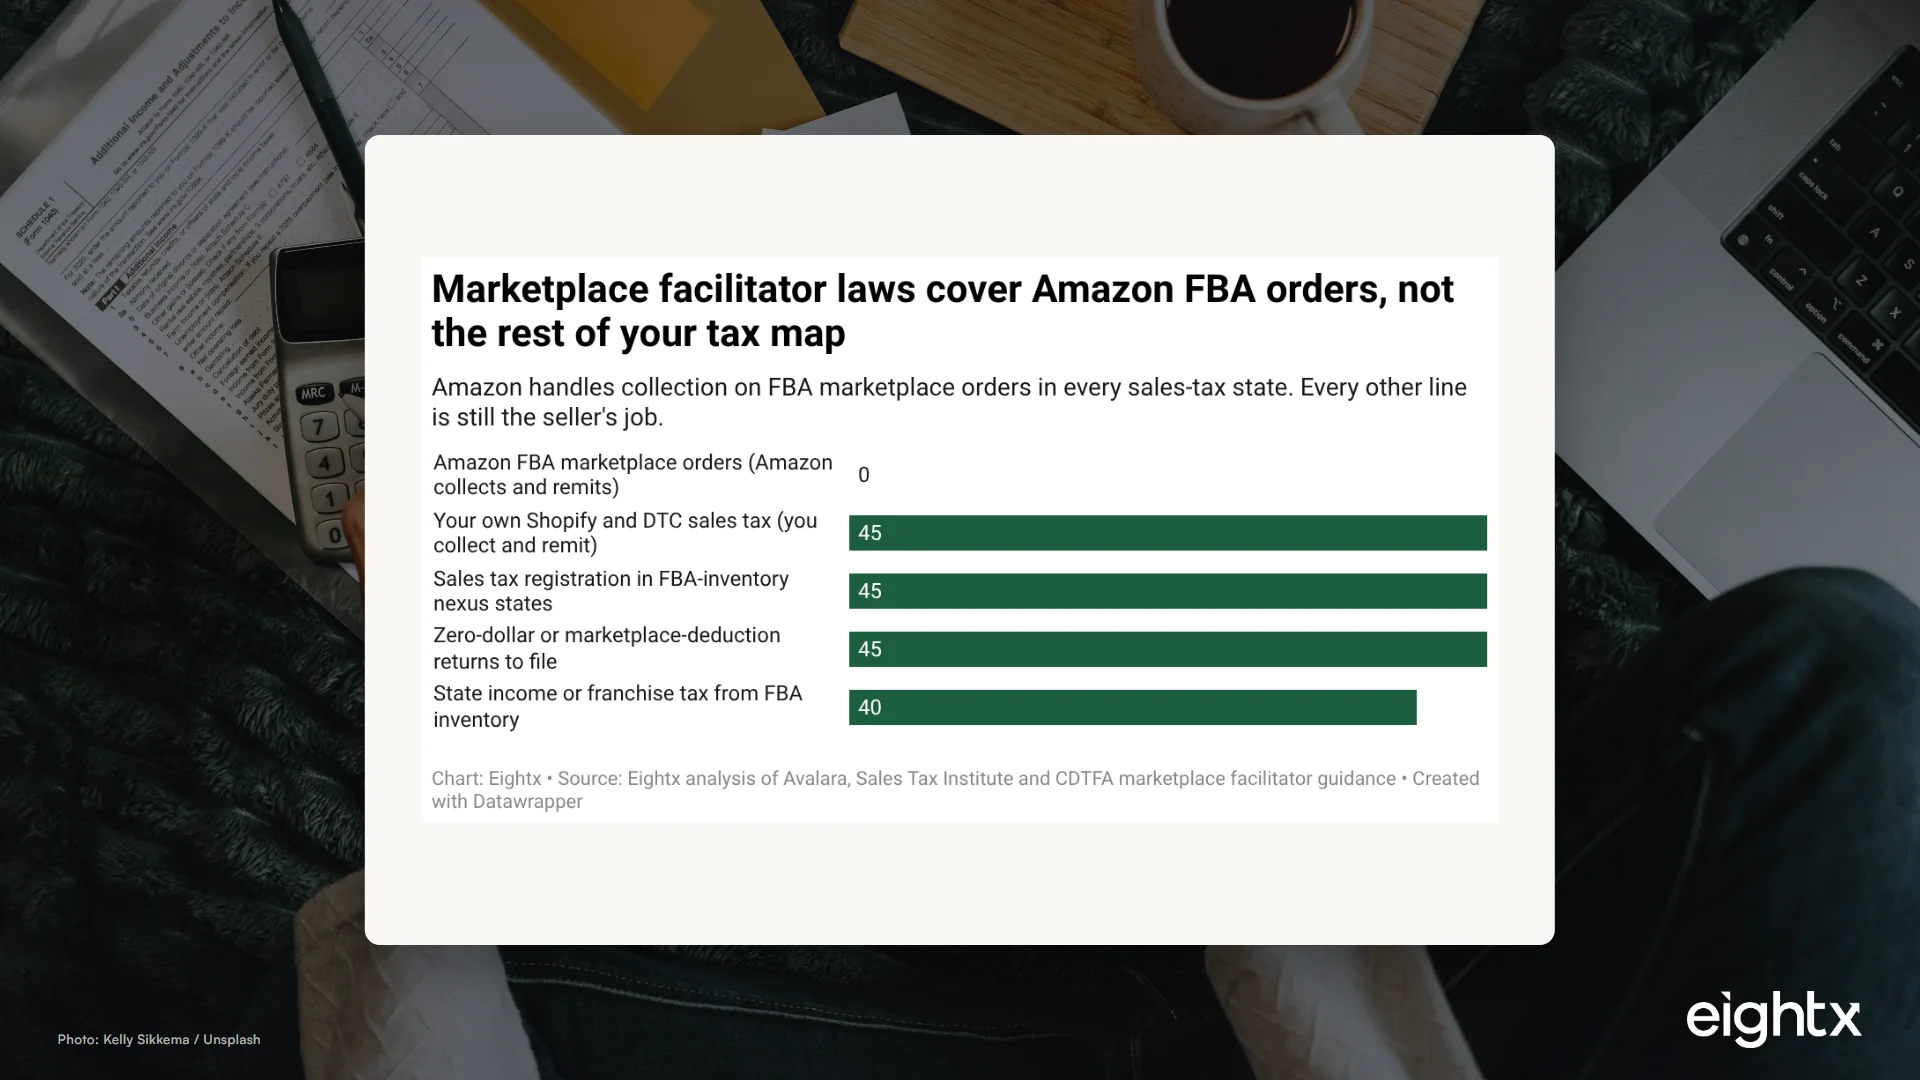
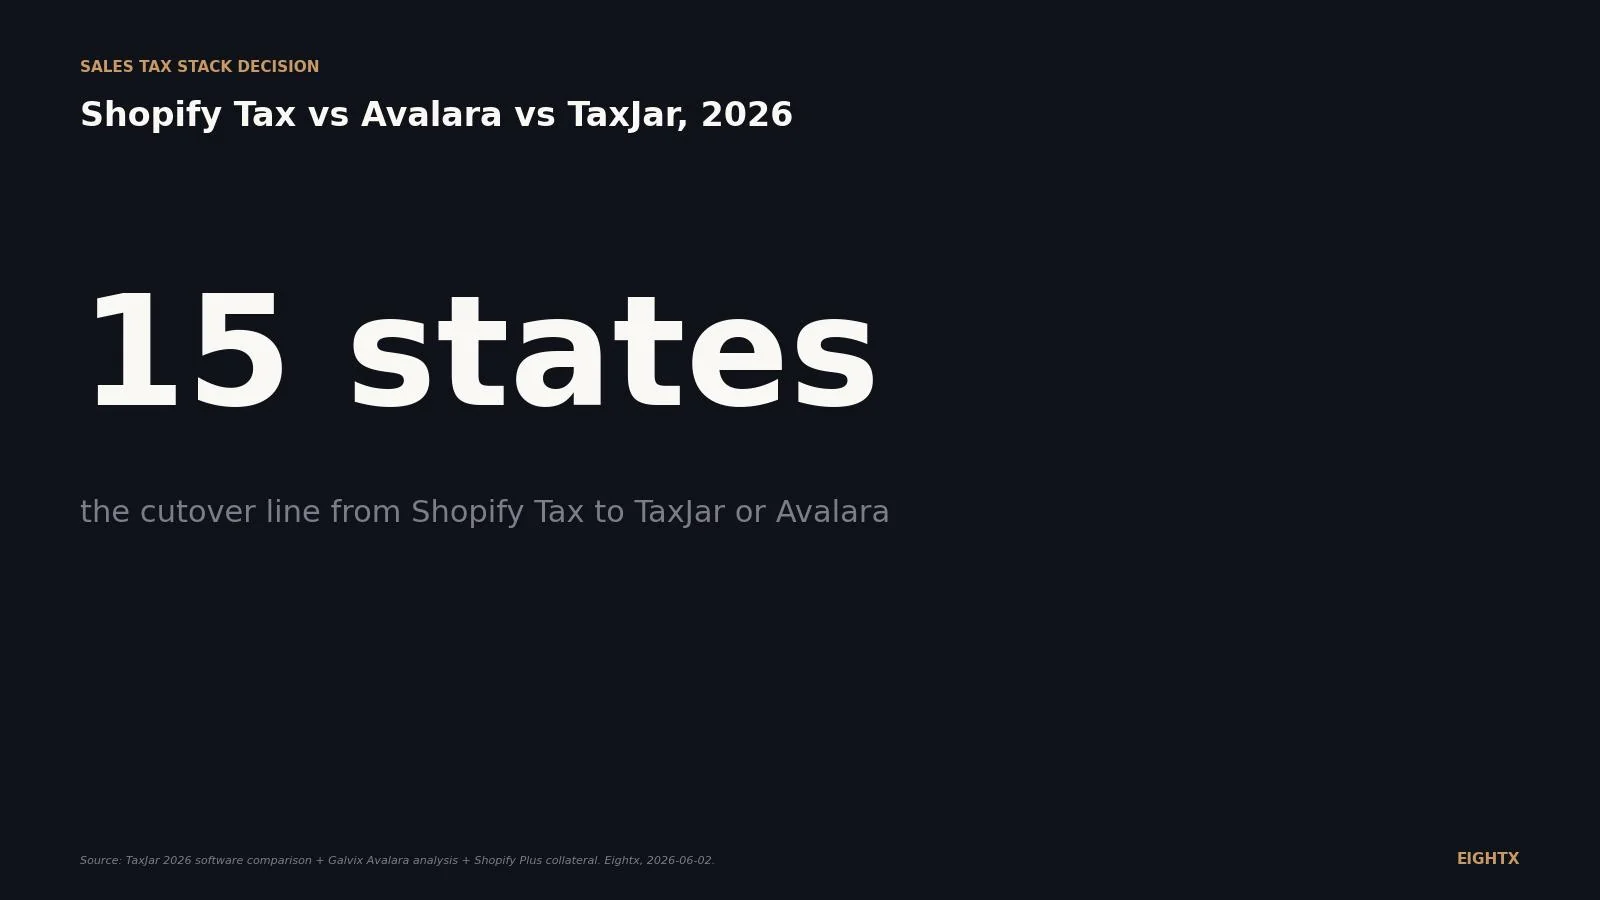
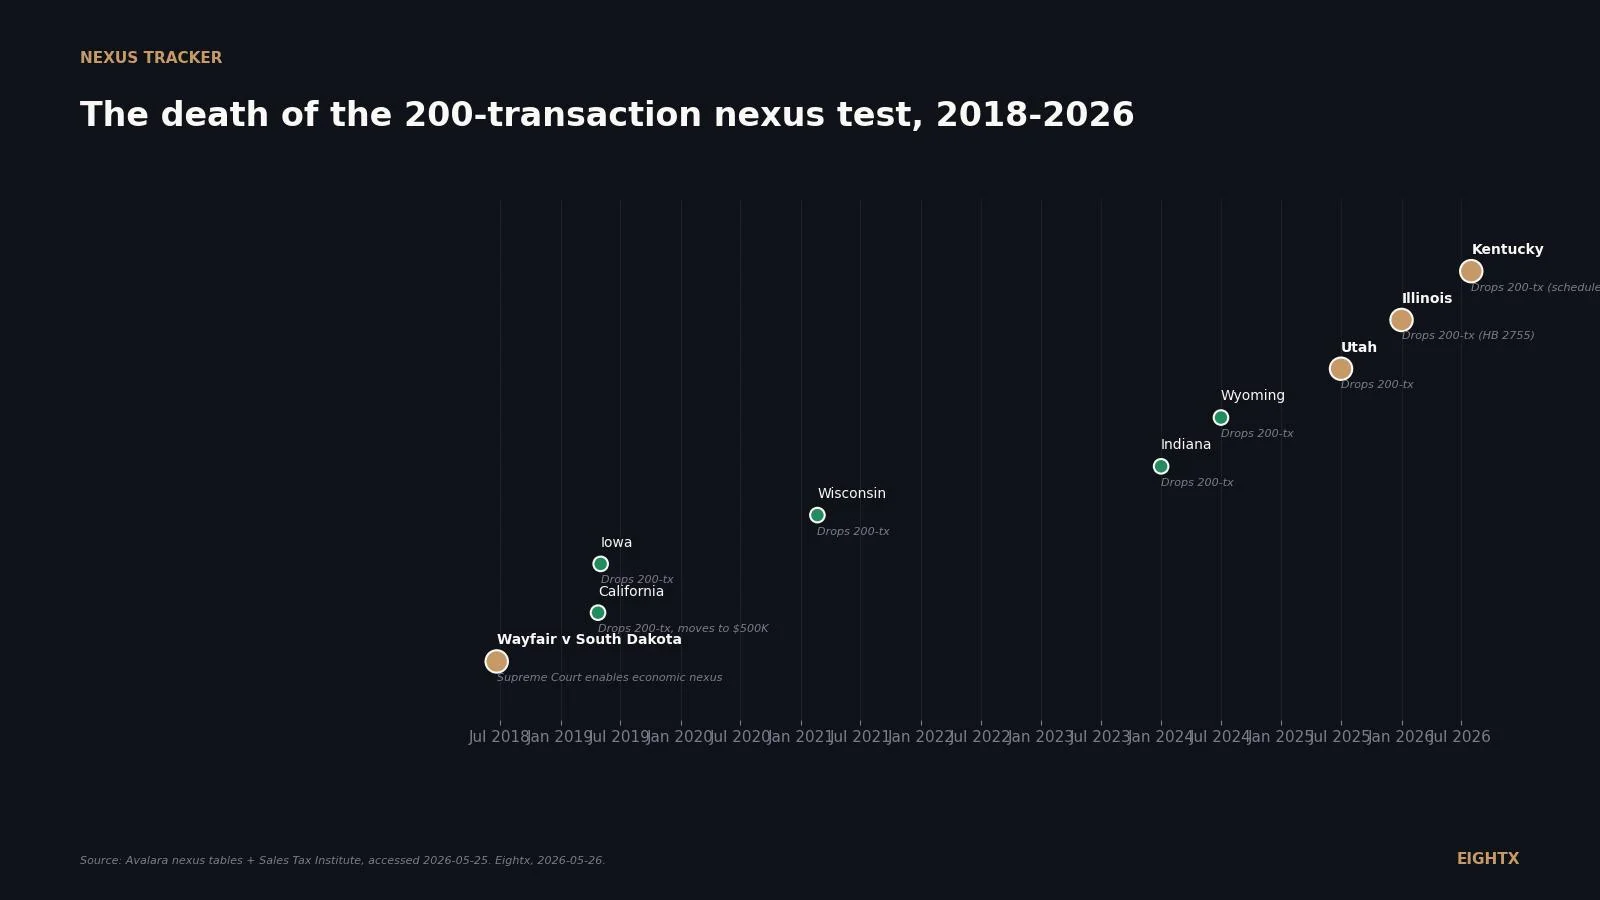
Every state's economic nexus threshold in one map. Most trigger at $100K in sales; CA, TX and NY at $500K. Where DTC brands owe back tax, and how to fix it.
A 4x ROAS can still lose money on every new customer. Here is the breakeven ROAS formula, the returns math founders miss, and how to set a real ad target.
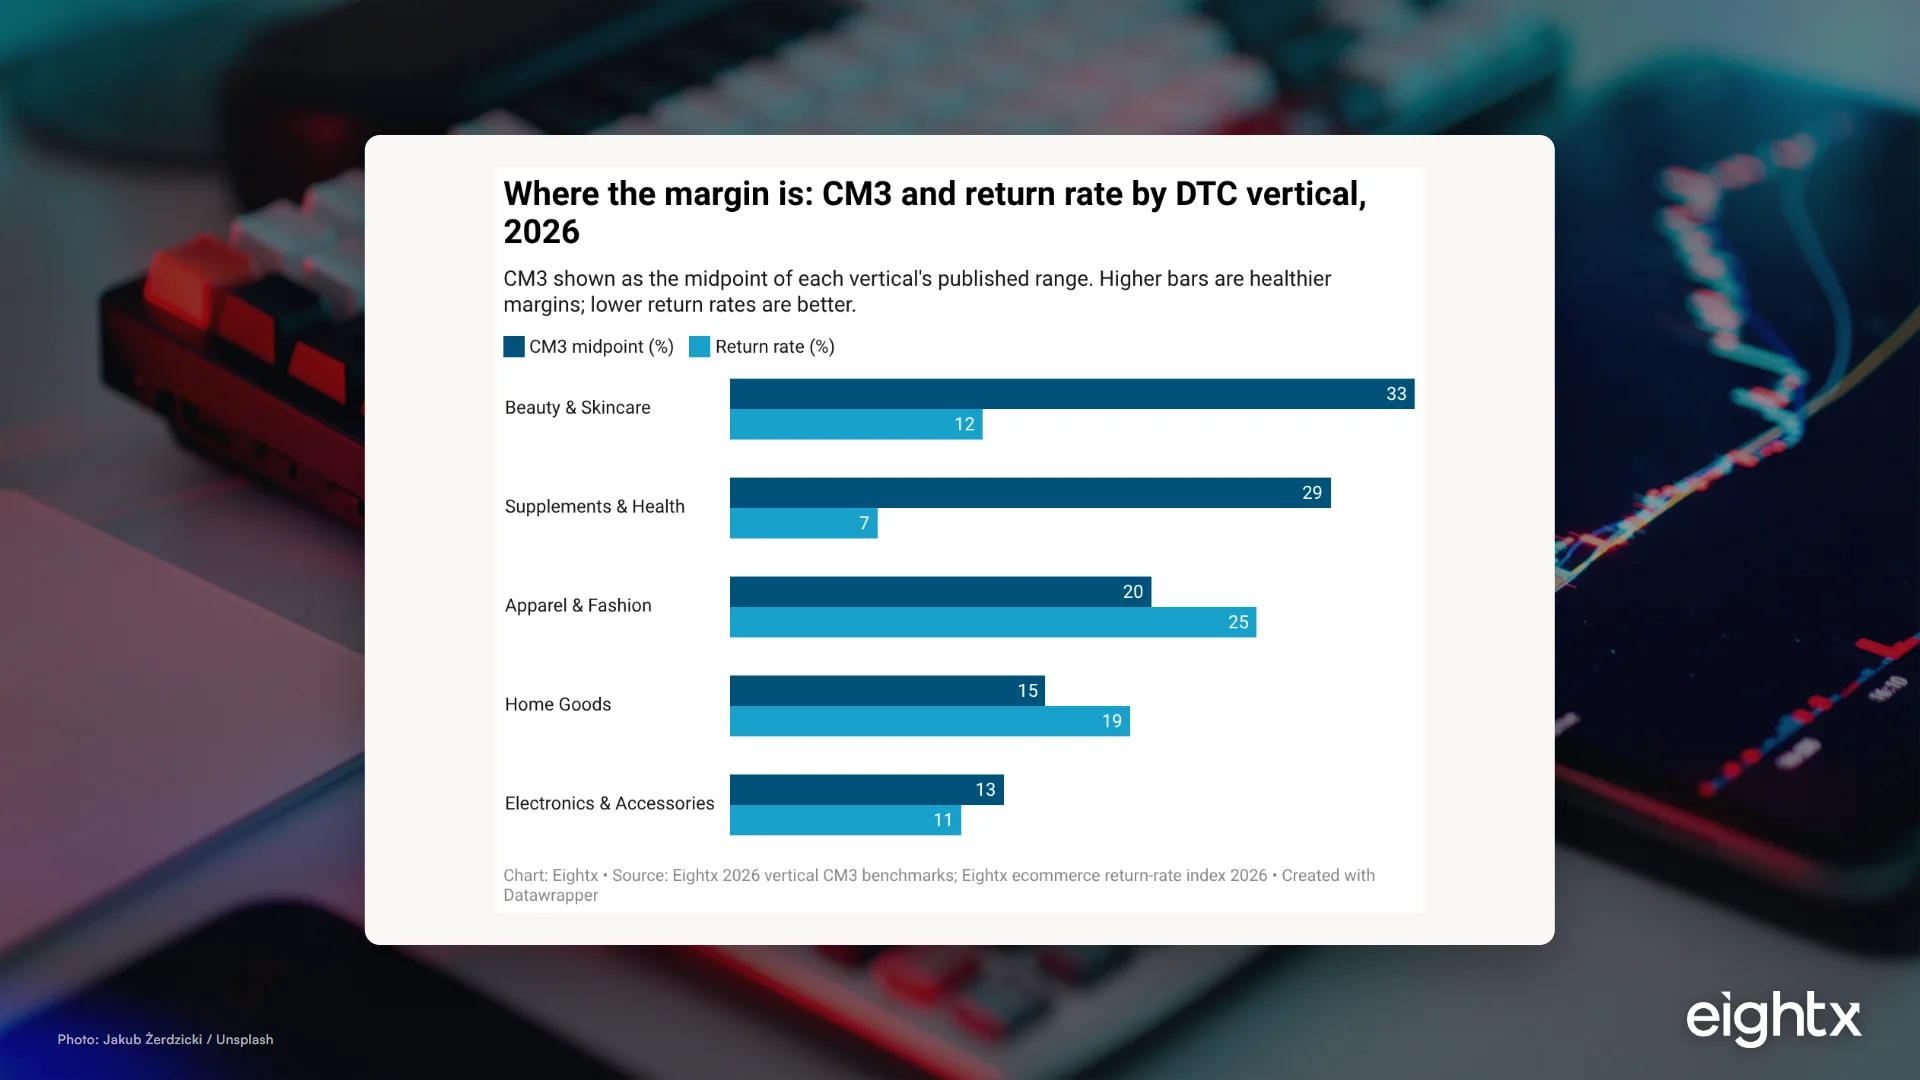
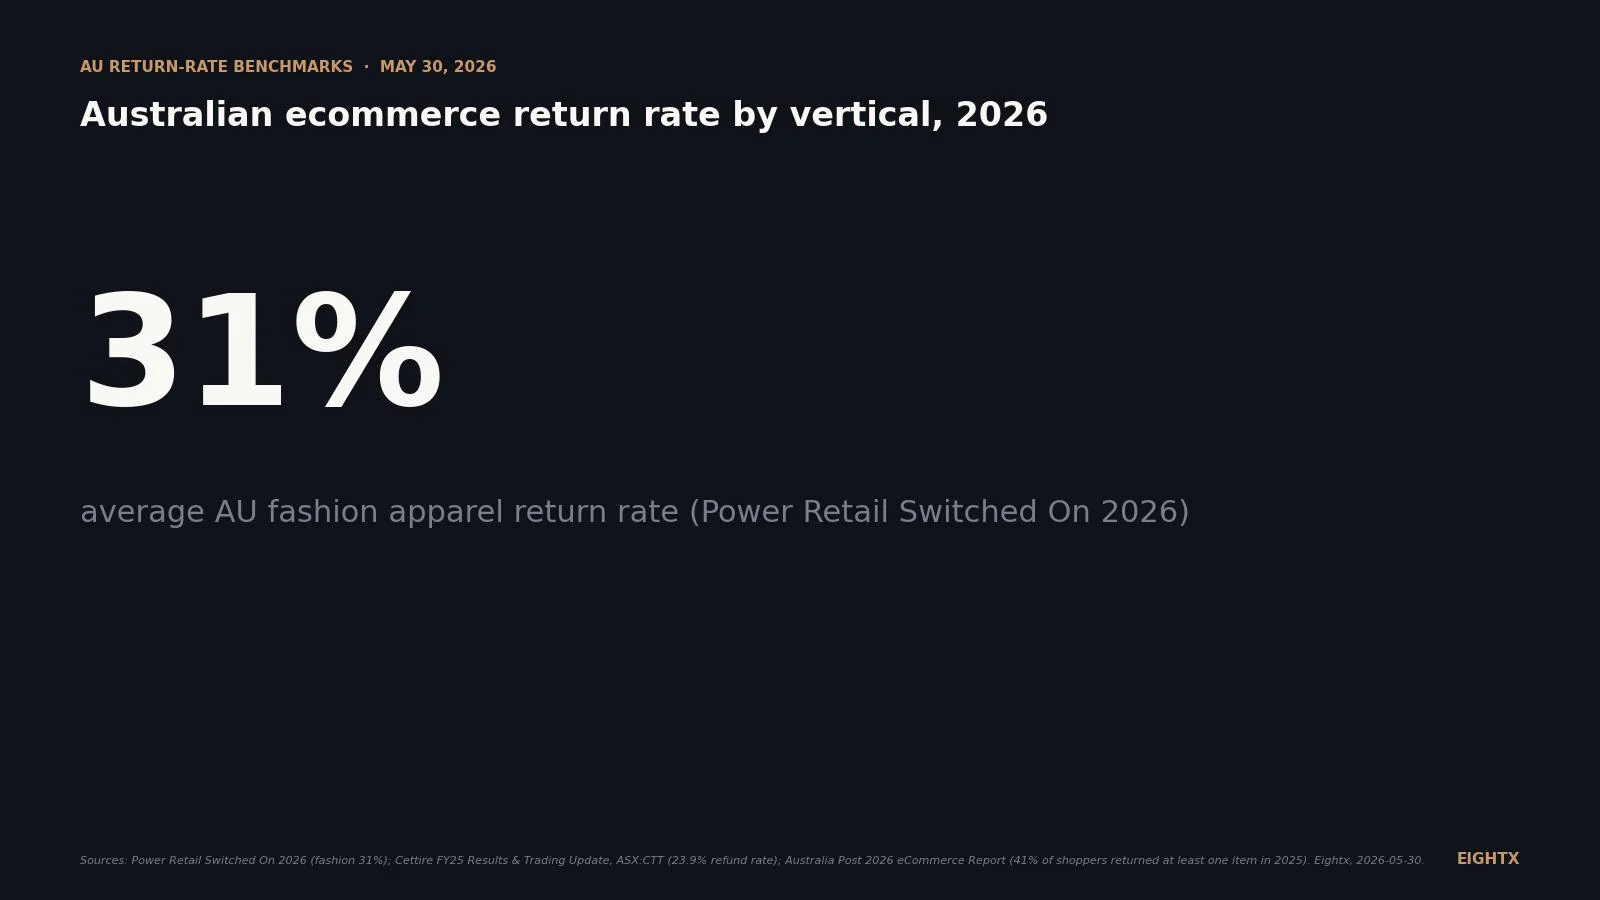
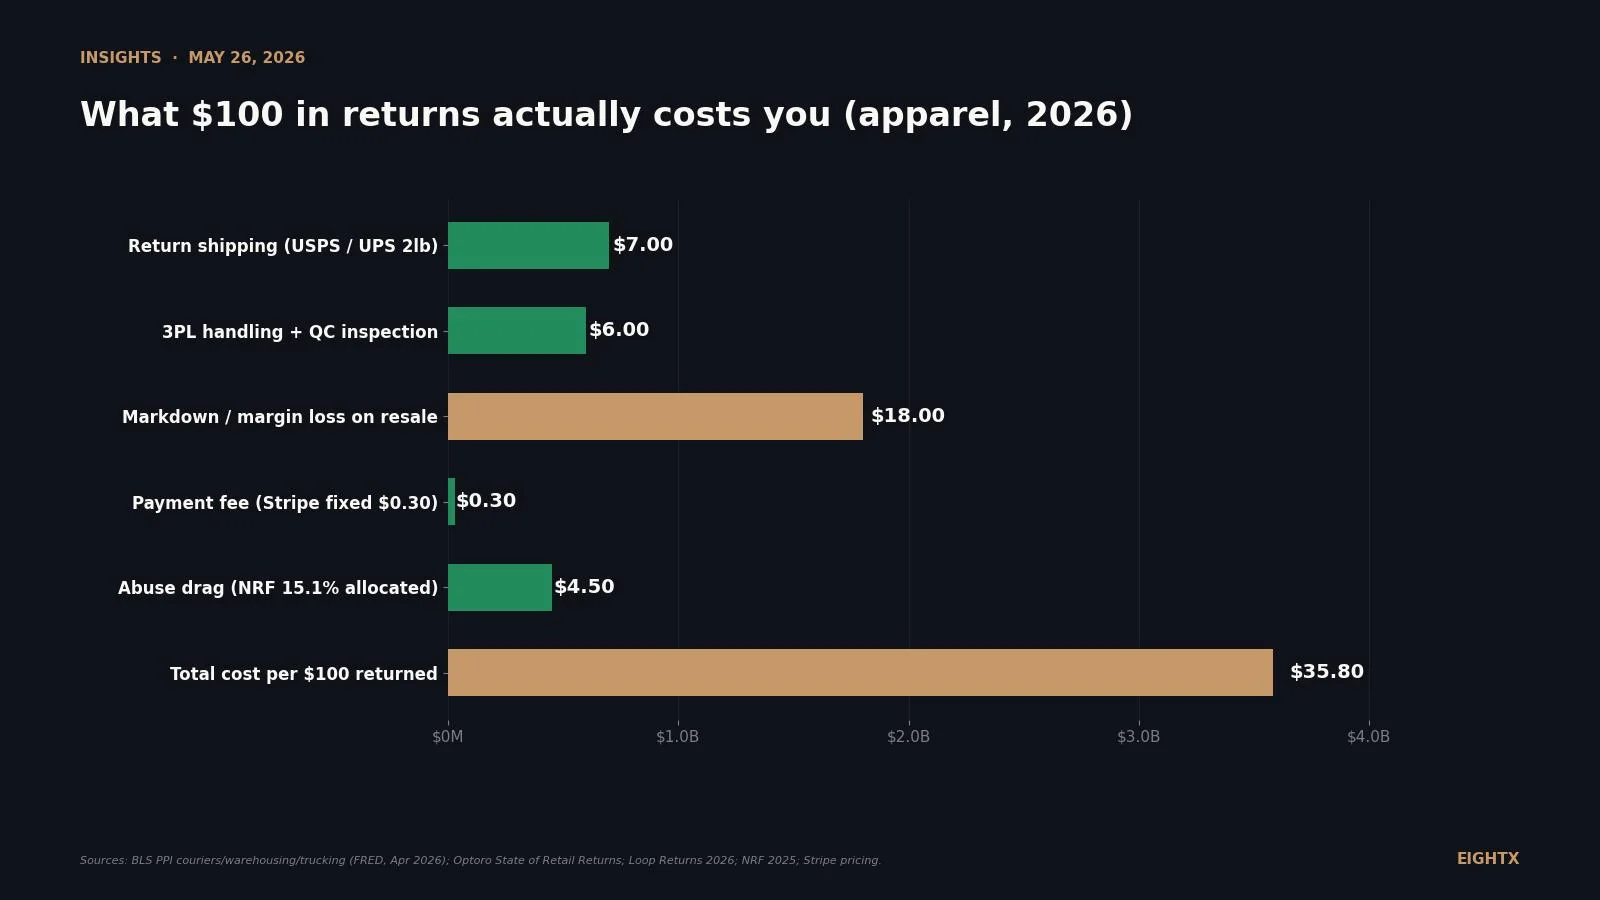
Ecommerce return rate benchmarks by category for 2024: apparel 23-26%, home goods 8-20%, beauty 4-10%. What your number costs at your gross margin.
Free shipping is a variable cost, not a policy. The break-even AOV formula, threshold benchmarks by vertical, and how to set a bar that pads margin instead of eating it.
DTC founder salary benchmarks at $1M, $3M, $5M and $10M, anchored to BLS General Manager wages. Includes exit normalization and IRS S-corp guidance.
Gross margin, contribution margin, and EBITDA benchmarks for a $2M-$5M DTC brand: median 52-58% GM, 20-28% CM, 4-7% EBITDA. Where you actually stand.
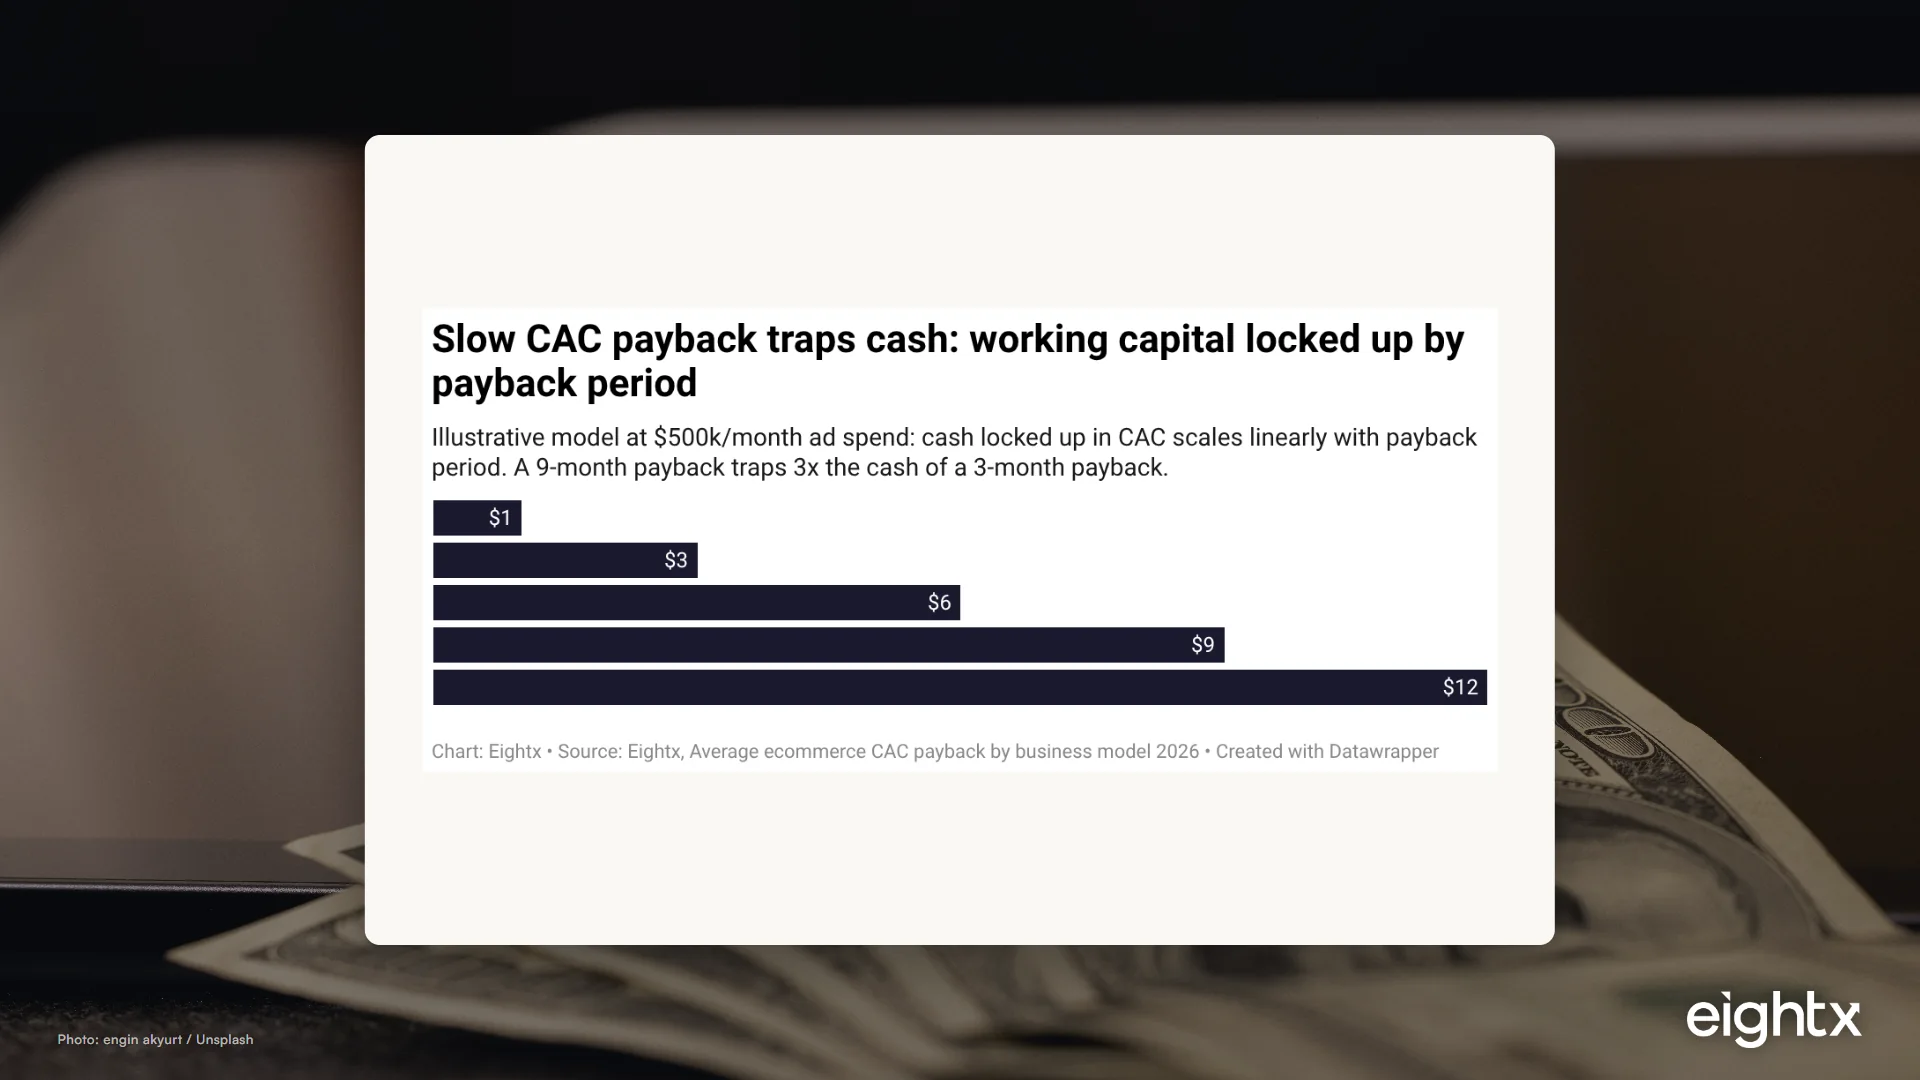
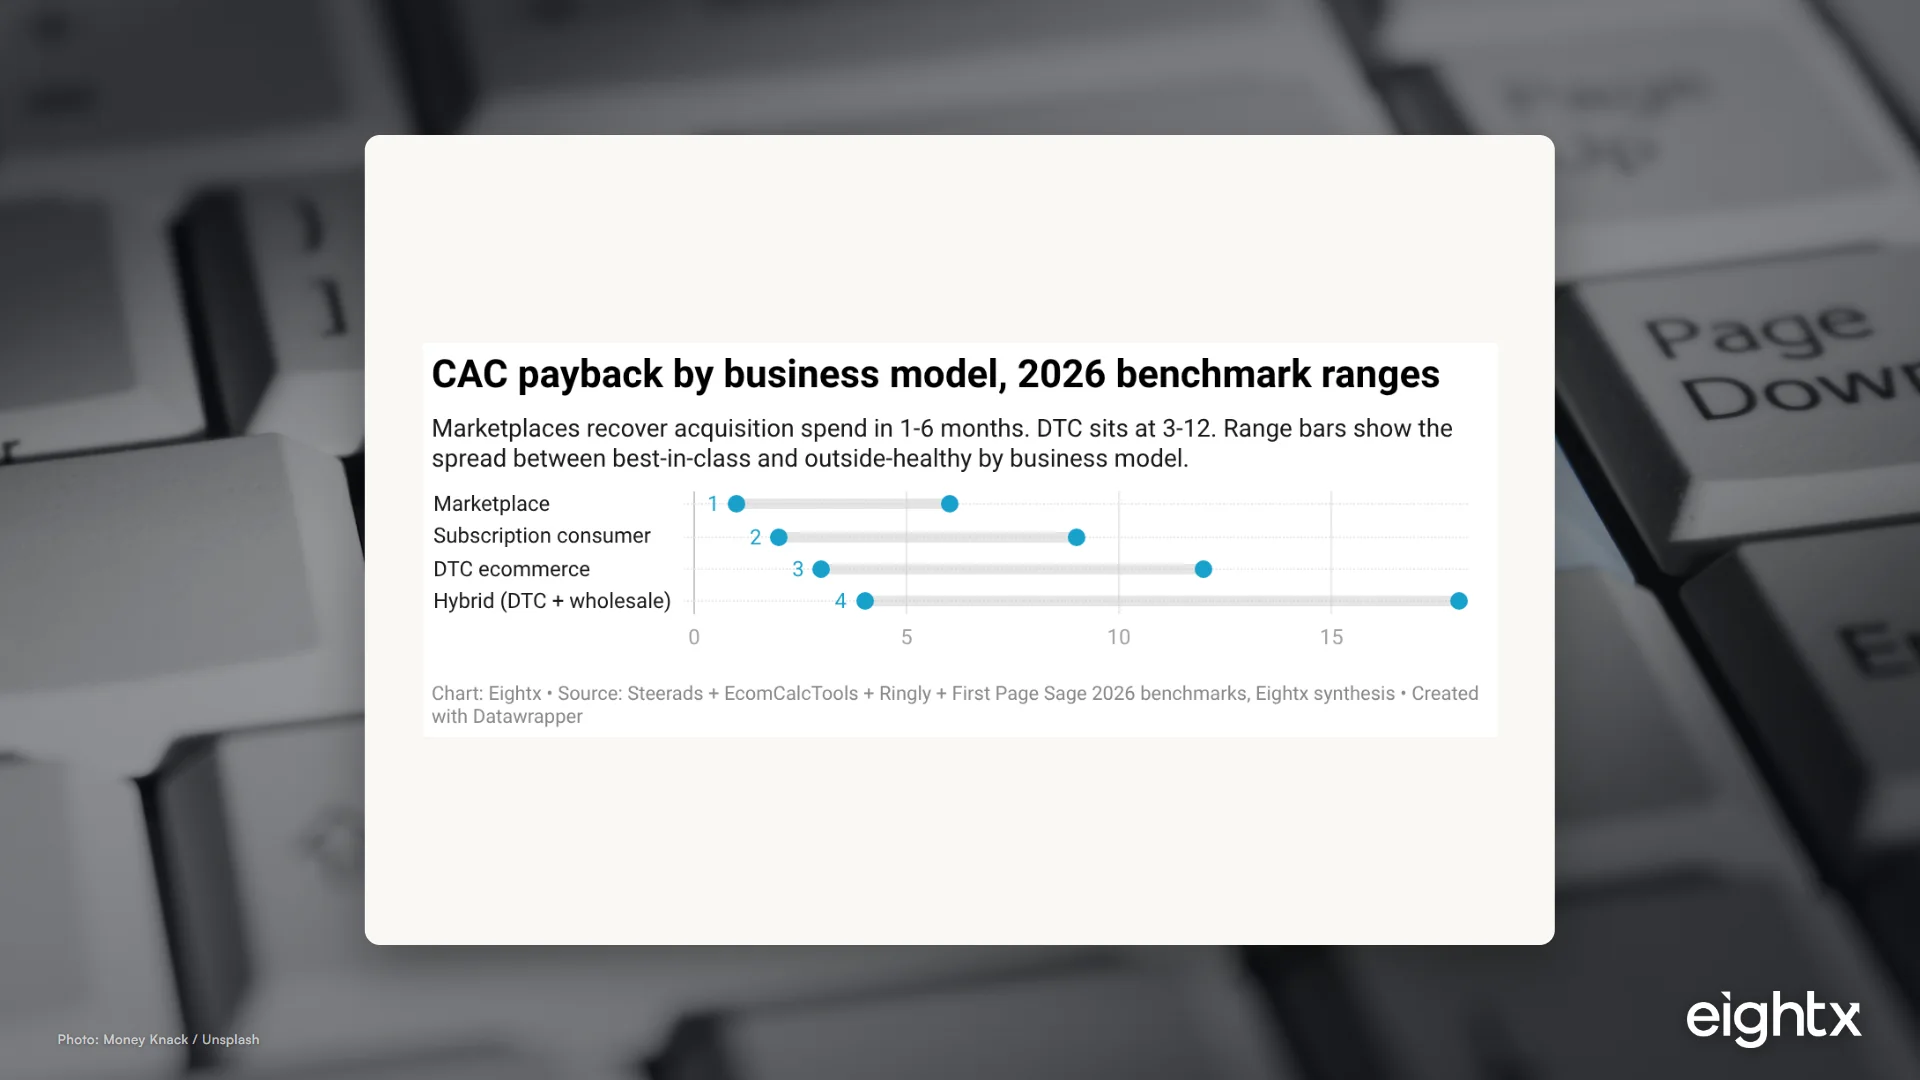
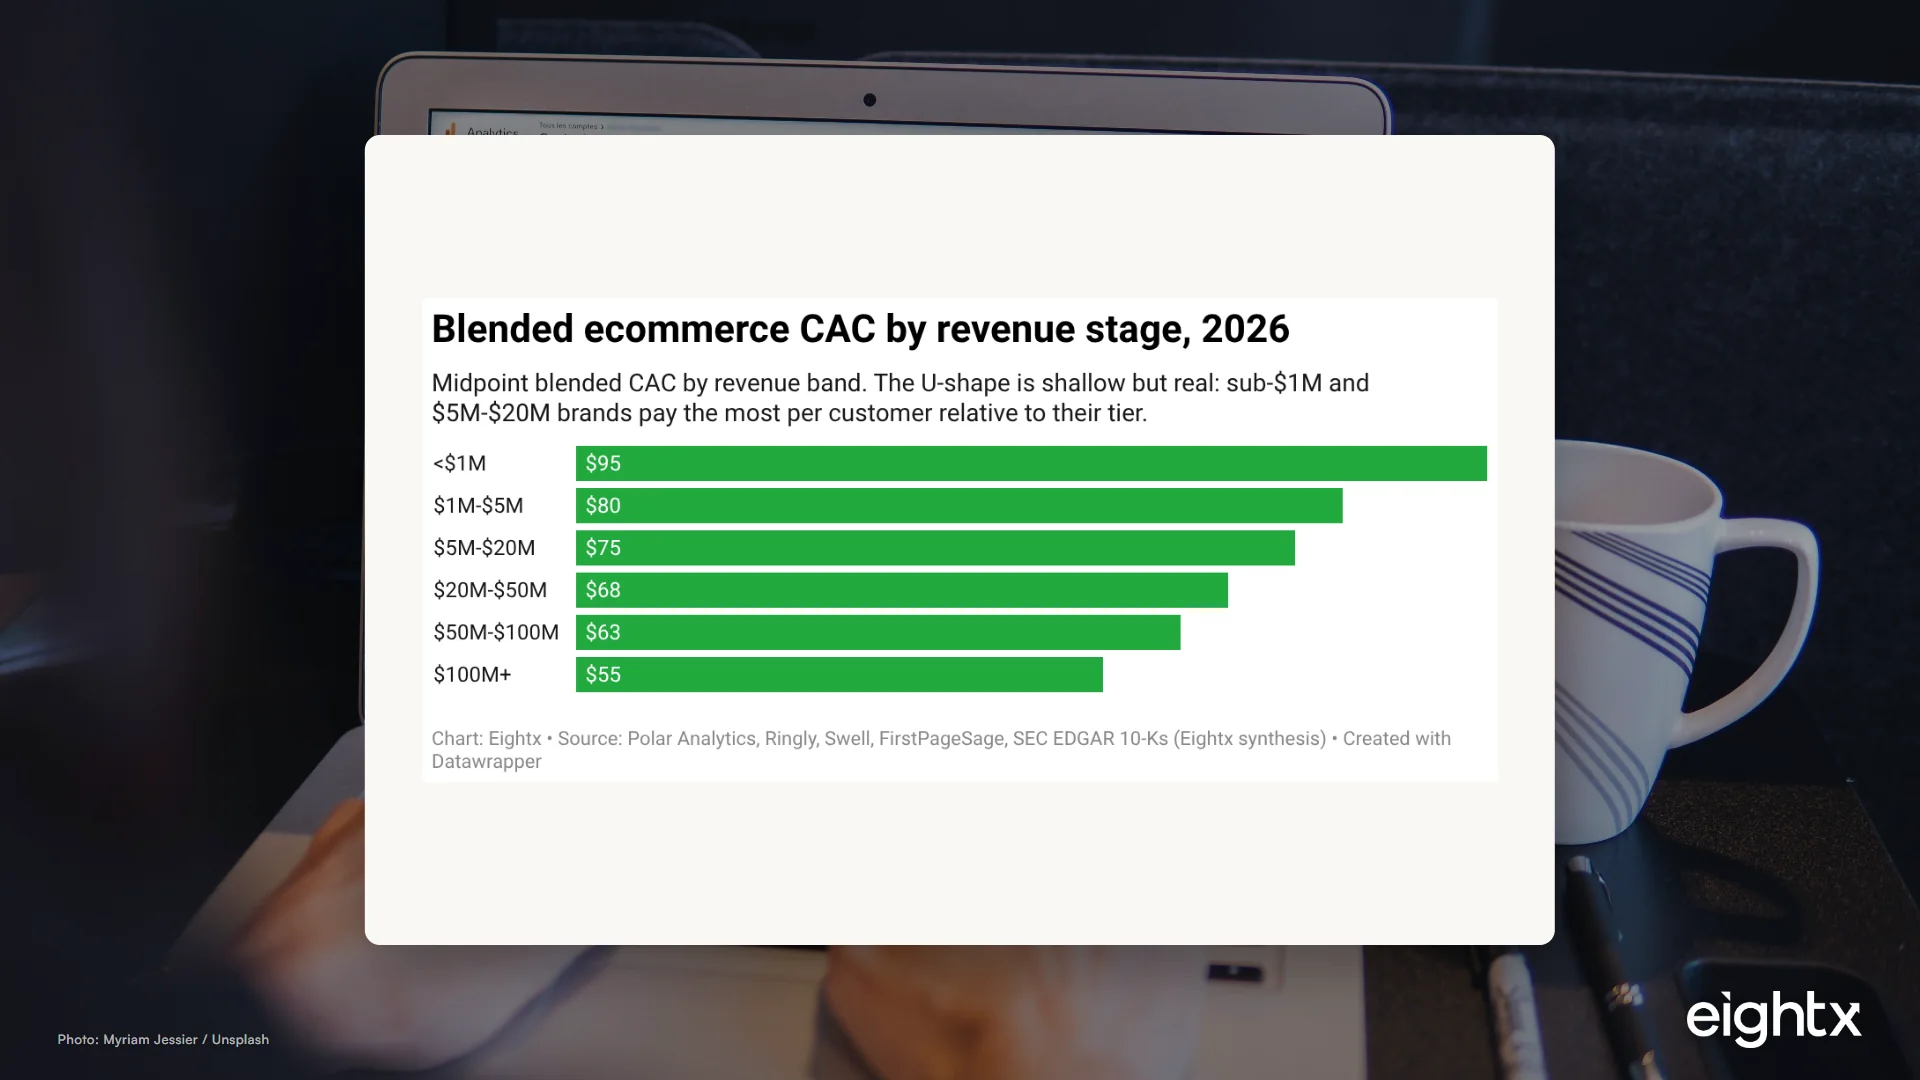
Median DTC CAC payback is 3.4 months, but the $3M-$10M brands we see run 6-10. The benchmark by vertical, why blended CAC rose 25-40%, and the cash-flow math.
Williams-Sonoma runs 18% operating margins on zero debt and ~$600M in gift card and deferred revenue. A teardown of how WSM funds itself from SEC filings.
VF Corp's operating margin fell from 13.8% to a loss in two years as Vans stalled and SG&A stayed flat. What it means if one product line carries your revenue.
Sonos revenue fell 16% and operating income swung $205M negative after the 2024 app launch. A financial teardown of what a software failure does to a hardware P&L.
SharkNinja grew from $4.3B to $6.4B while gross margin hit 49%. A teardown of the launch machine, the R&D bill, and the $1B inventory position underneath it.
Garmin grew revenue 45% to $7.2B in four years while holding a 57-59% gross margin and carrying zero long-term debt. The financial teardown, and what DTC operators can copy.
Bath & Body Works runs a 43-44% gross margin and 39M loyalty members, but $3.6B of spin-off debt turns a 15.4% operating margin into an 8.9% net margin. The full teardown.
How Abercrombie & Fitch (ANF) went from a 2.5% operating margin in FY2022 to 15.0% in FY2024 by selling at full price, and what the sequence teaches DTC operators.
National Beverage spends just 3.9% of revenue on marketing and runs SG&A at 17.5%, half its peers, yet prints 19.5% operating margins. LaCroix model teardown.
Vita Coco (COCO) owns zero factories, carries zero debt, and rebuilt gross margin from 24.2% to 38.5%. A financial teardown of the asset-light co-packer model.
Coach ran ~33% GAAP segment margin and generated 80% of Tapestry's $7.0B FY2025 revenue while an $854.8M Kate Spade impairment collapsed GAAP earnings.
Peloton's blended gross margin fell from 36% to 19.5% then recovered to 50.9%. The teardown of hardware vs subscription economics for connected-product brands.
Ralph Lauren grew gross margin from 64.7% to 69.9% in four years by refusing to discount. The SEC-filing teardown of the AUR playbook, and what it means for your DTC brand.
Hasbro's Wizards of the Coast runs near 46% operating margin while Consumer Products sits near 5%. The IP-vs-execution margin gap, the eOne write-off, and the operator lesson.
Mattel's gross margin hit a 5-year peak of 50.8% in FY2024 after the Barbie movie rolled off, then slipped to 48.7% in FY2025. A teardown from SEC filings.
Build-A-Bear posted five straight record years and a 55.8% gross margin with zero long-term debt. We tear down the FY2021-FY2025 SEC filings for DTC operators.
Cost-plus pricing quietly leaves $5-$20 of margin per unit on the table. The three-question value-anchor test finds it, and the A/B design that confirms it.
Before you offer subscribe-and-save, build the number that decides it: monthly contribution per active subscriber, times lifetime at 5, 10, and 15% churn.
A 15% return rate is not a 15% problem. The per-SKU return-cost formula, a worked $60 example, and how to rank SKUs by return-adjusted contribution.
The break-even volume loss on a $10 price increase is a formula, not a guess: on a $22 contribution margin you can lose 31% of units and still hold contribution dollars flat.
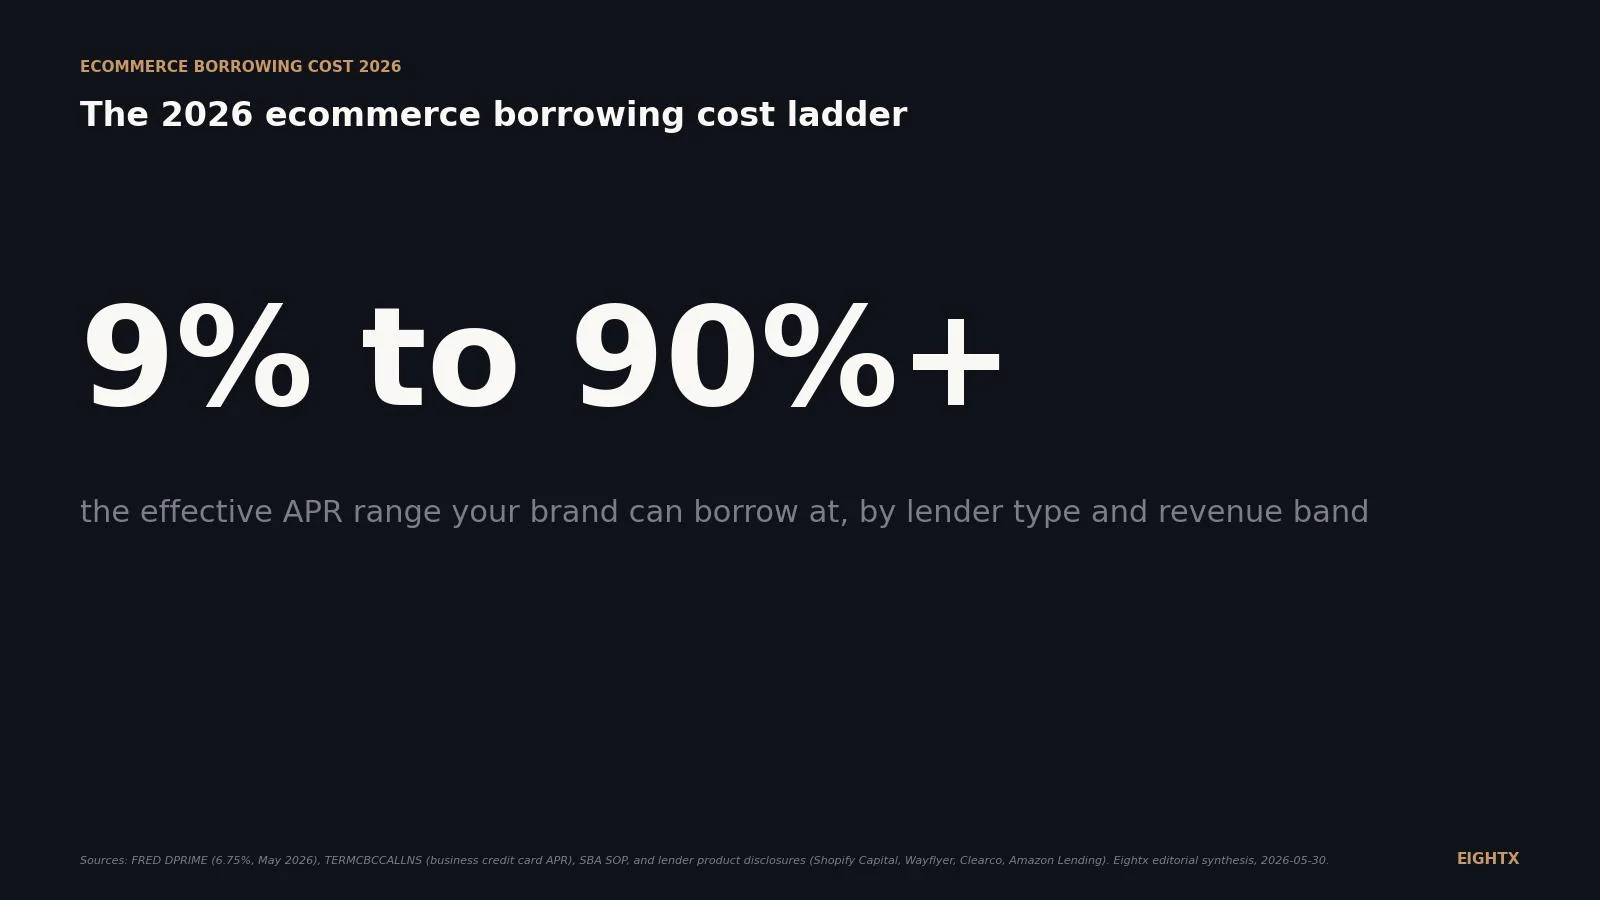
A 1.35 factor rate on a 6-month MCA is a 70% effective APR, not 35%. The breakeven-margin math, the ROAS you need to justify it, and when the advance is a trap.
The per-order contribution waterfall that shows who really pays for free shipping, how to solve your AOV breakeven, and where to set a conditional free-shipping floor.
Insert a market-rate salary for the job you actually do, then re-run EBITDA. If profit goes negative or under 10%, your brand isn't profitable on its own.
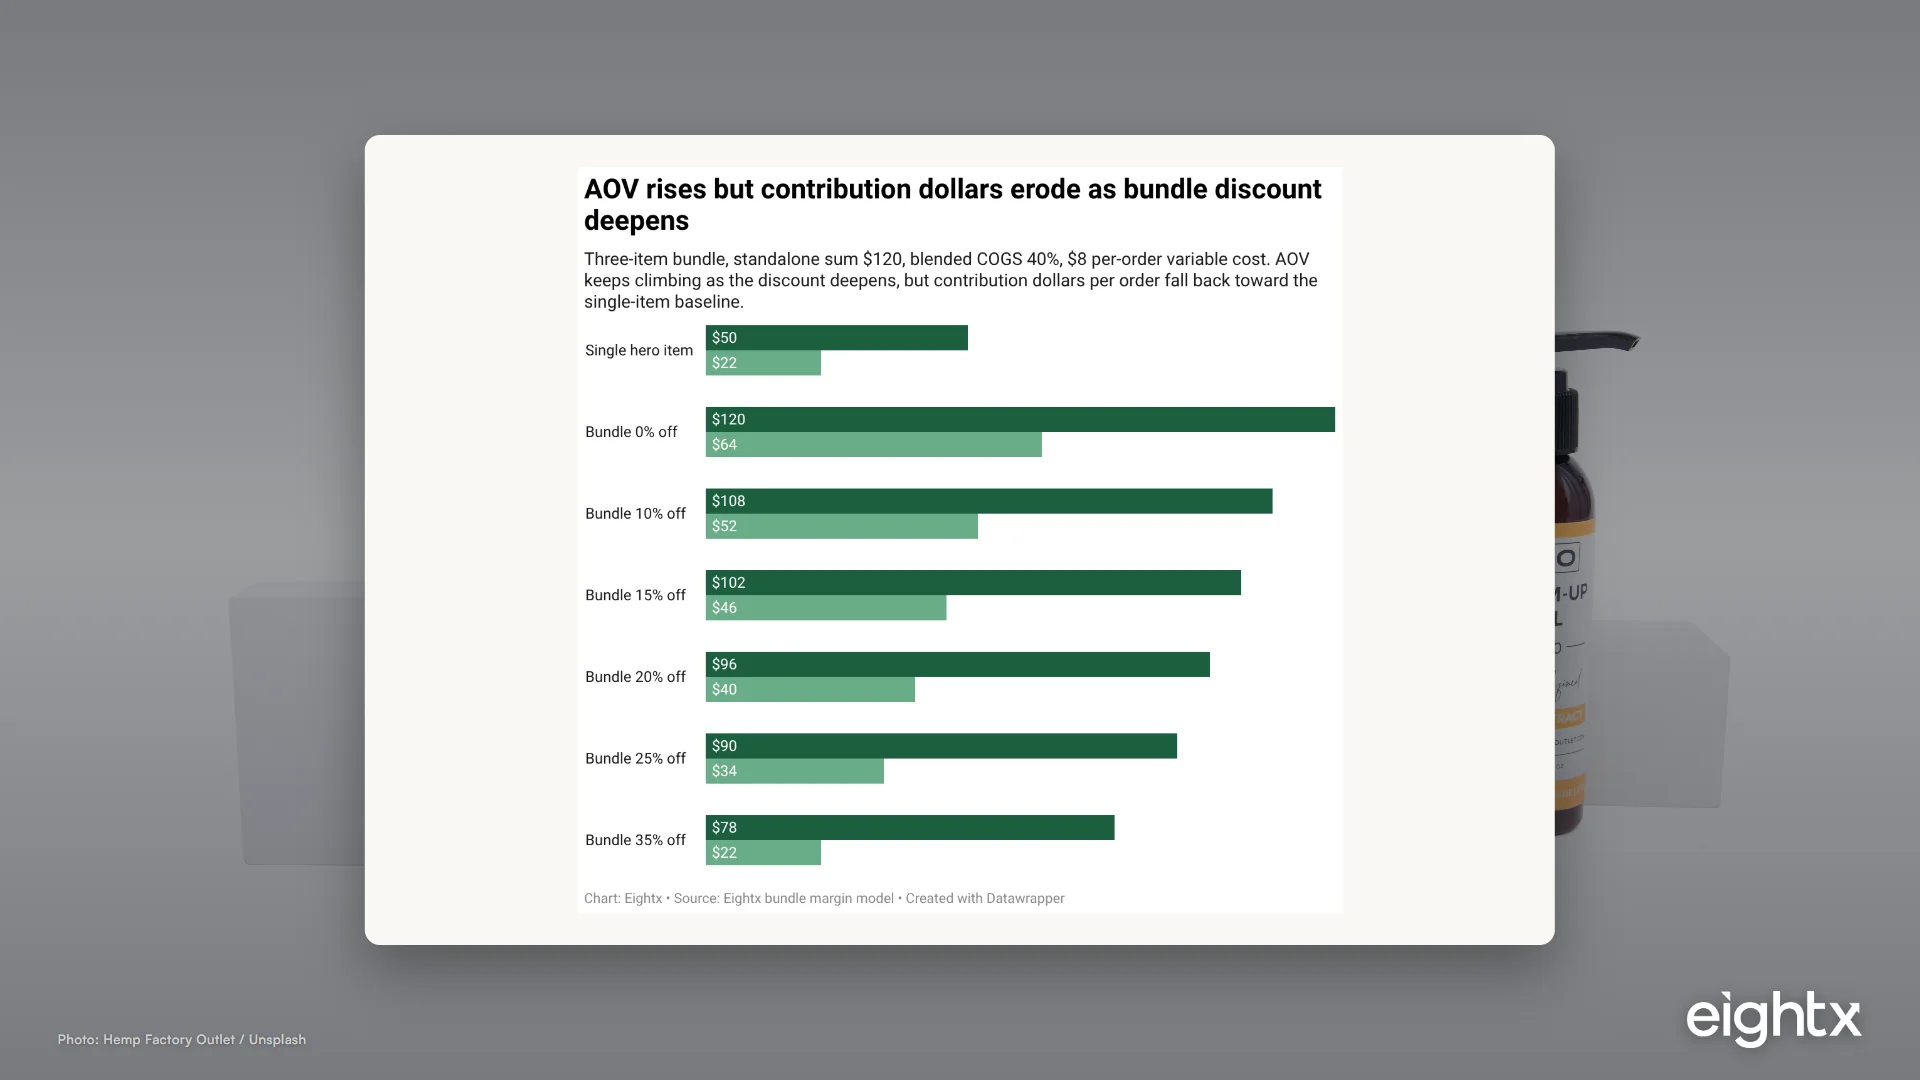
Bundles lift average order value but often cut per-order profit. The contribution-per-order test and the discount-ceiling formula that keep both the AOV lift and the margin.
Breakeven MER is 1 divided by your contribution margin before marketing. Compare it to your blended MER to see whether scaling ad spend adds profit or burns it.
Your annual budget nets timing out, so a profitable month can bounce a payment. Here's the 13-week cash forecast that catches the bad week before it hits.
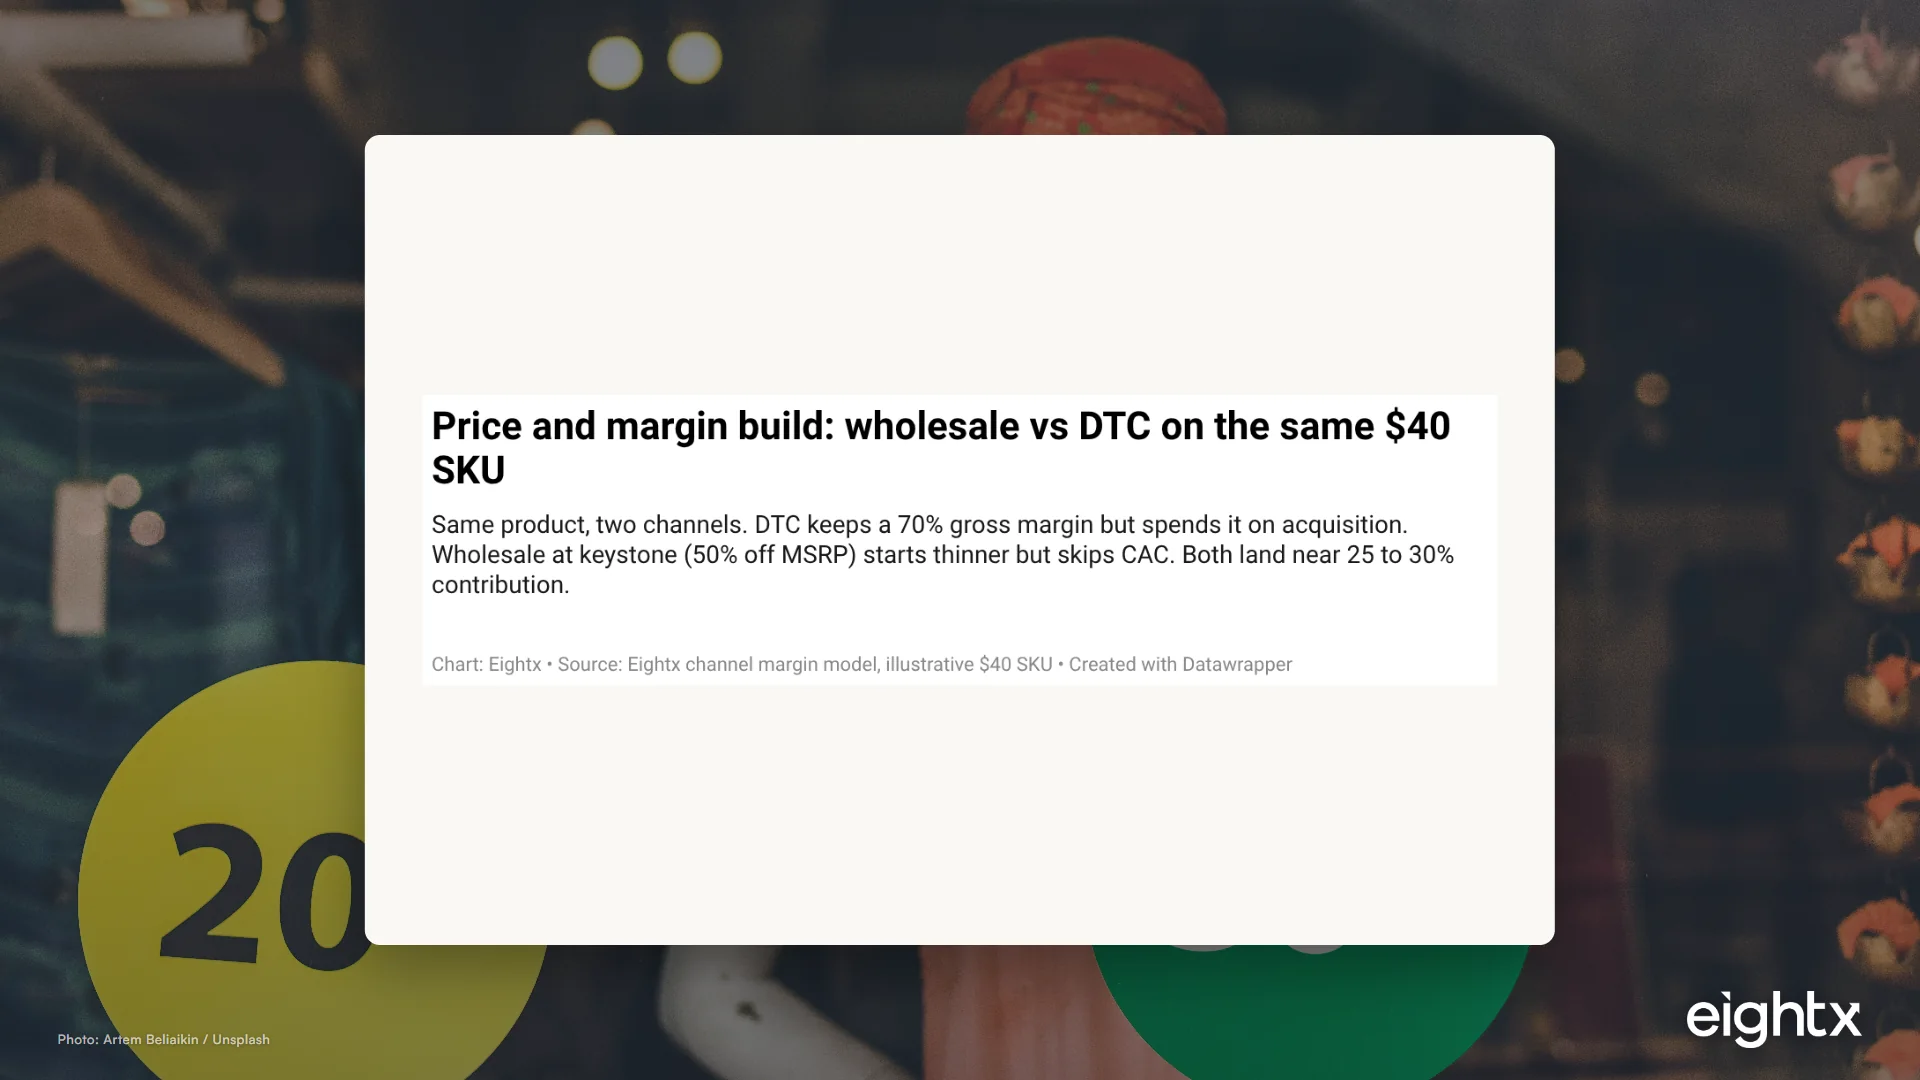
Wholesale gross margin runs 30-40% vs. 50-70% DTC, but wholesale EBIT often wins. The real math on keystone pricing, chargebacks, Faire fees and net terms.
Economic nexus explained for DTC brands: the $100k threshold in most states, the high-threshold exceptions (CA, TX, NY), and the 6 steps to get compliant.
An $8M DTC brand pays $80k-$120k a year on SaaS. That funds a full hire. Here is the crossover rule for when to cancel the subscription and book the salary.
Raise DTC prices 10-20% without tanking volume. The three pre-launch signals, the rollout sequence, the email scripts, and the margin math that makes the case.
A full-time CFO costs $357K-$515K fully loaded at a $20M DTC brand, vs $120K-$180K fractional. The real math, ramp, and 4 inflection points that justify it.
A 12-step month-end close checklist that gets DTC brands to accurate books by day 5. Covers Shopify, Amazon, and Faire payout reconciliation, COGS, and close errors.
How the P&L, balance sheet, and cash flow statement tie together for a DTC brand, the driver assumptions that move them, and the benchmark ranges to build against.
The pricing system for DTC operators: the cost-plus floor, the value-based ceiling, and the per-order margin model that stress-tests every price before launch.
Most DTC brands run 30-40% forecast error and pay for it in stockouts and dead stock. Here is the SKU-level system that halves that error and frees up cash.
Why your bank balance lies about DTC profit, when the IRS forces you onto accrual (the ~$32M line), and how Form 3115 and the Section 481(a) adjustment work.
Glew, Triple Whale, Looker Studio, or a Fivetran build: the fully-loaded 24-month cost of each BI path for a $6M DTC brand, software plus the engineer labor.
Core Canadian retail rose just 0.5% in June (RBC tracker). Discretionary goods led, big-ticket stayed soft. The read for DTC brands with Canada exposure.
81% of businesses have an AI strategy but only 12-16% reach execution. Here is what closes the pilot-to-production gap for ecom operators spending on AI tools.
Cotopaxi added Nordstrom and Bloomingdale's marketplaces at 100% full price via Mirakl. Before you copy the move, model what 'incremental' actually costs.
Deloitte's 2026 back-to-school survey: $557 per child, down 6% real, and 71% will switch brands on price. The operator read for DTC brands.
Lower-income wages hit 4.1% YoY in June, up from 2.9% in May. Spending gap is the smallest in three years. The operator read for DTC brands.
51% of CEOs say they'd lose operations within 3 weeks of a major supply chain shock. Here's the test to run on your own supplier concentration and cash buffer.
At $7M revenue, most DTC brands still use their $1M CPA. A specialist charging $10K to $20K routinely surfaces $20K to $50K in R&D credits, UNICAP, and nexus savings.
What 1,000 orders a month actually costs at ShipBob, ShipMonk, and a Midwest regional 3PL once you stack storage, receiving, shipping markup, and DIM weight.
The fully-burdened cost of outsourced vs. in-house bookkeeping at $5M, $10M, and $20M DTC revenue. Real salary data, real firm pricing, and the crossover most founders miss.
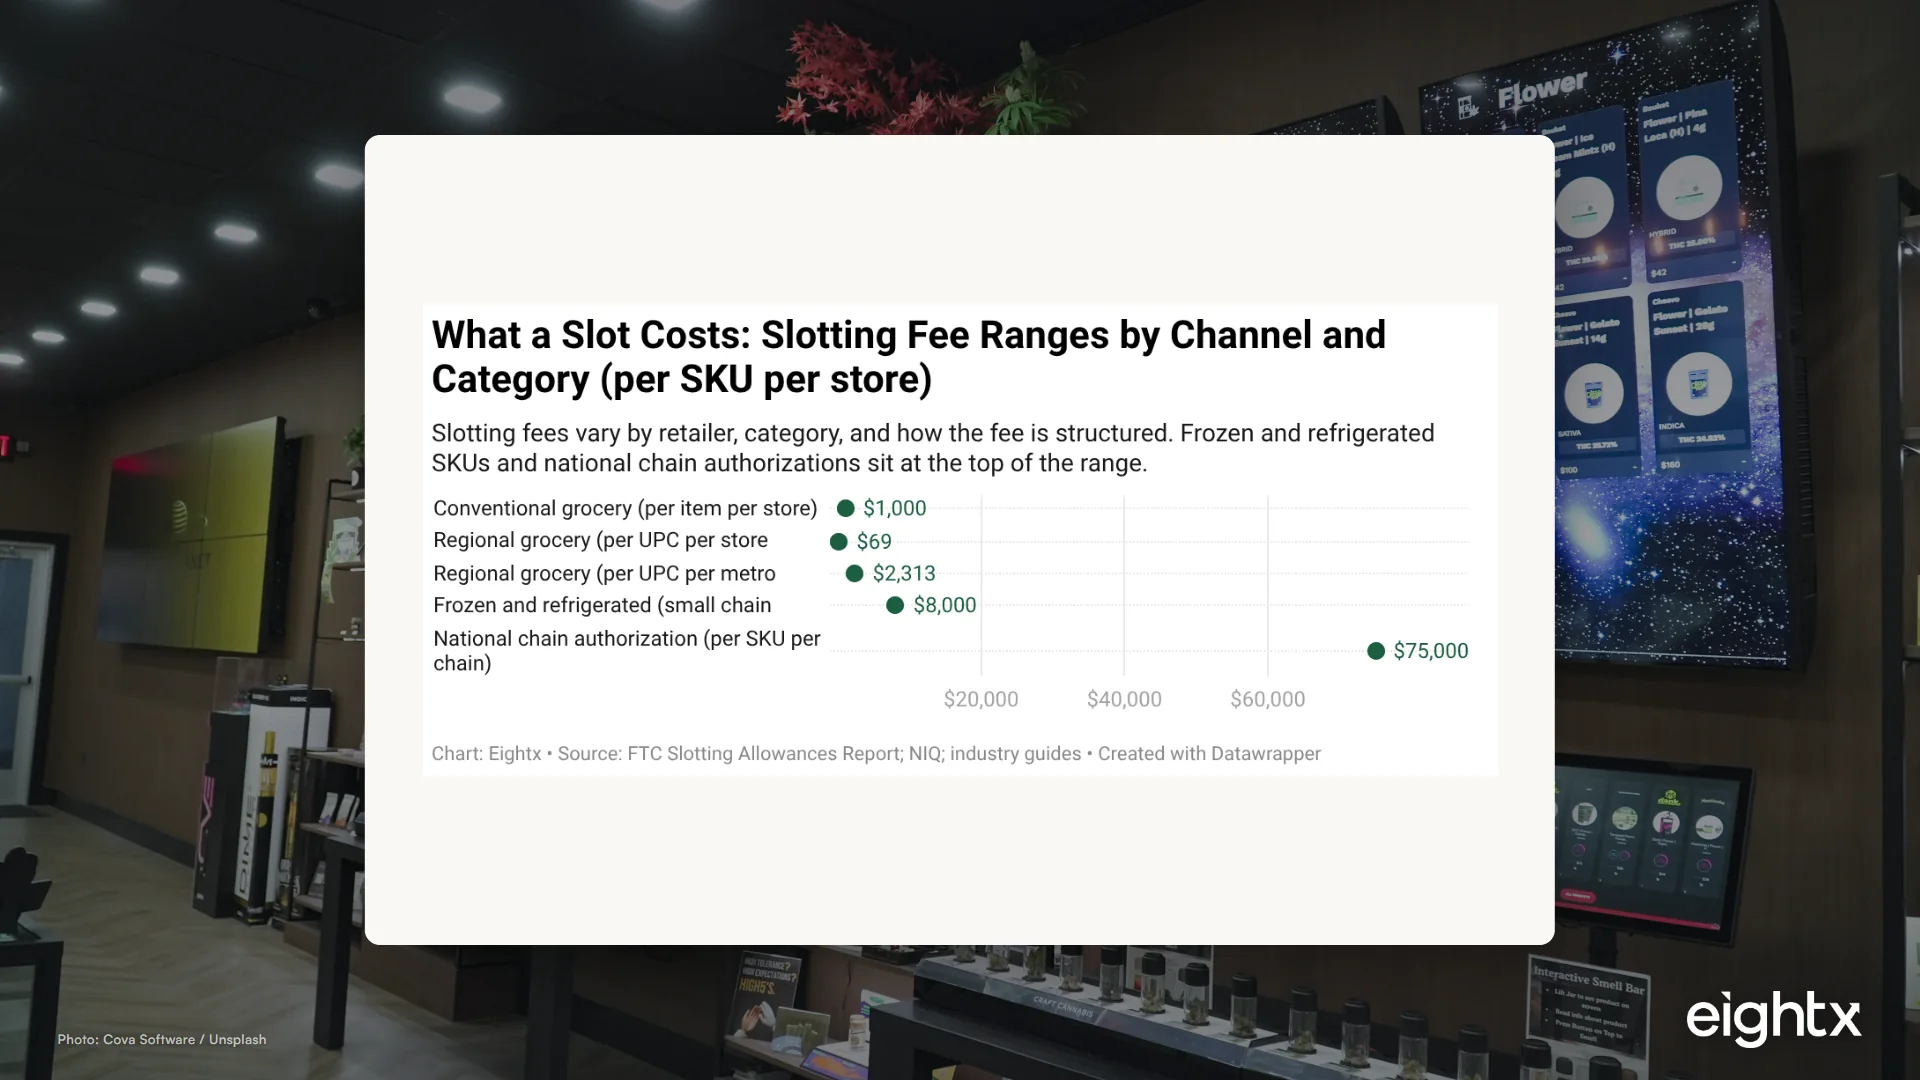
Slotting, free fill, trade spend, and chargebacks push a DTC brand's first retail placement contribution-negative before the second reorder. The margin math.
Amazon can look like 70% gross margin and be 12% CM2 after fees and TACOS. Build a channel-level contribution margin P&L and find which channel actually makes money.
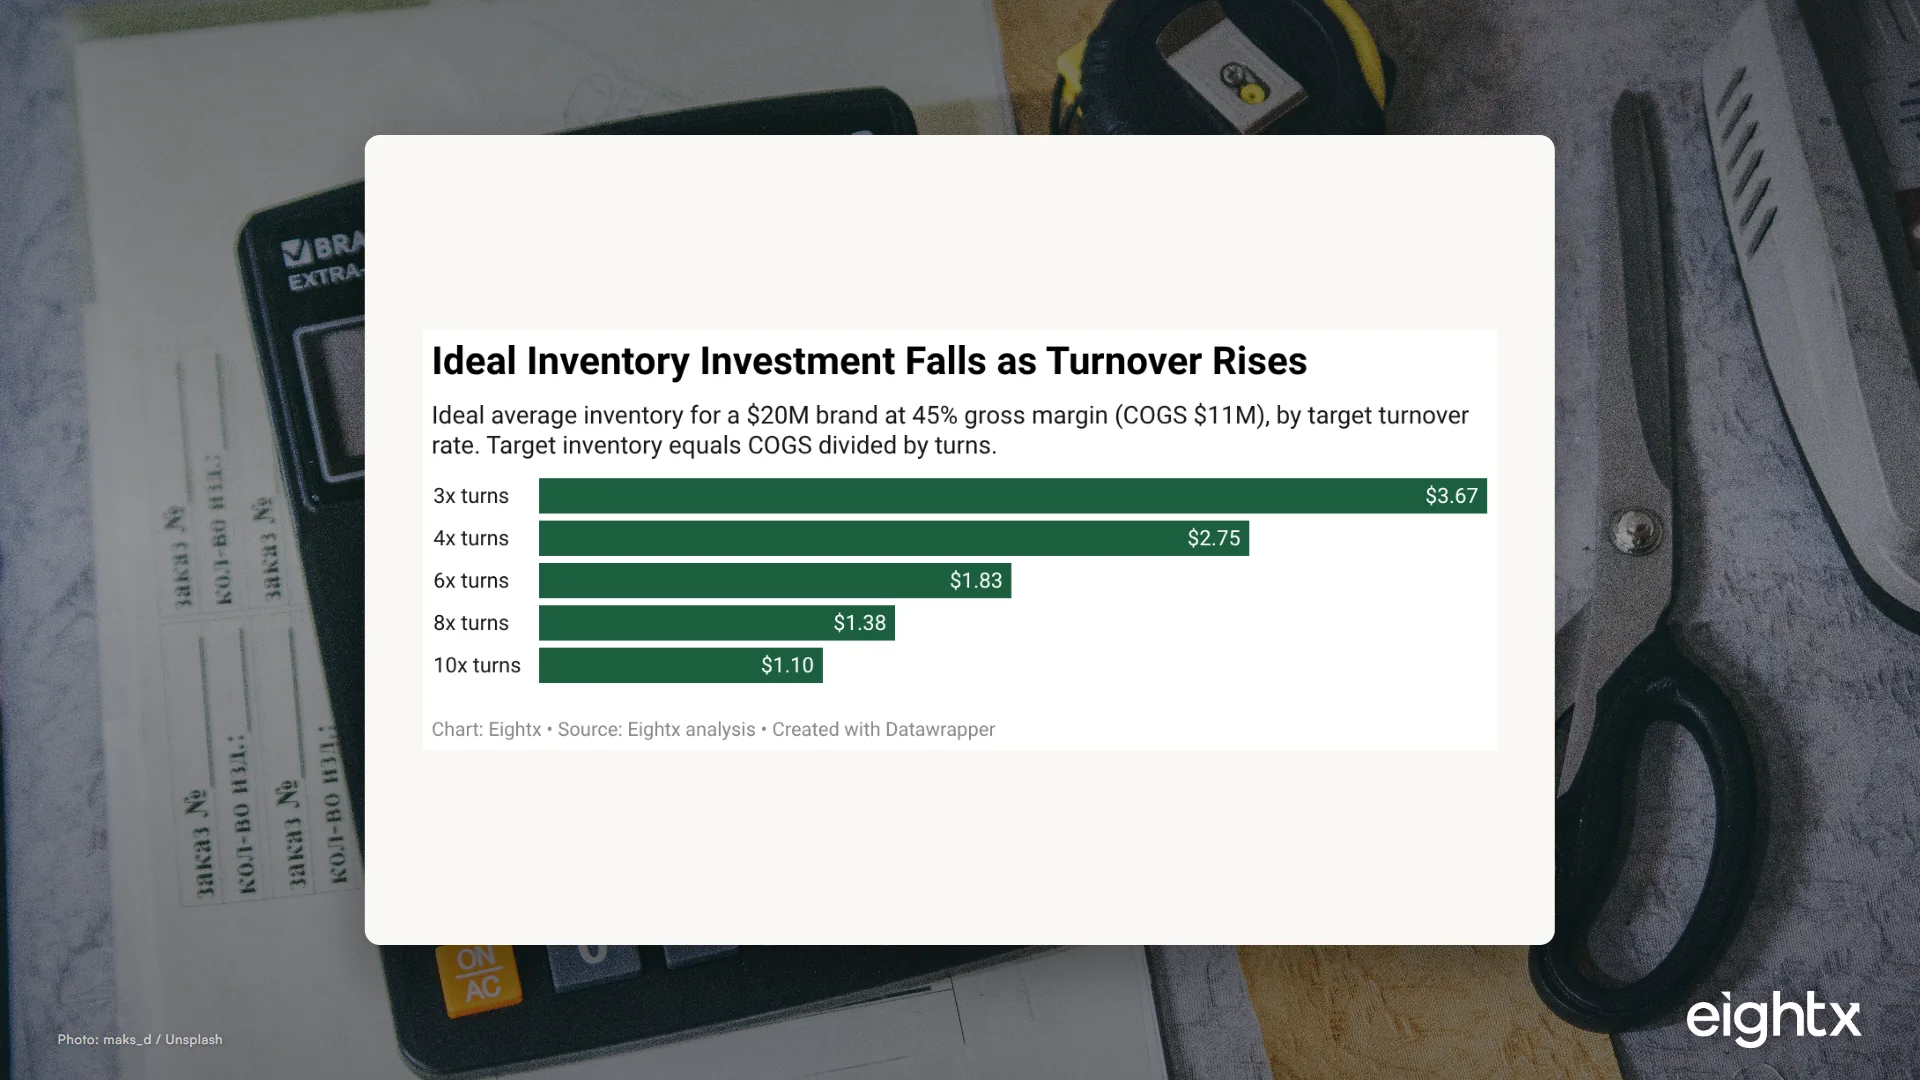
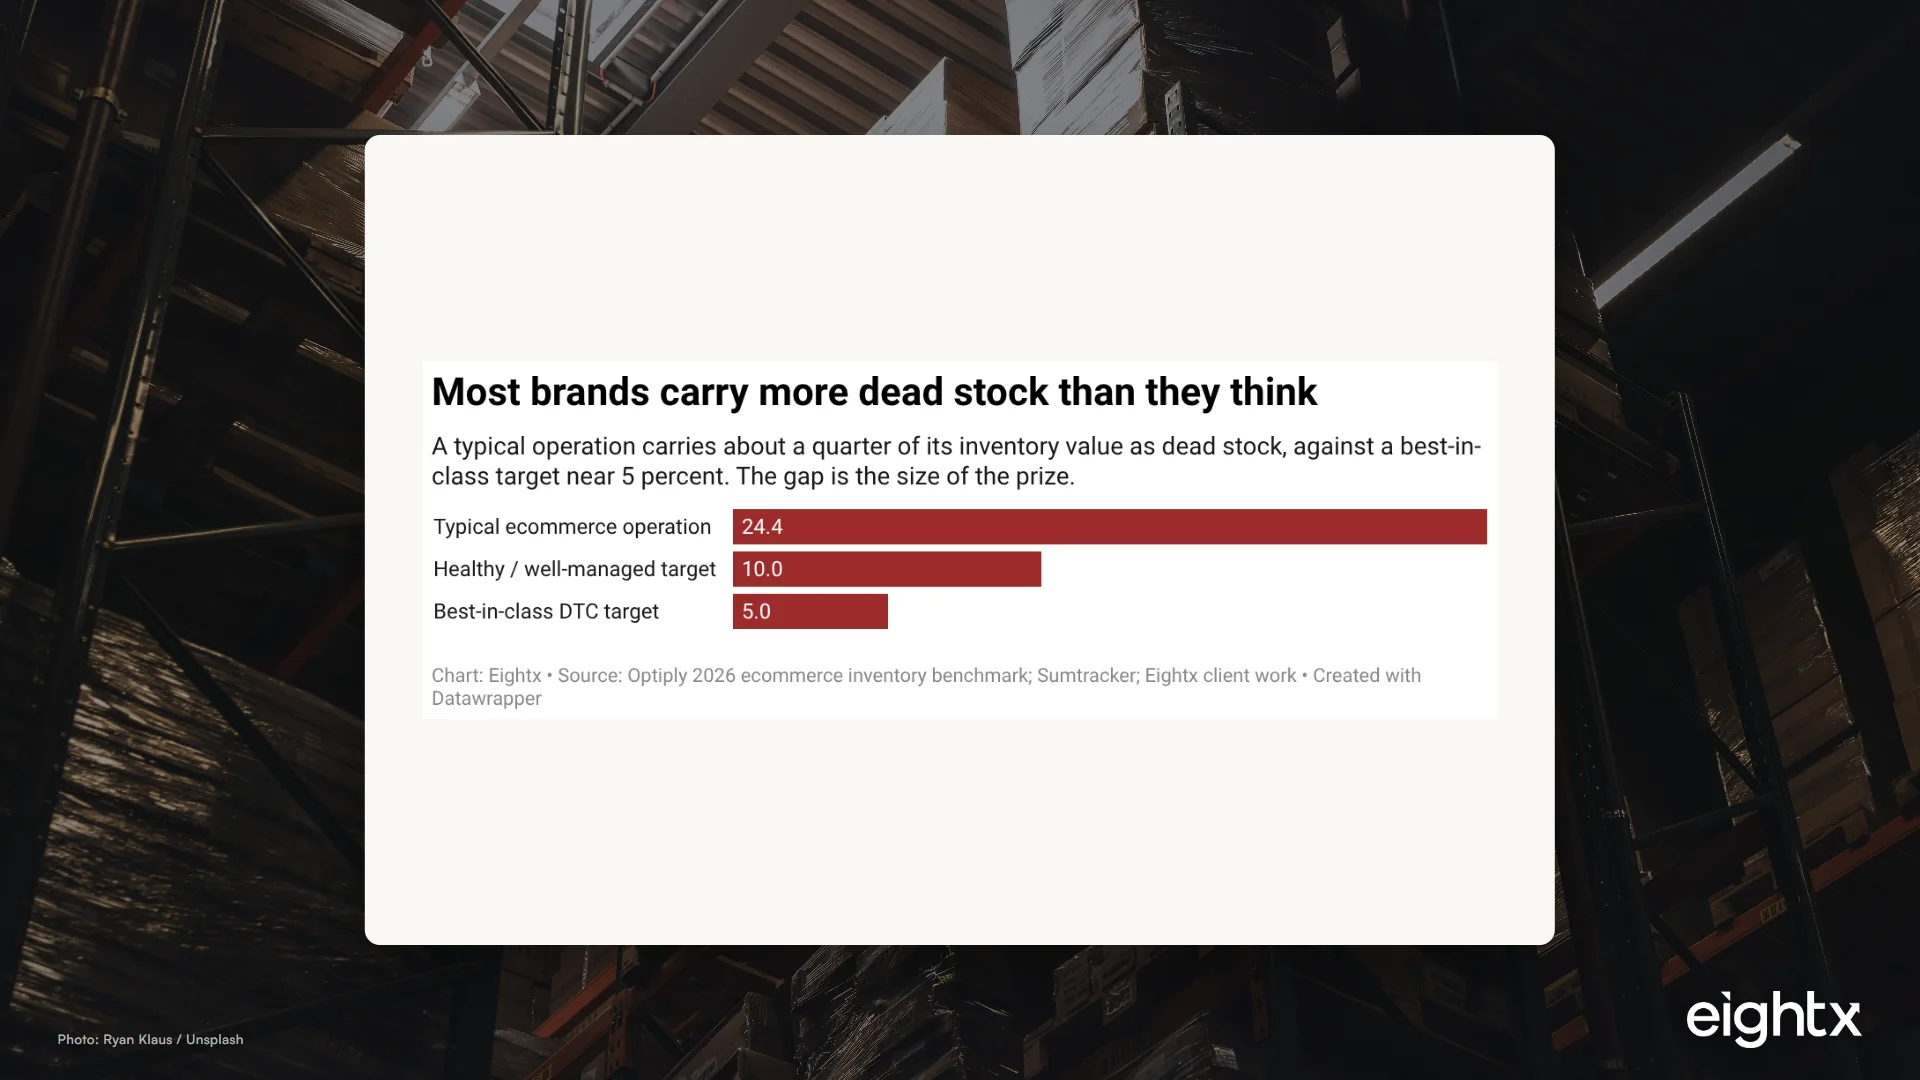
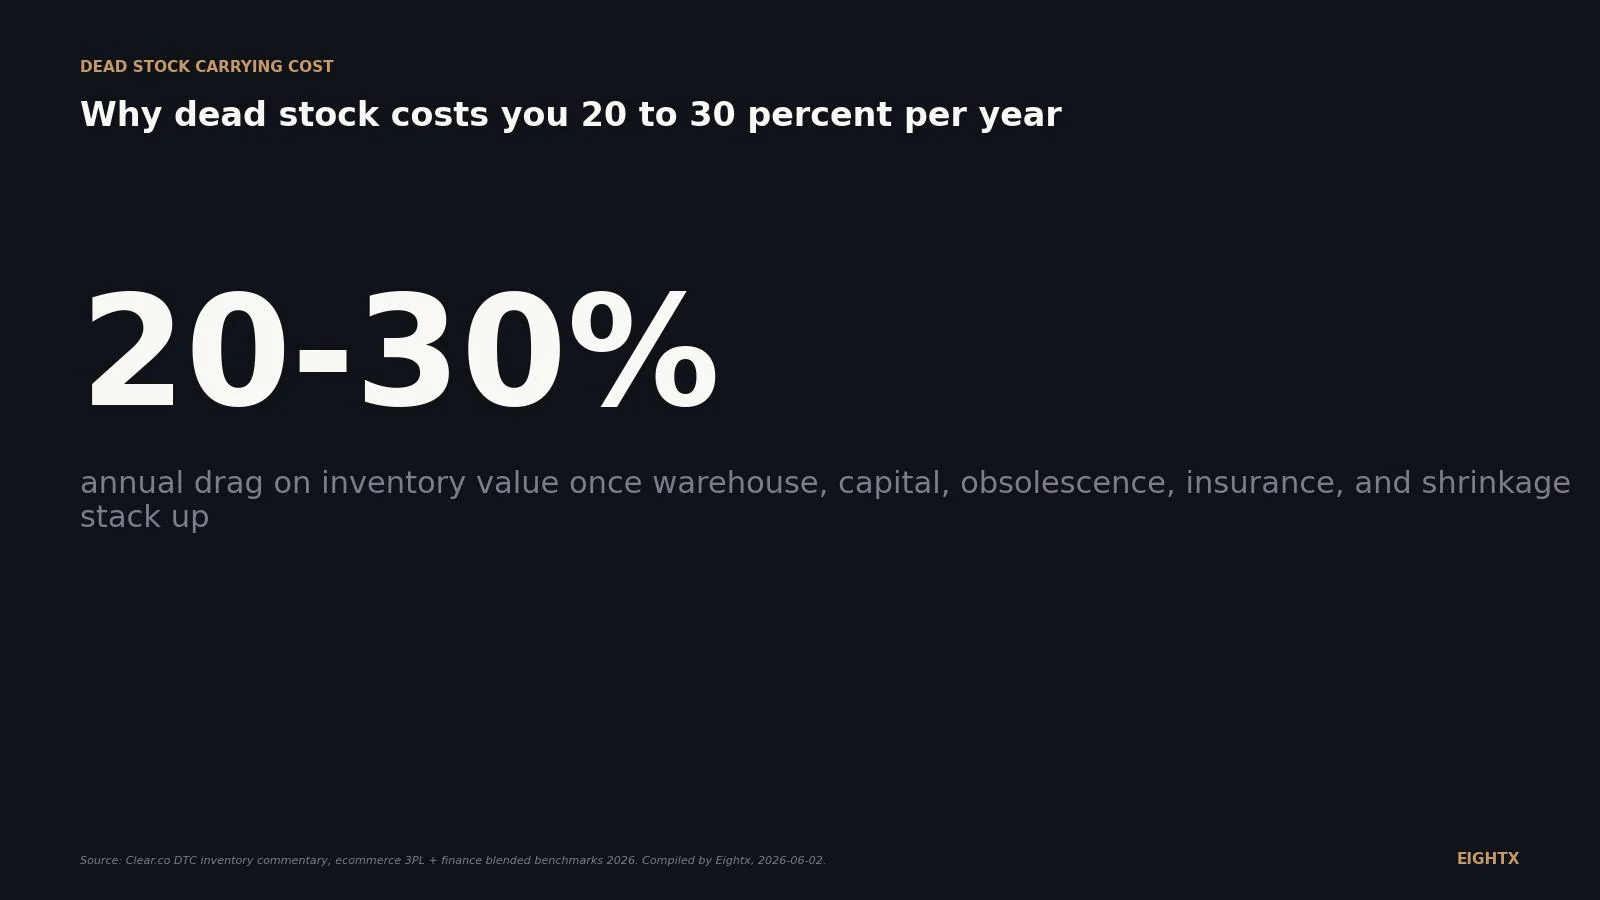
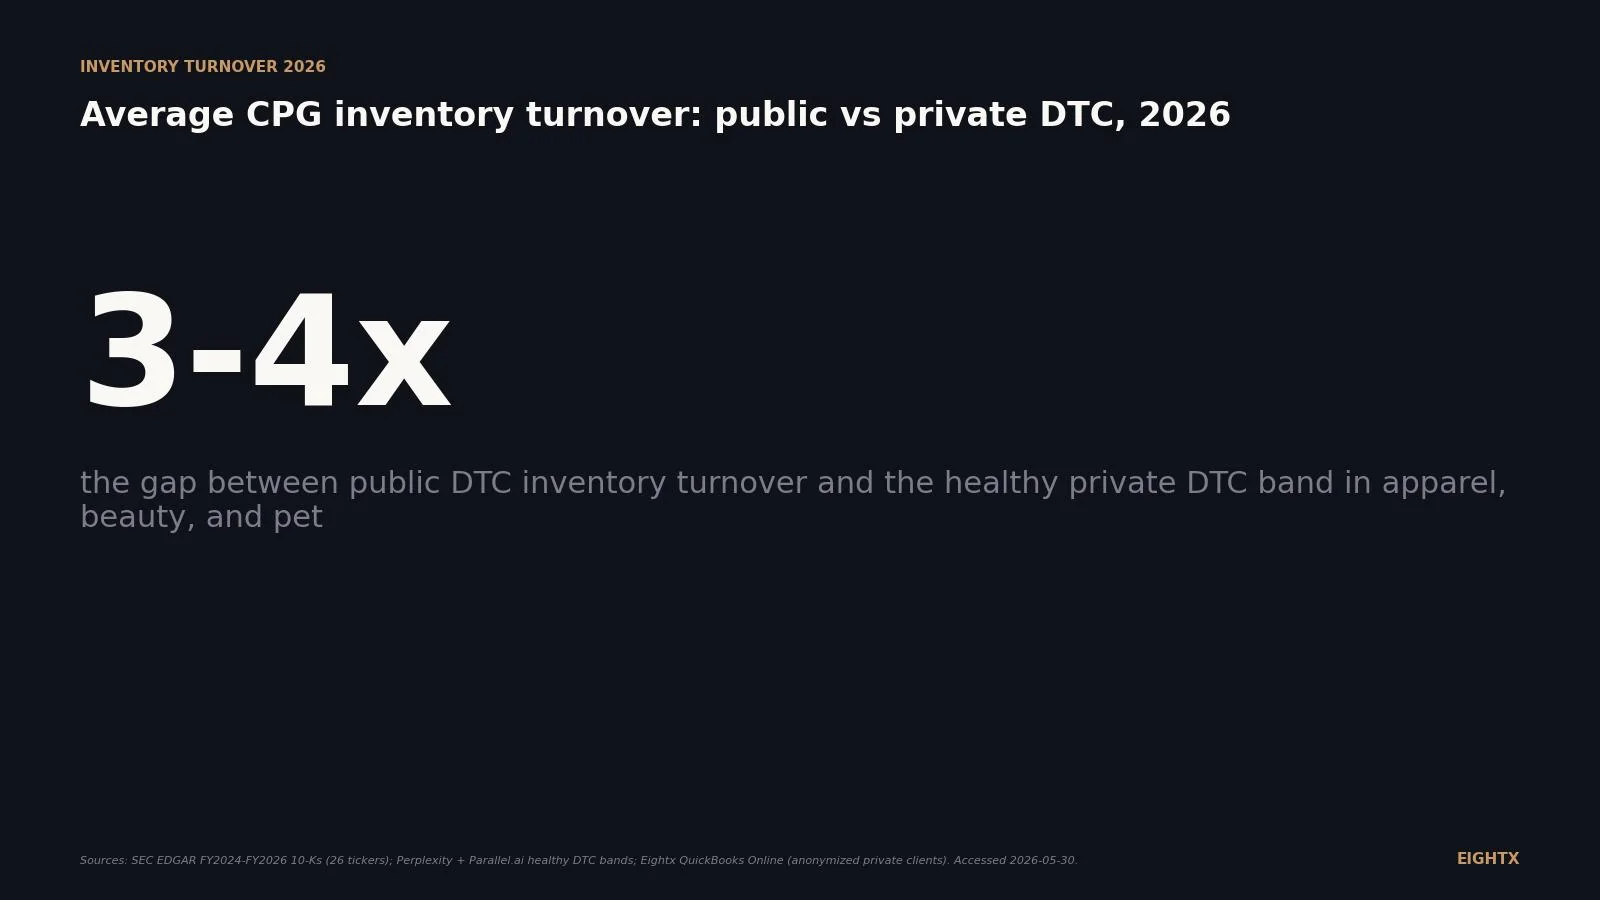
Inventory turns benchmarks by DTC vertical, what dead stock costs at 20-30% a year, and the markdown waterfall that frees trapped cash. Built from SEC EDGAR and Census data.
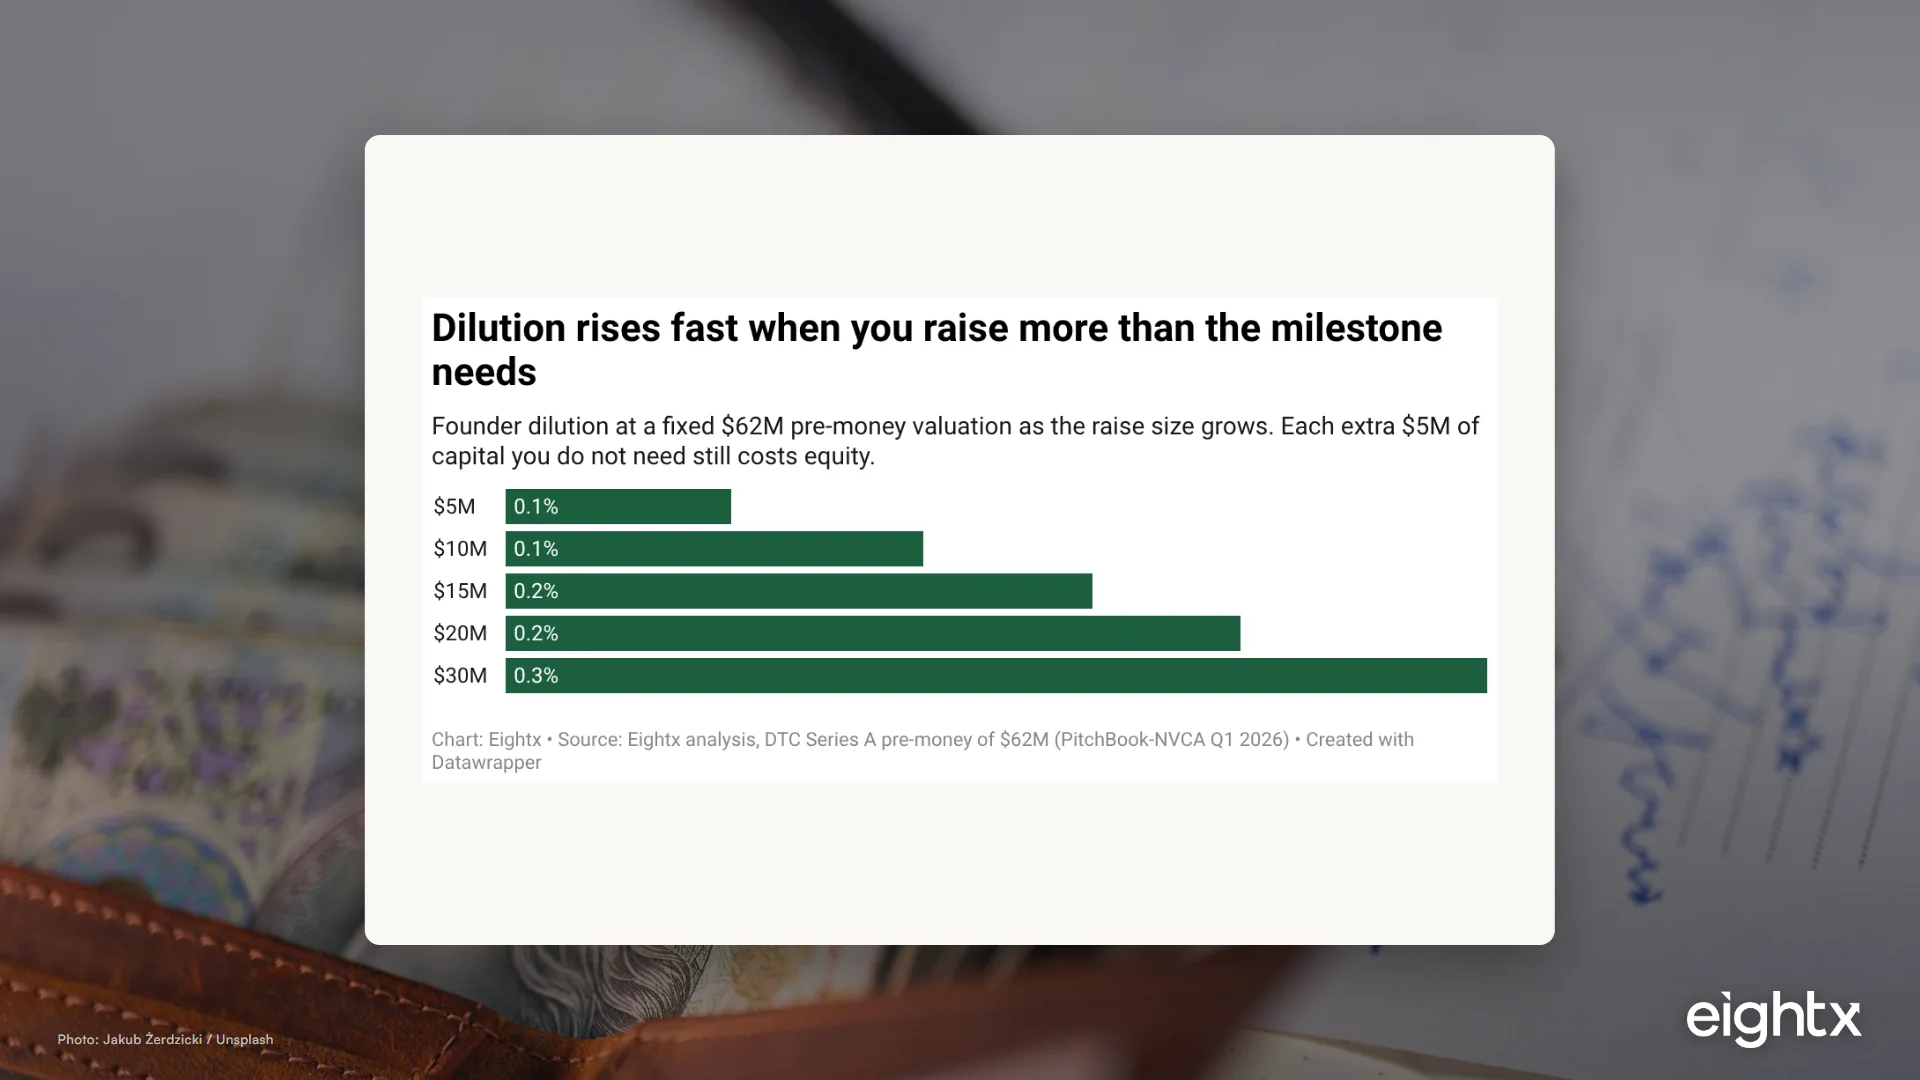
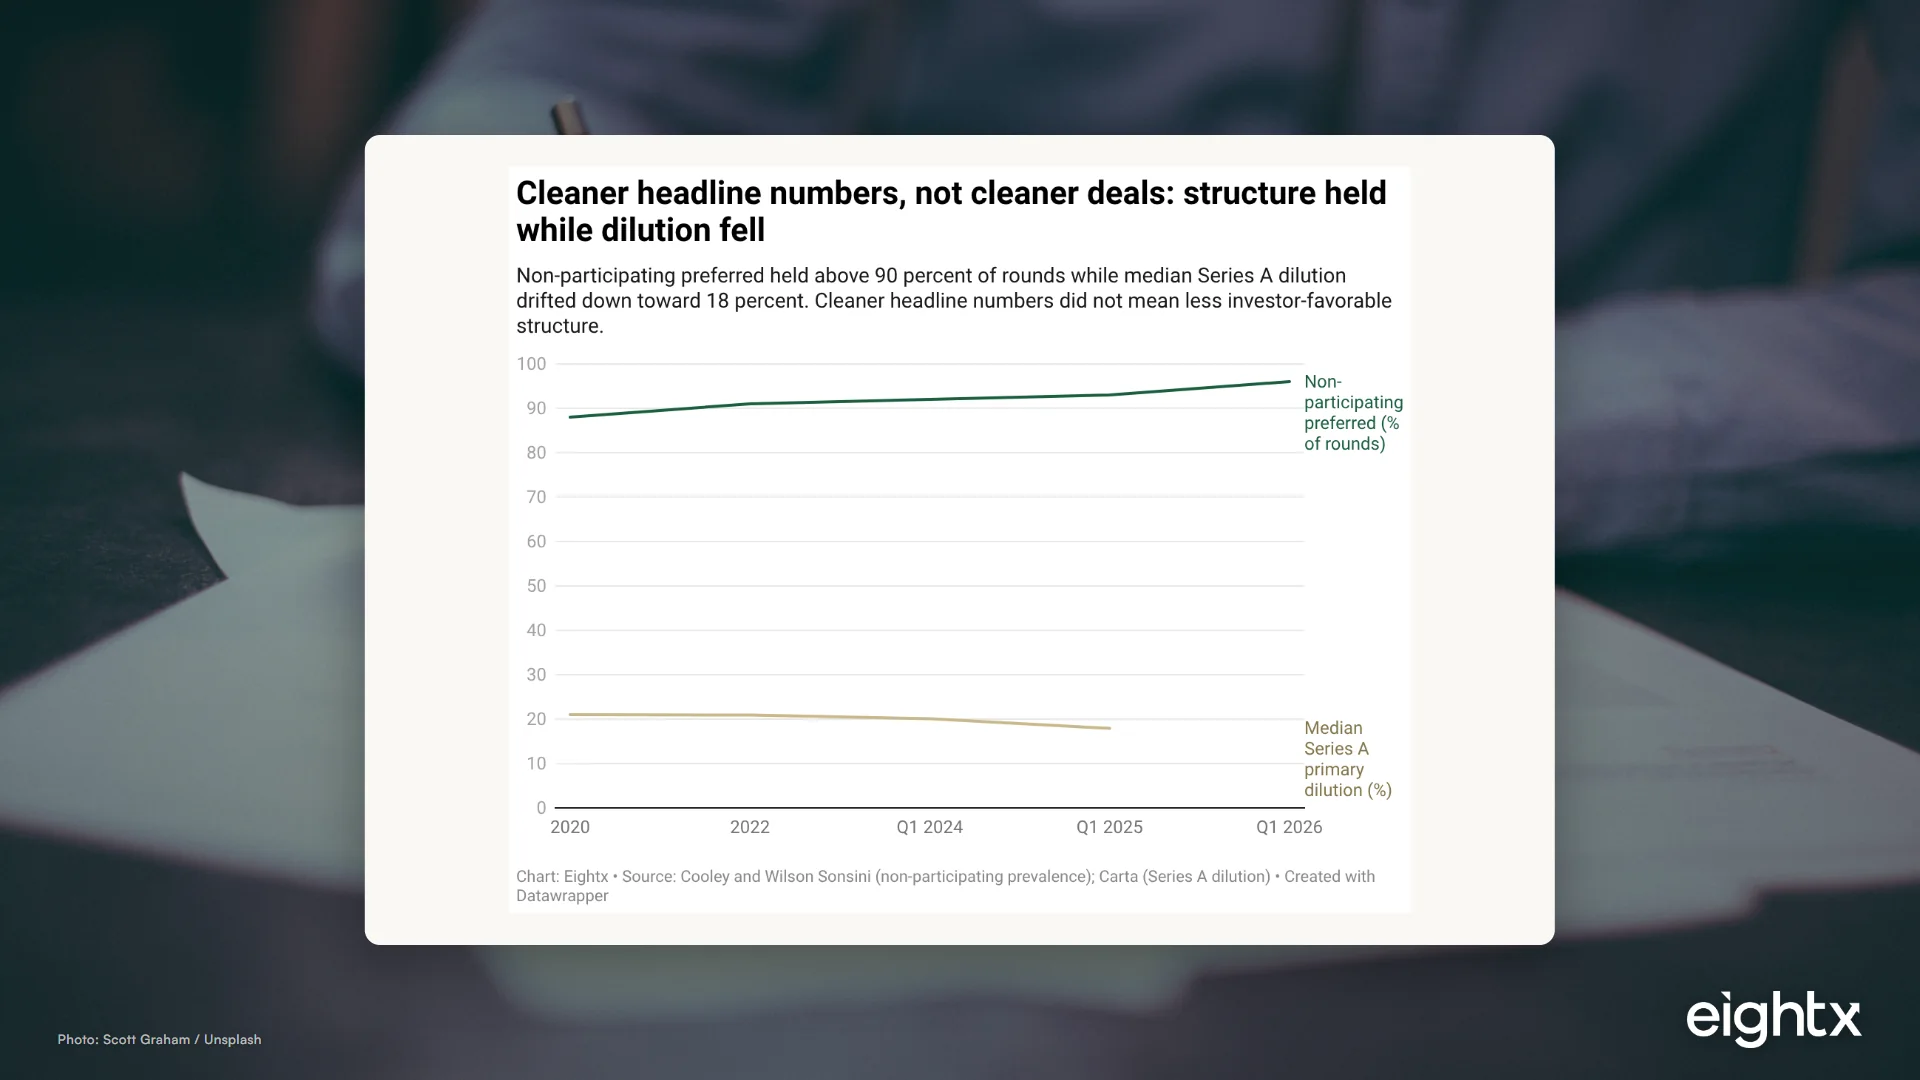
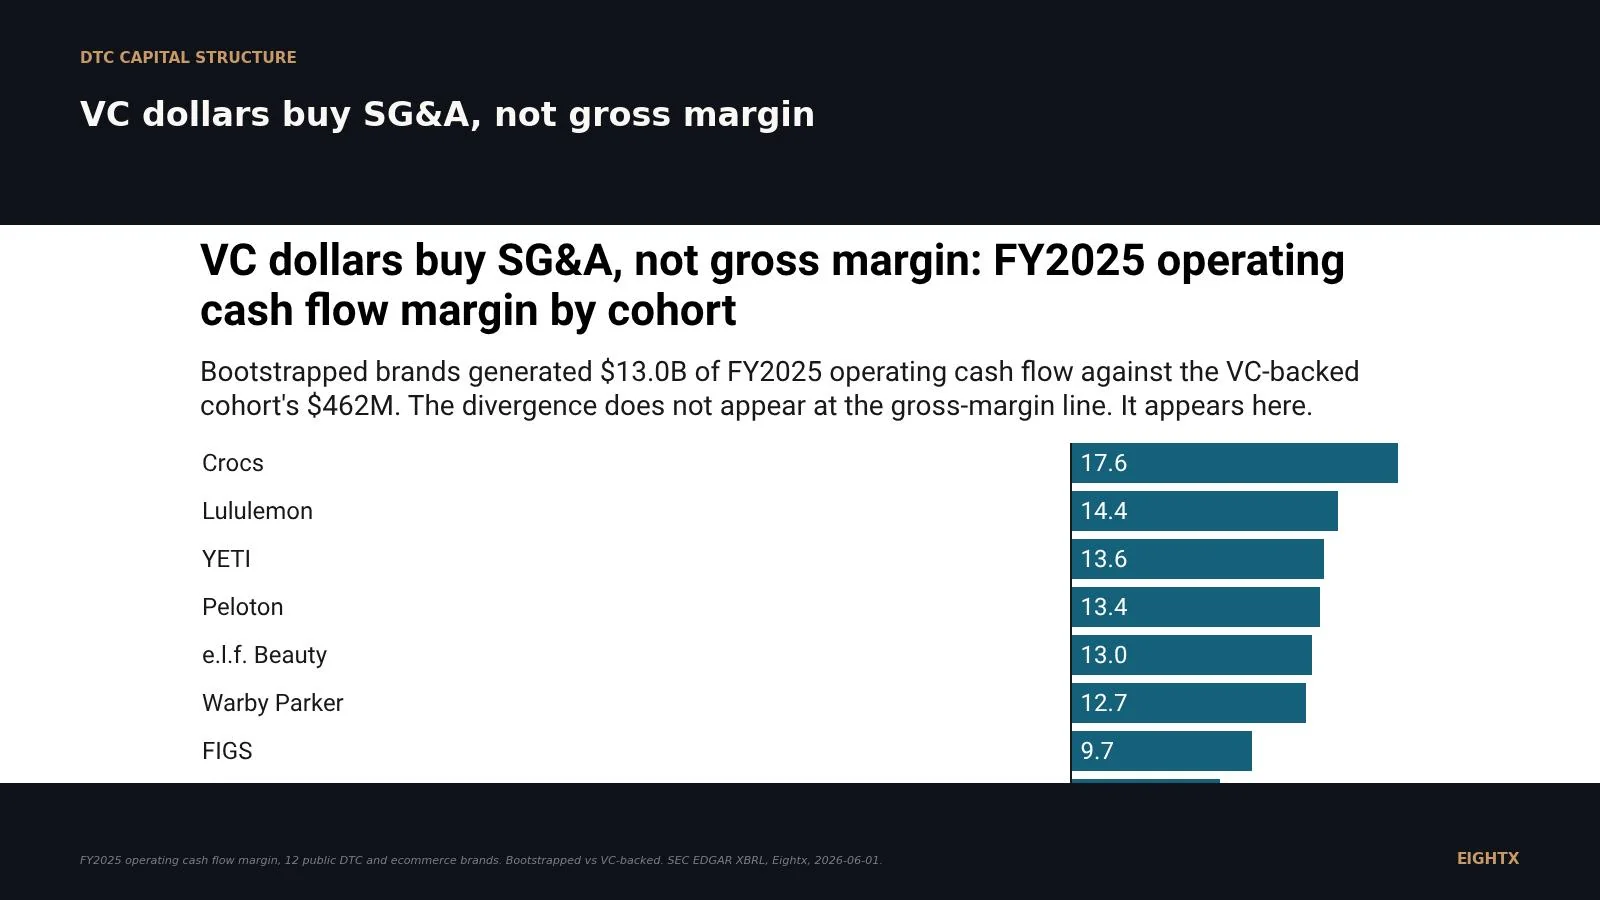
Bootstrapped DTC brands run ~6 points higher gross margin and nearly double the cash-flow margin of VC-backed peers. The dilution math, and when raising actually pays.
Jirav Starter runs $10k/year and Mosaic averages $24k. At $3M revenue the switch pays off only if the tool saves 3 to 8 hours a month. Here is the breakeven math.
Subscription LTV runs 3-5x one-time in DTC, but a cohort needs ~15 months to recover $100 of CAC. A side-by-side cash-flow model of the gap.
The 9 KPIs, the 13-week cash forecast, and the 30-minute Monday review that run a profitable 8-figure DTC brand. Benchmarks by revenue band and escalation rules.
The complete DTC finance stack by revenue band: accounting, reconciliation, inventory, FP&A, banking, a contribution-margin chart of accounts, and a day-5 close
Most DTC brands read gross margin off a chart of accounts built for tax, not truth. Here is the CoA mapped to CM1 through CM4, plus 6 misclassifications that hide real margin.
The DTC board deck and investor update that build trust: the 8 slides that matter, LTV:CAC and MER benchmarks, the 13-week cash slide, and 5 mistakes.
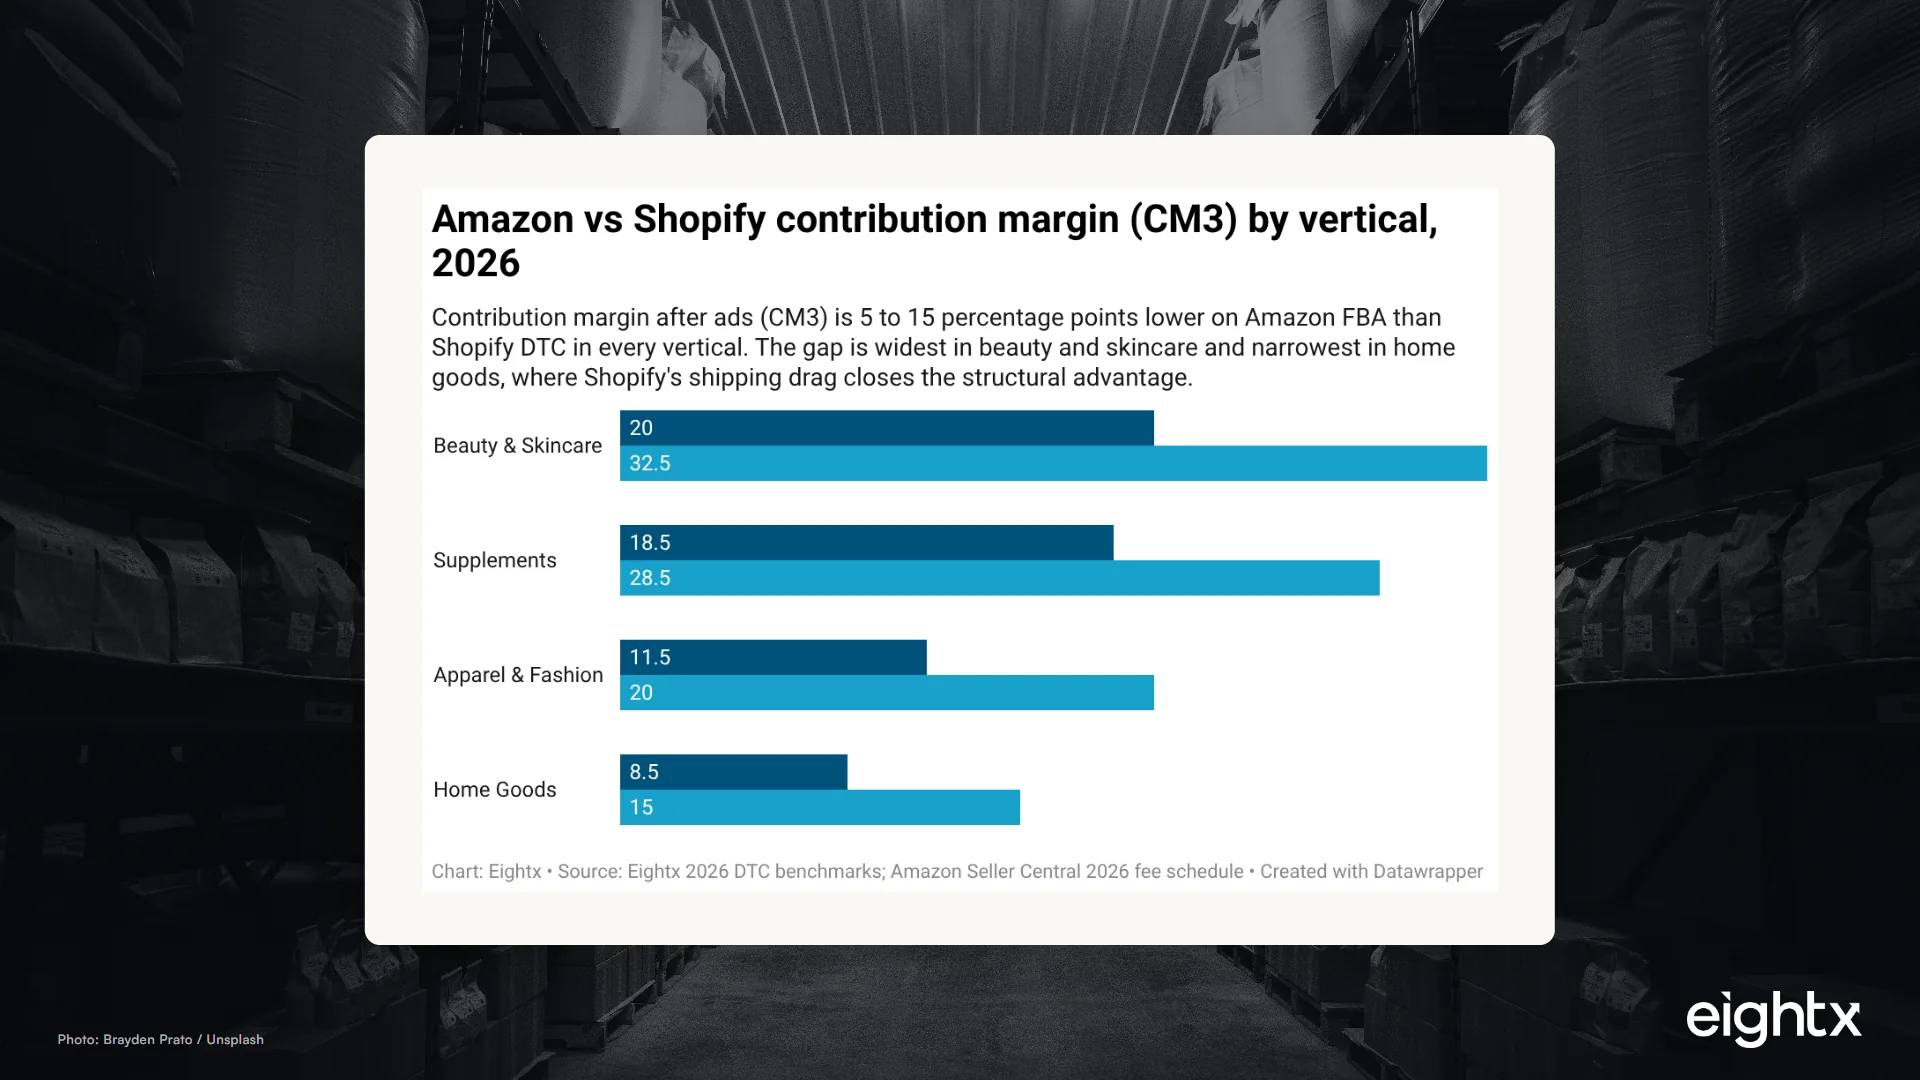
The same $40 product nets 7.6% on Amazon FBA and 24.1% on Shopify DTC after every fee. Full margin waterfall, costs founders undercount, and how to set your channel mix.
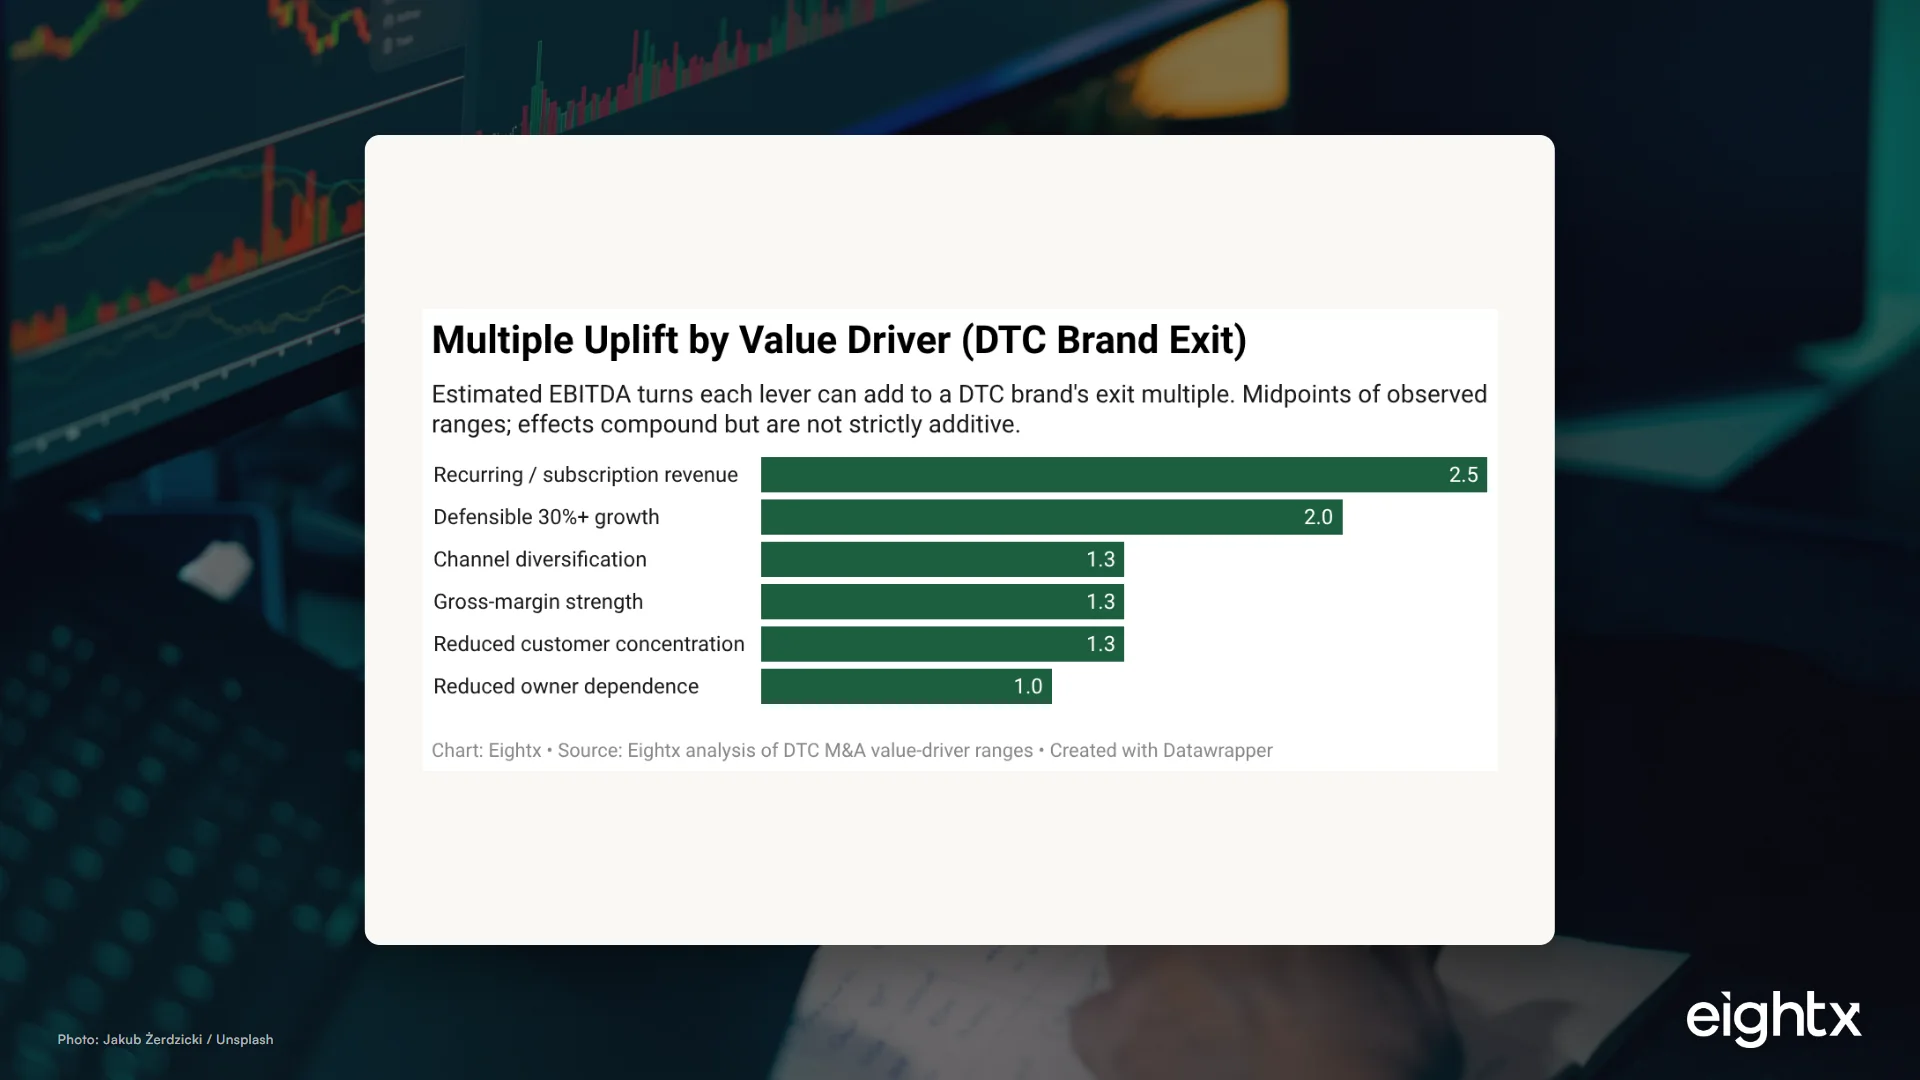
One channel above 40% of revenue can cost you 1-3 turns of EBITDA at exit. The concentration tiers, the substitution-cost test, and how to build an owned-channel floor.
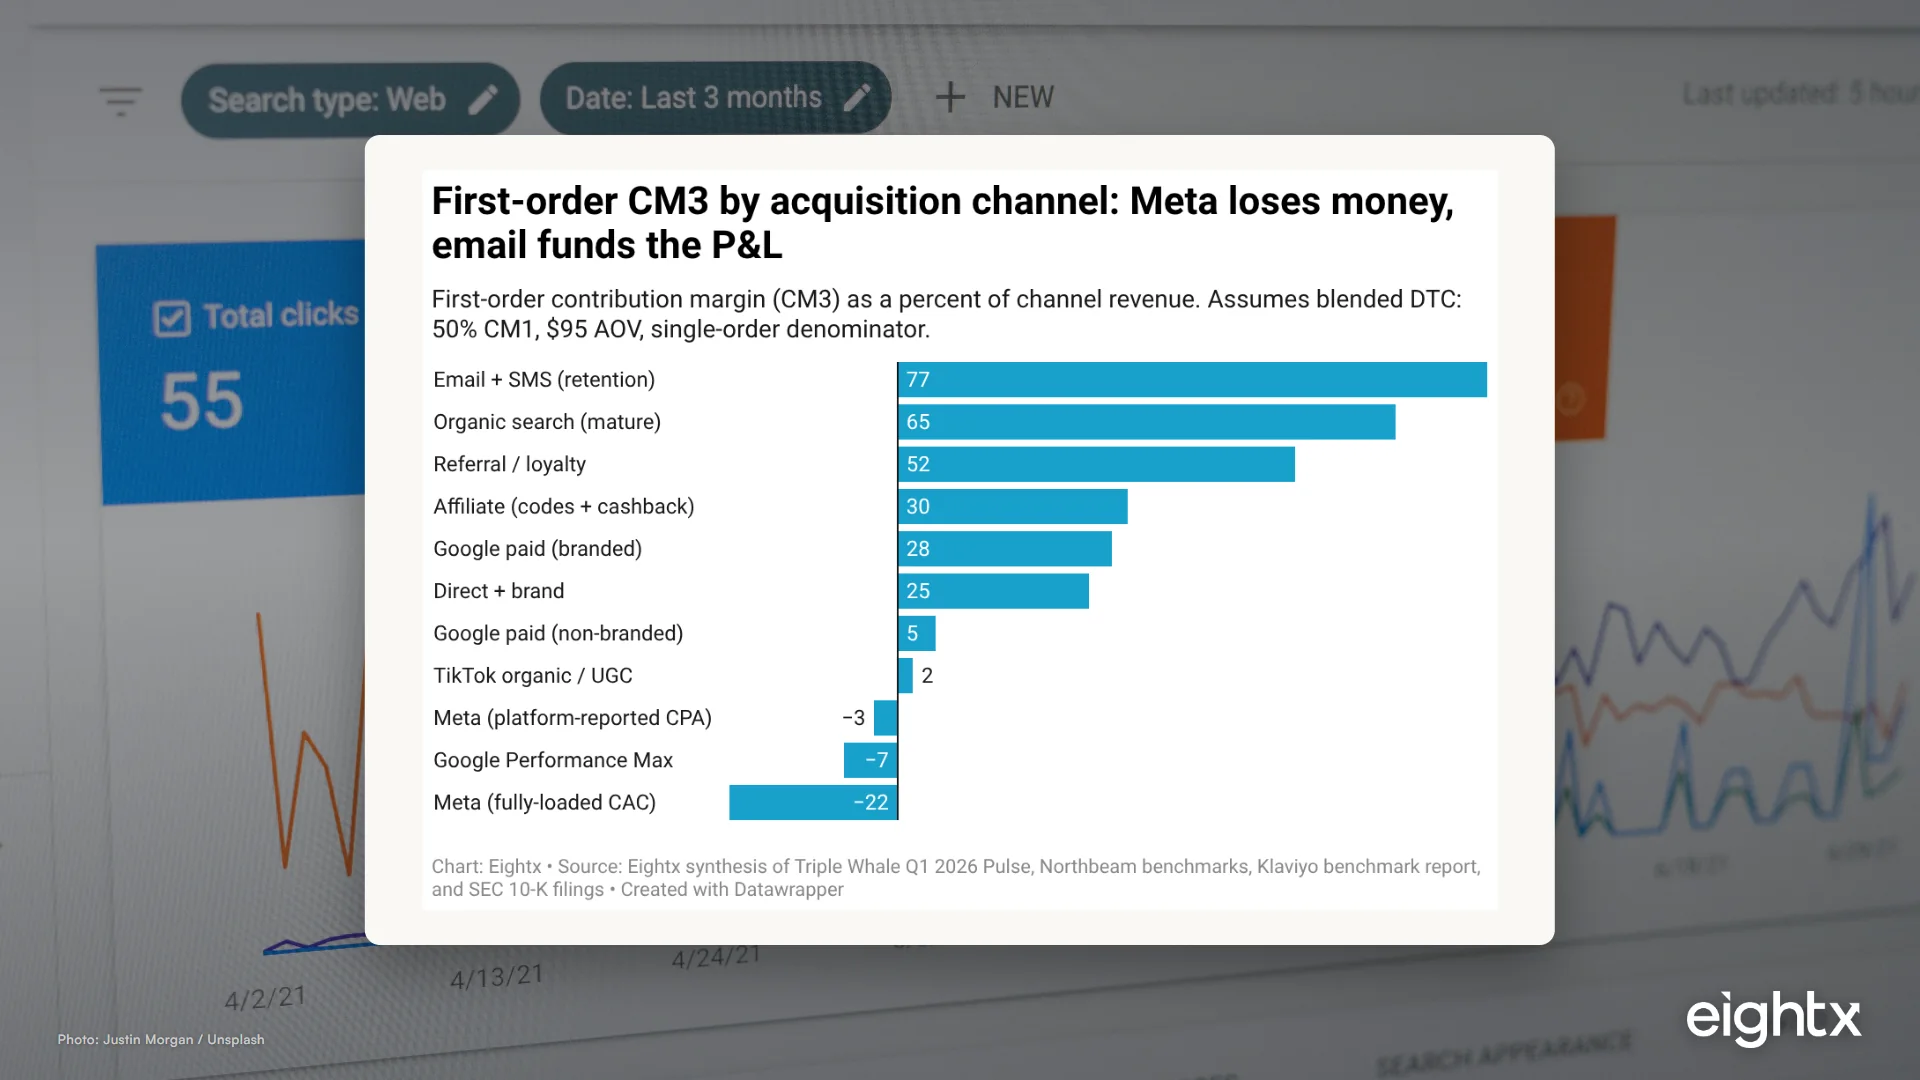
Meta CPM hit a record $10.88 in Q1 2025. Brands with email and SMS above 25% absorbed it. Run the owned-revenue floor test to see if yours would.
A $5M DTC brand pays $2,670 to $4,200/mo for Klaviyo platform, not the $2,070 email line. Here are the 9 cost buckets, real dollar ranges, and the COGS vs OpEx split.
Founder dependence costs a DTC brand 10-25% of enterprise value, or 0.5x to 1.5x off the EBITDA multiple. The five symptoms buyers price, and the 90-day fix.
Across private M&A, sellers collect about 21 cents per dollar of stated earnout, and 41% of deals pay zero. What that means for DTC founders and how to protect the payout.
When your top 3 customers are 40% of revenue, buyers quietly cut your multiple by 0.5x to 1.0x. Here is the math at $1M, $2M, and $4M EBITDA, and how to fix it.
At $5M revenue, which inventory tool pays for itself first? We run the payback math on Cin7, Inventory Planner, and NetSuite across carrying cost, stockouts, and labor.
Spending more than $2 to make $1 of new revenue? The burn multiple is the cleanest test of whether DTC growth is worth its cost. Benchmarks and the go/no-go checklist.
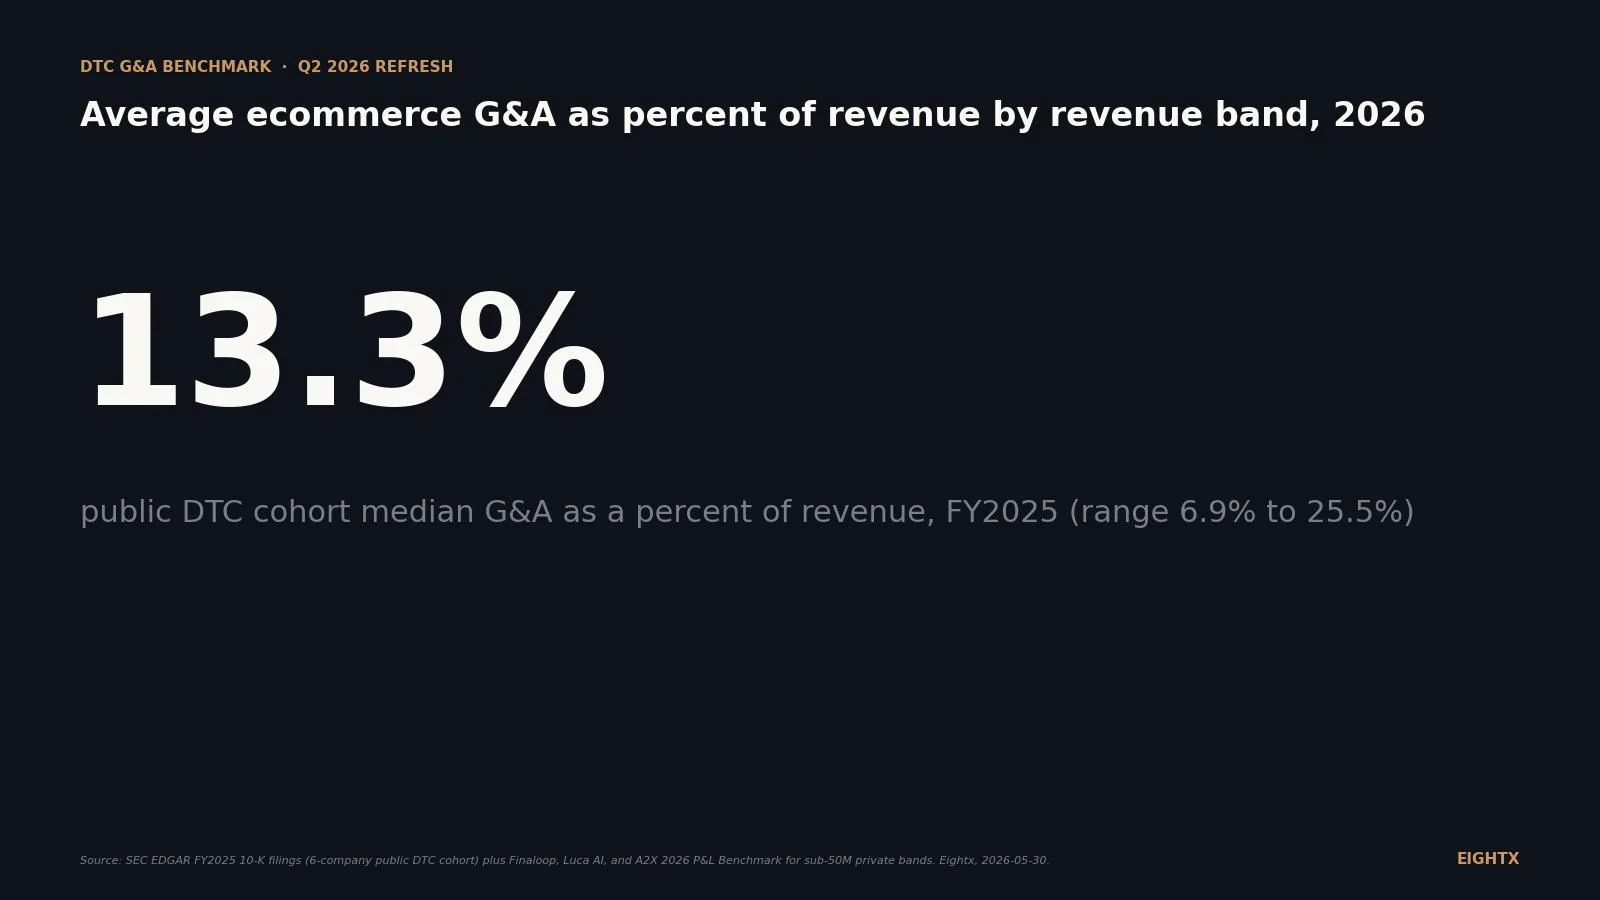
Sub-$10M DTC brands ran 23% G&A in 2025; mid-market brands add G&A dollars faster than revenue grows. See benchmarks by revenue band, plus REVOLVE and FIGS at scale.
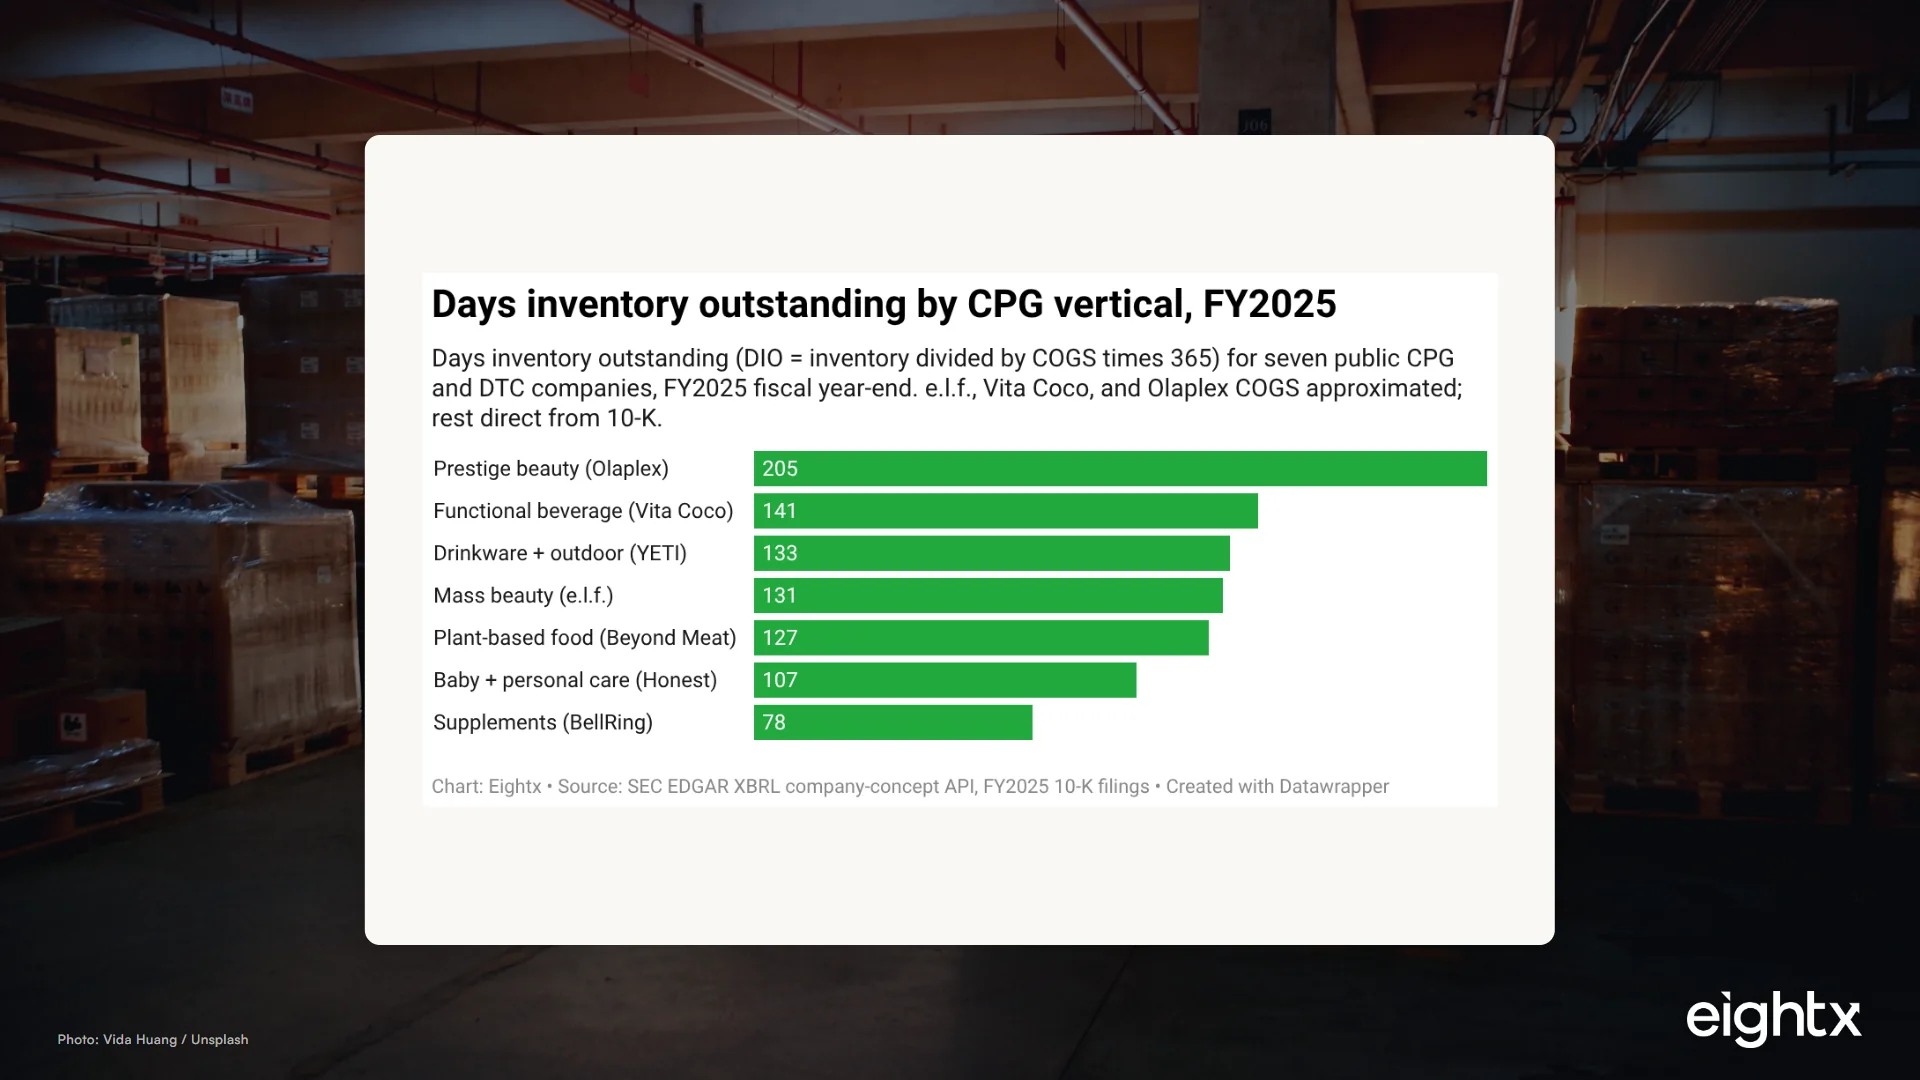
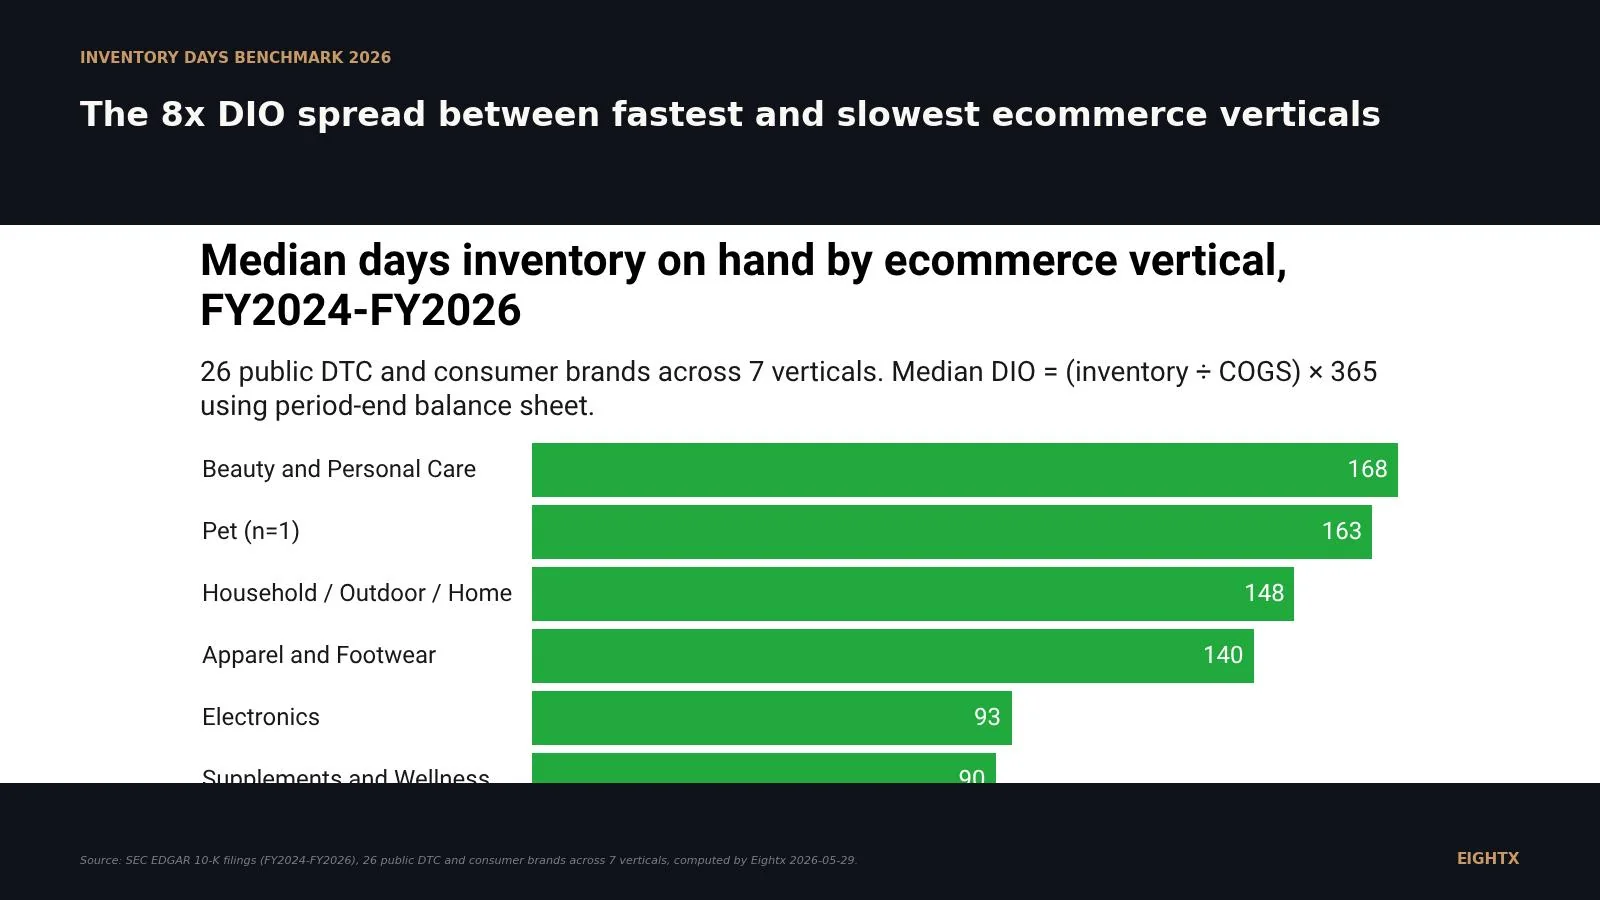
Days inventory outstanding (DIO) by vertical: food runs 26 days, apparel and footwear 70-120, beauty CPG 168+. Public 10-K benchmarks plus what each extra day costs.
Full 2025-2026 US Amazon referral fee schedule by category, from 8% flat on electronics to 45% on Device Accessories, plus the blended referral-plus-FBA take rate.
Crocs runs a 58.8% blended gross margin, but that blends DTC and wholesale economics. Skechers discloses a 22.9-point channel gap. What it means for your P&L.
The working-capital peg quietly reprices your DTC exit at close. How the true-up works, why seasonal brands get burned, and the $250K-$1.4M range at stake.
TikTok Shop markets a 6% fee, but the all-in take on a $40 product lands at 38-52% of GMV once FBT fulfillment, creator commissions, and GMV Max ad spend stack up.
The three-bucket tax reserve formula for DTC founders: payroll, estimated income, and sales tax. Why 15-25% of your bank balance is already spoken for.
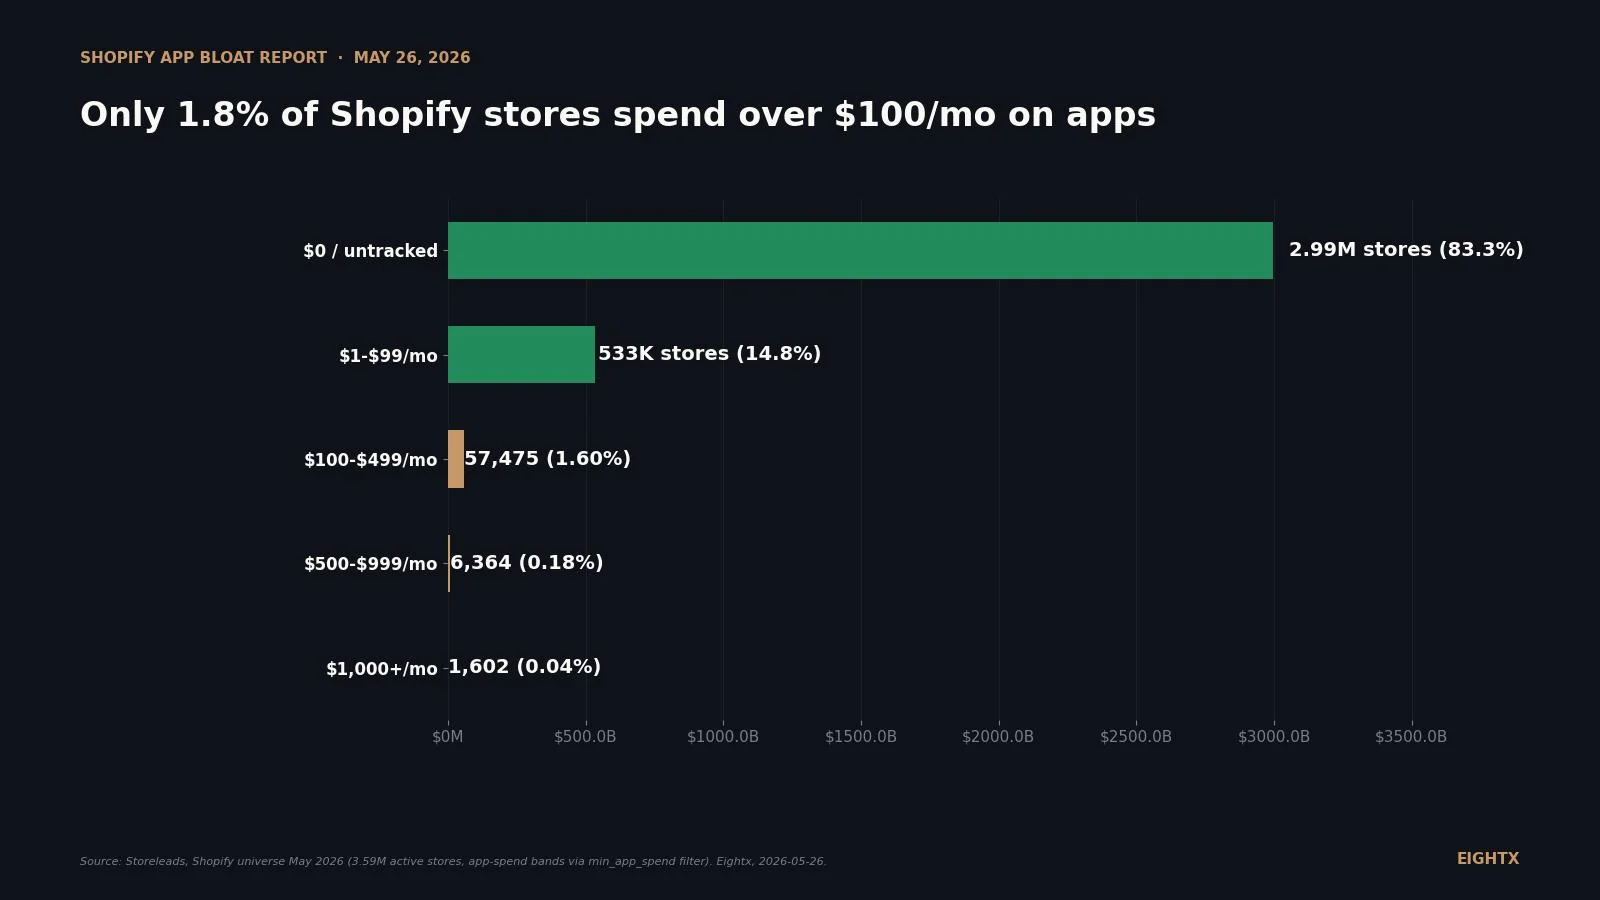
Most Shopify Plus brands run 15-30 apps and quietly pay $12,000-$43,000+ a year. Here is the 90-minute audit, the 6 overlap zones, and how to cut without breaking your store.
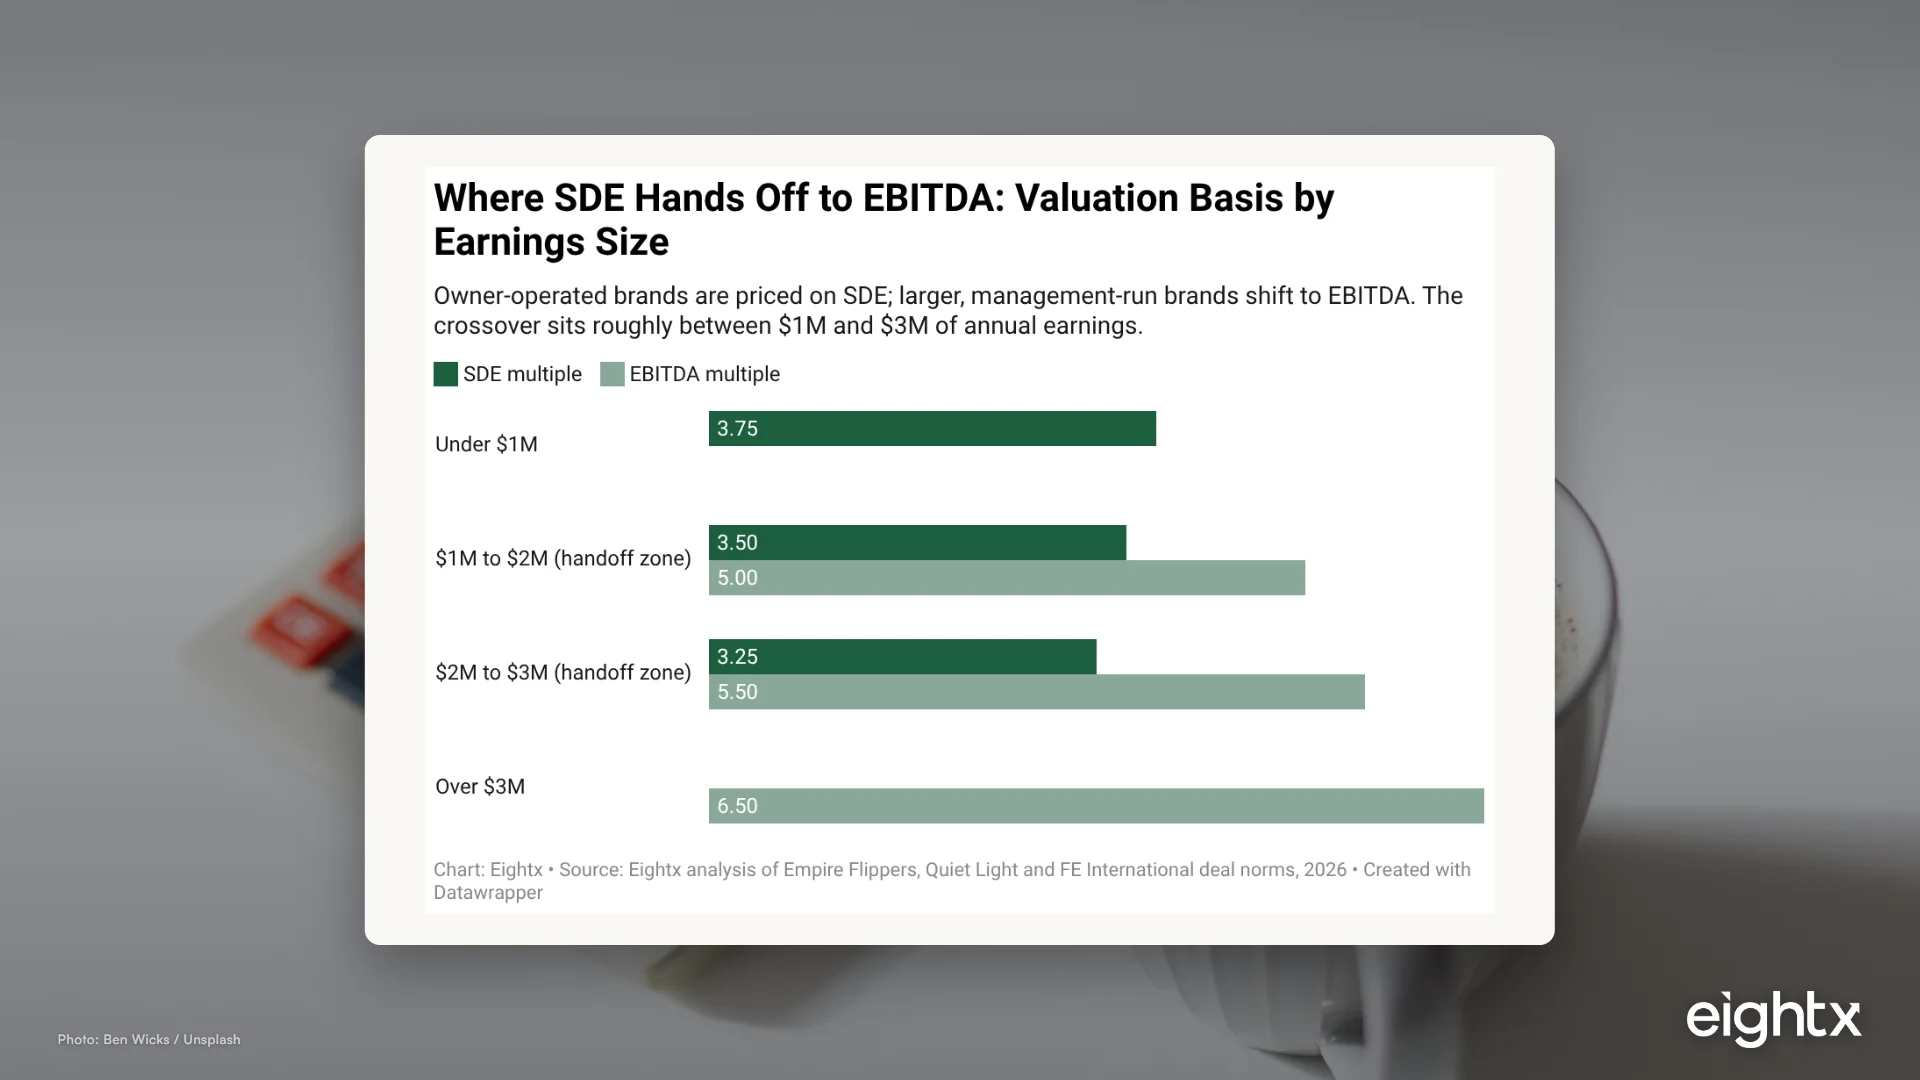
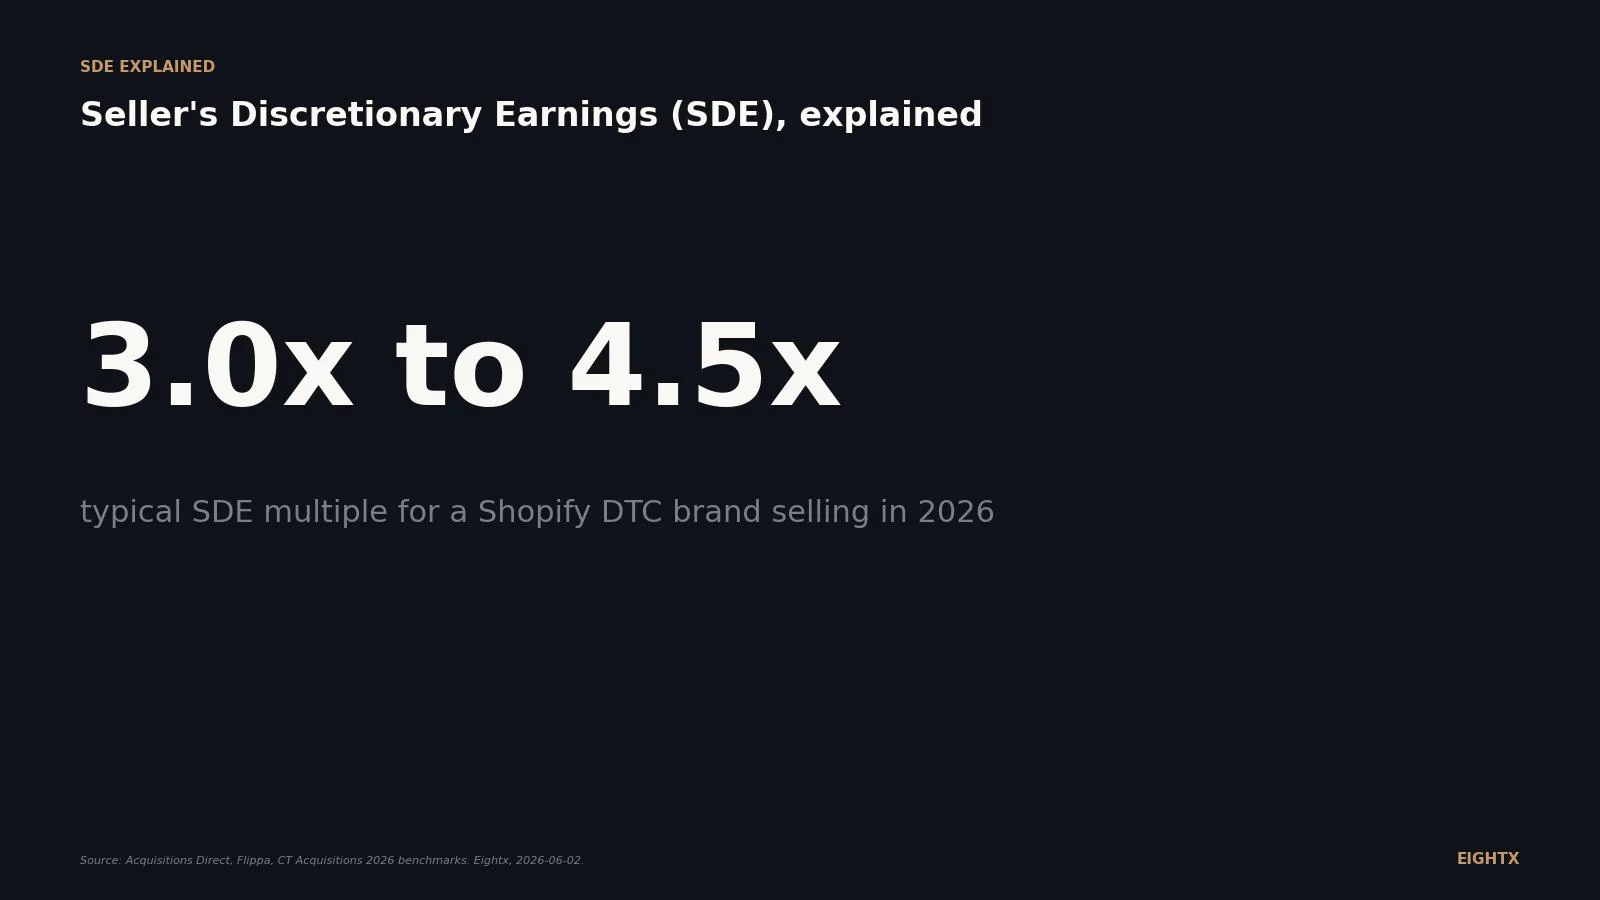
SDE adds back your full salary; EBITDA only the excess over a market-rate CEO. Which DTC buyers use which metric, and why it swings your sale proceeds by $788K.
Rockerbox, Triple Whale, and Elevar priced for a $500k/yr paid-media brand: $57,500 vs ~$13k vs $16k Year-1, plus what attribution data you lose when you switch.
Oddity (IL Makiage) runs a 72.7% gross margin on DTC beauty. We break down what's actually in cost of revenue, where the data model's cost hides, and what founders can copy.
A $500k balance earns about $350/year in big-bank checking but $15,800 in Mercury Treasury at current rates. We run the exact math and name the real switching costs.
The cash-timing math to run before you sign a big inventory purchase order. Total outflow, sell-through window, and the 45-day buffer rule that keeps payroll safe.
A durable 5-point gross margin lift on a $20M DTC brand can add $7-8M of enterprise value. Here is the three-step math, the buyer thresholds, and the five levers.
Founders at $5M compare a fractional CFO's fee to a vague sense of clarity. Here is the real ROI math on cash cycle, vendors, tax, and inventory.
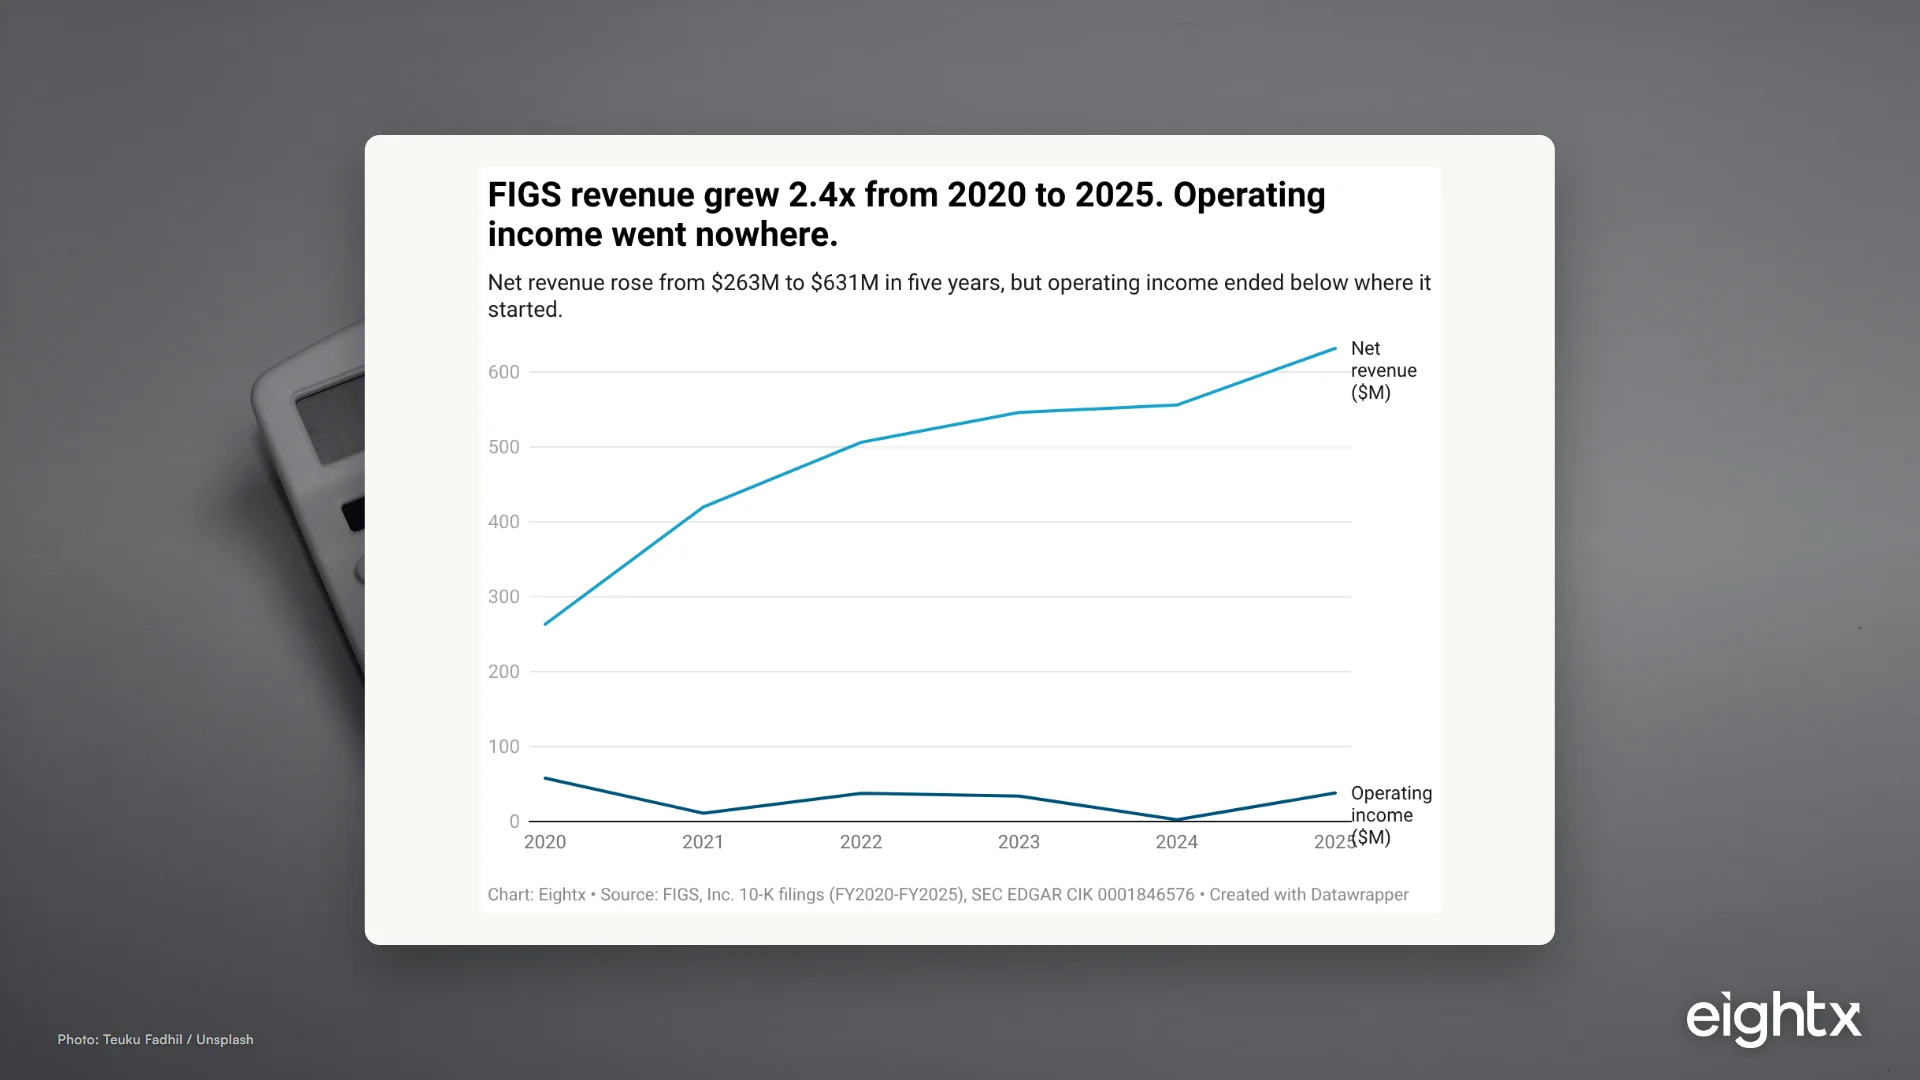
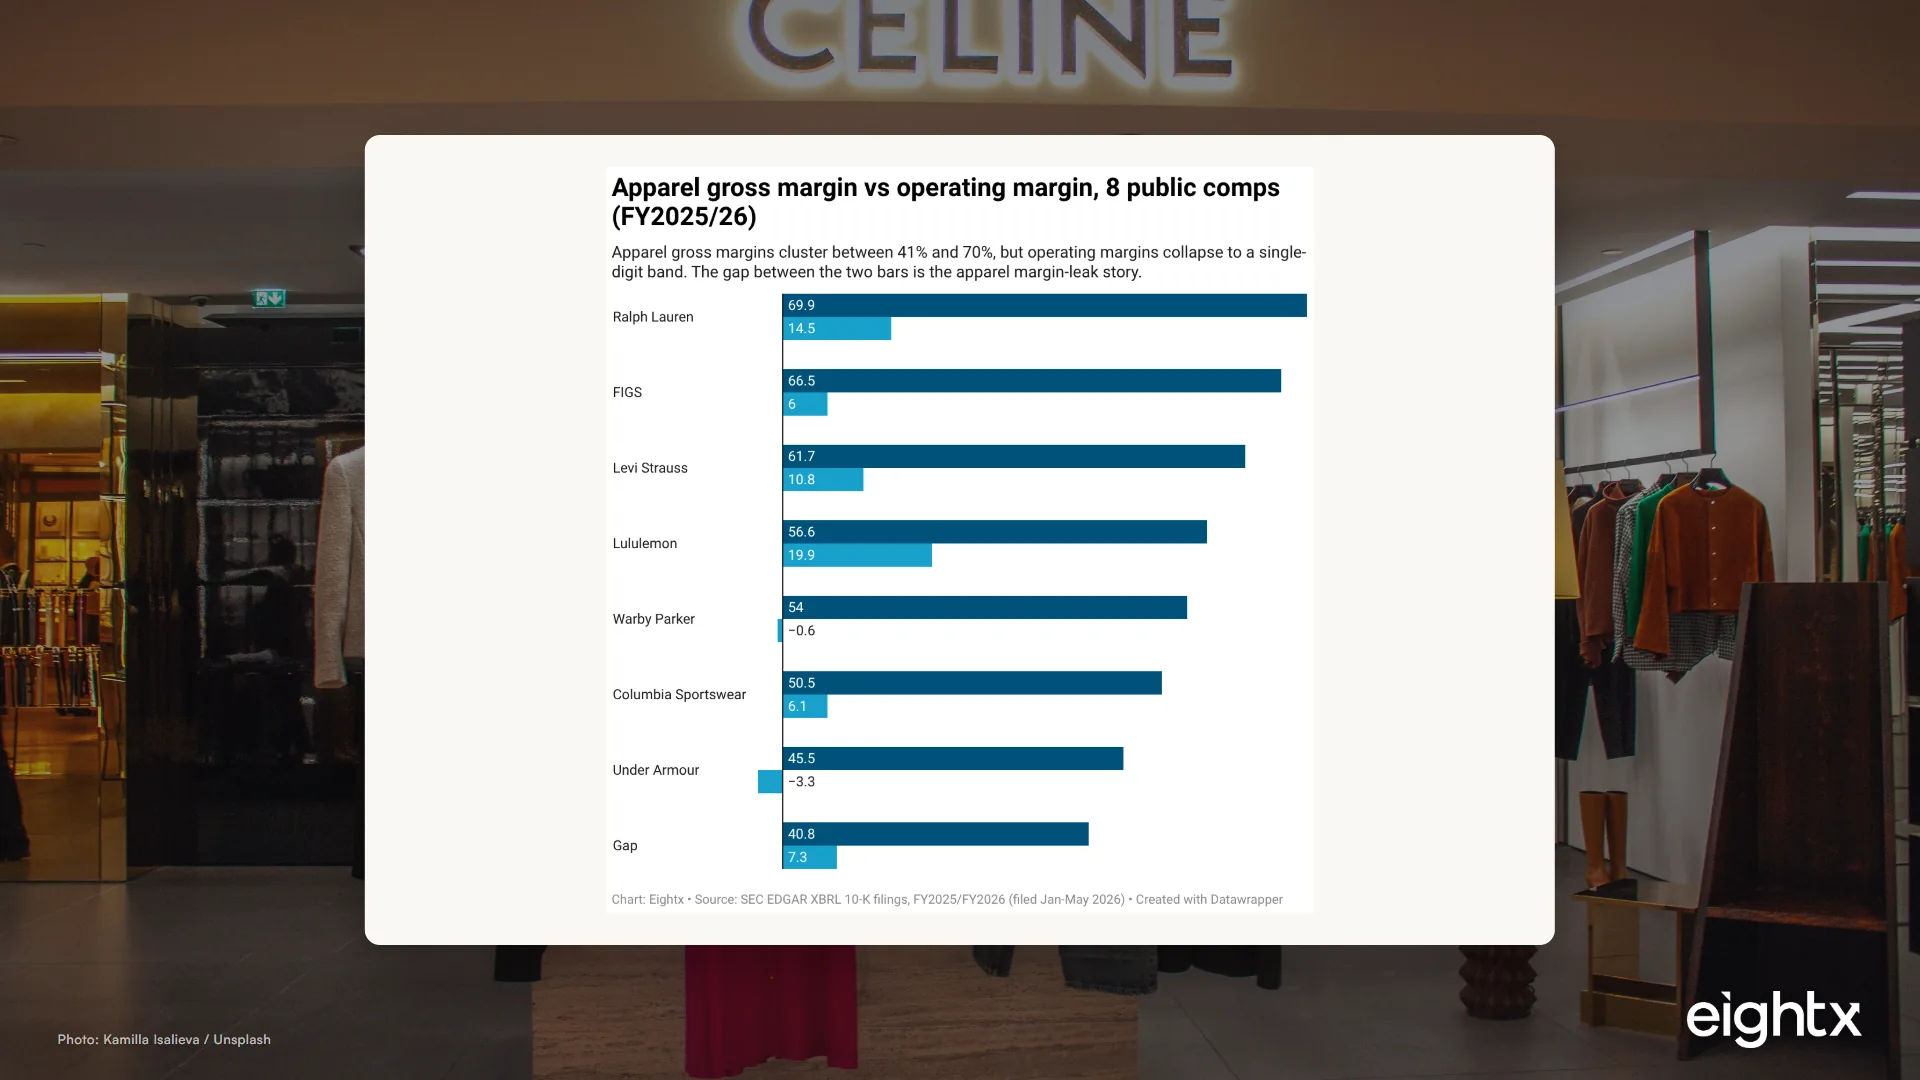
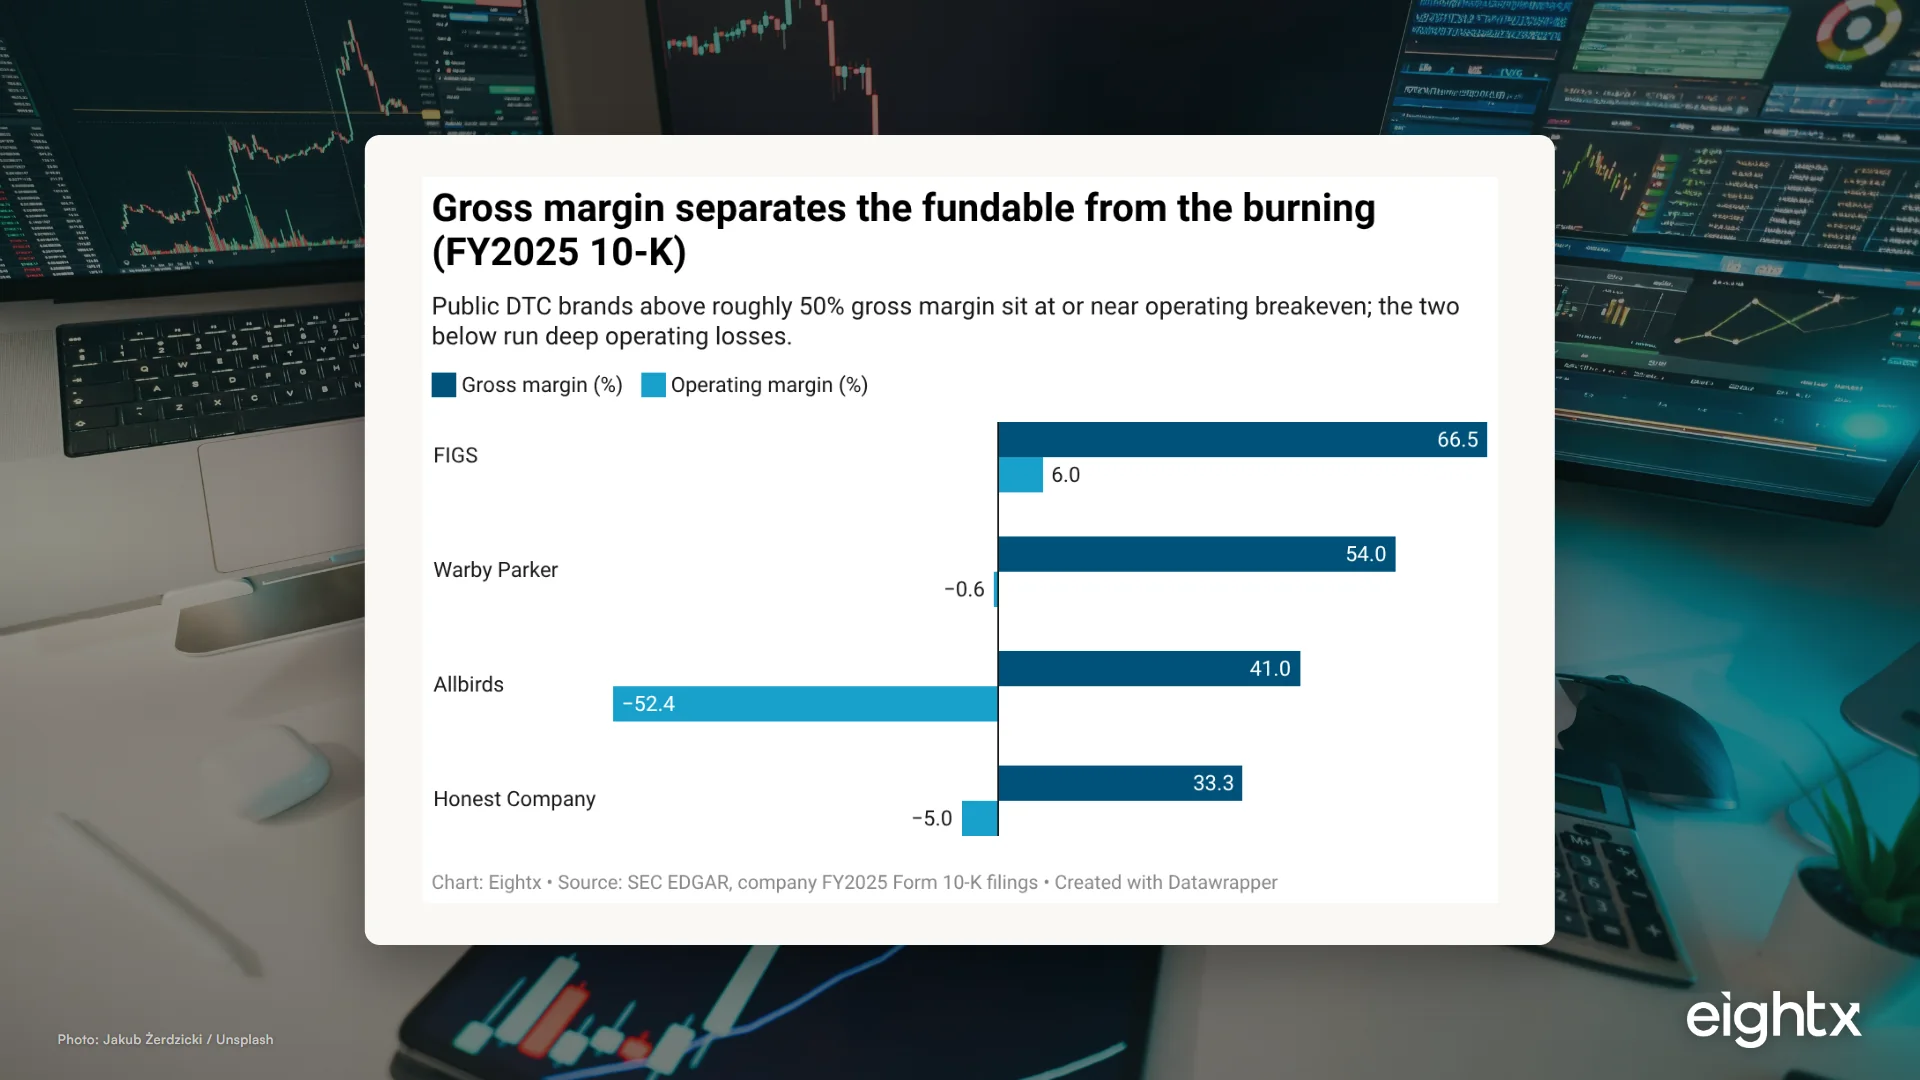
FIGS runs a 66.5% gross margin but earned just 6.0% operating margin in FY2025 and 0.4% in FY2024. The reason is the three SG&A lines below gross profit.
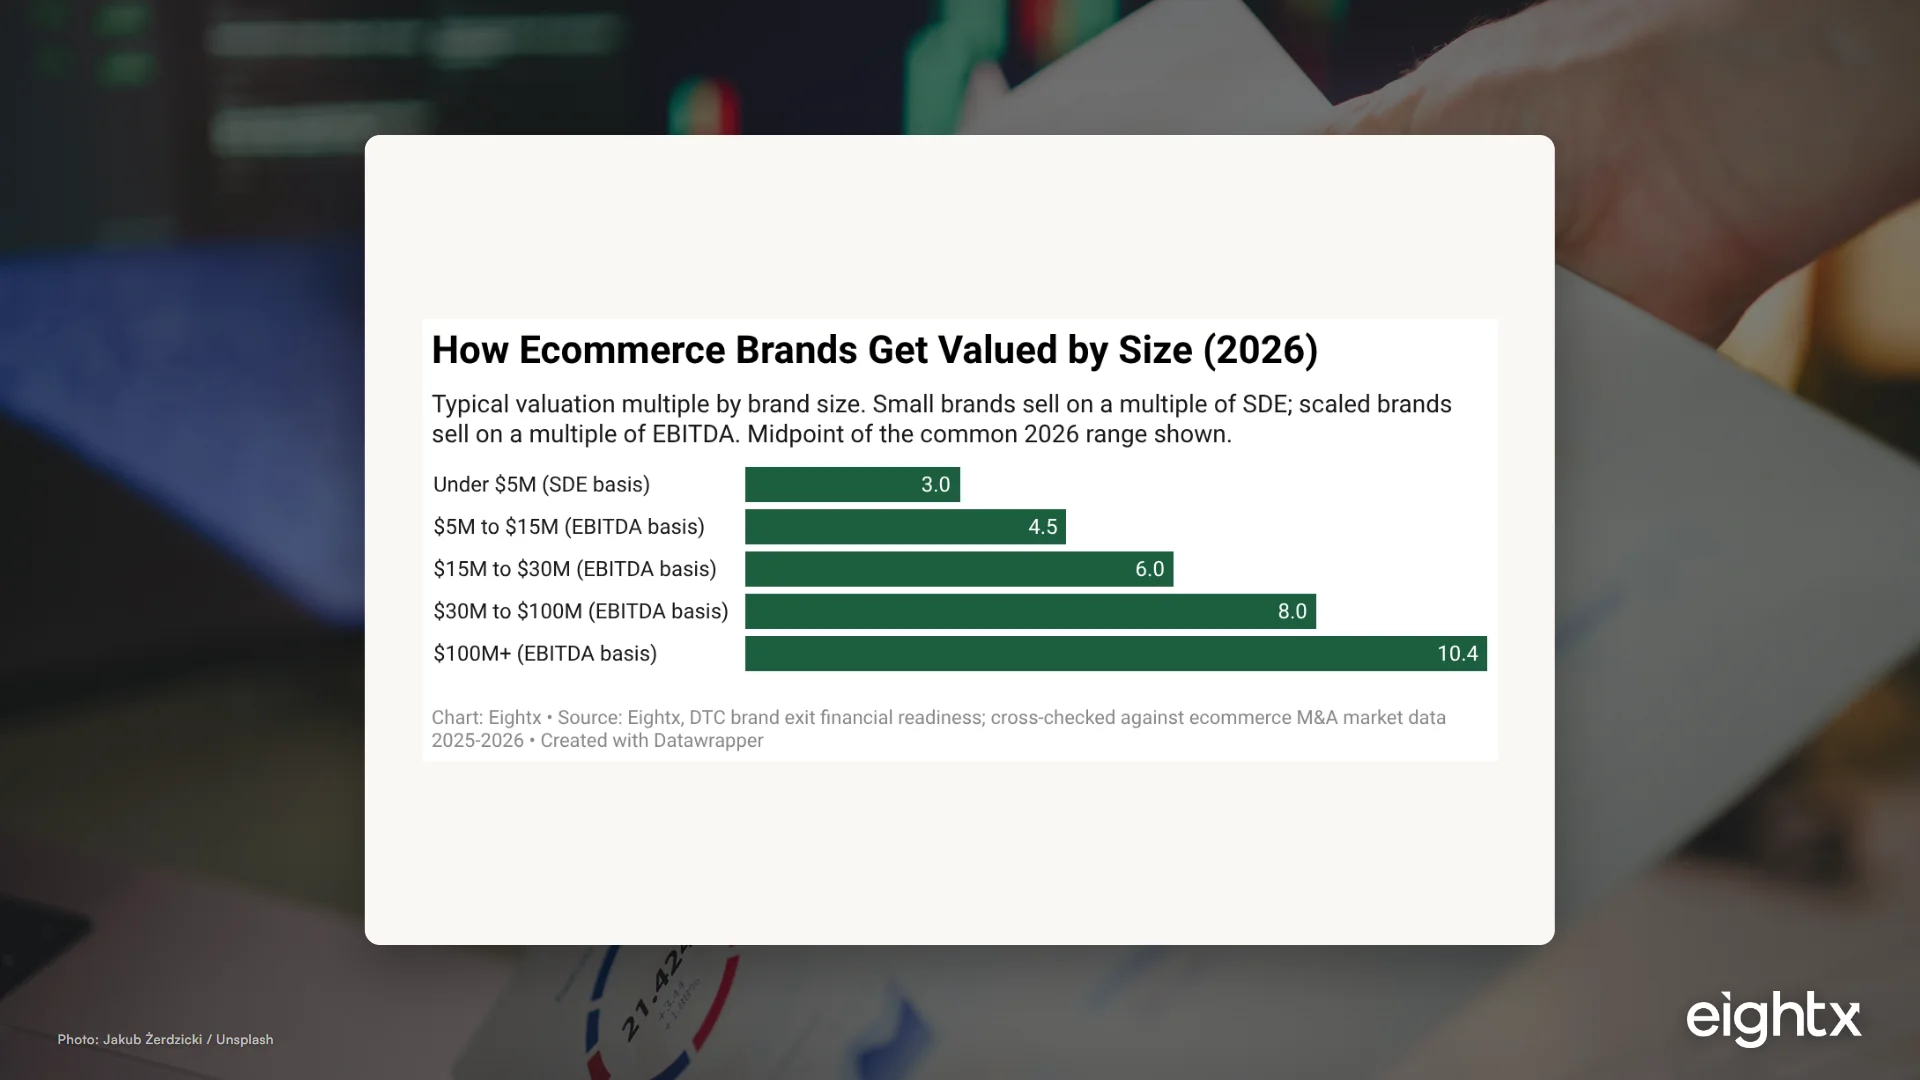
A $10M DTC brand sells at 2.5x to 6x EBITDA in 2026. The five scoreable factors that decide where you land, plus the 12-18 month playbook to move up a band.
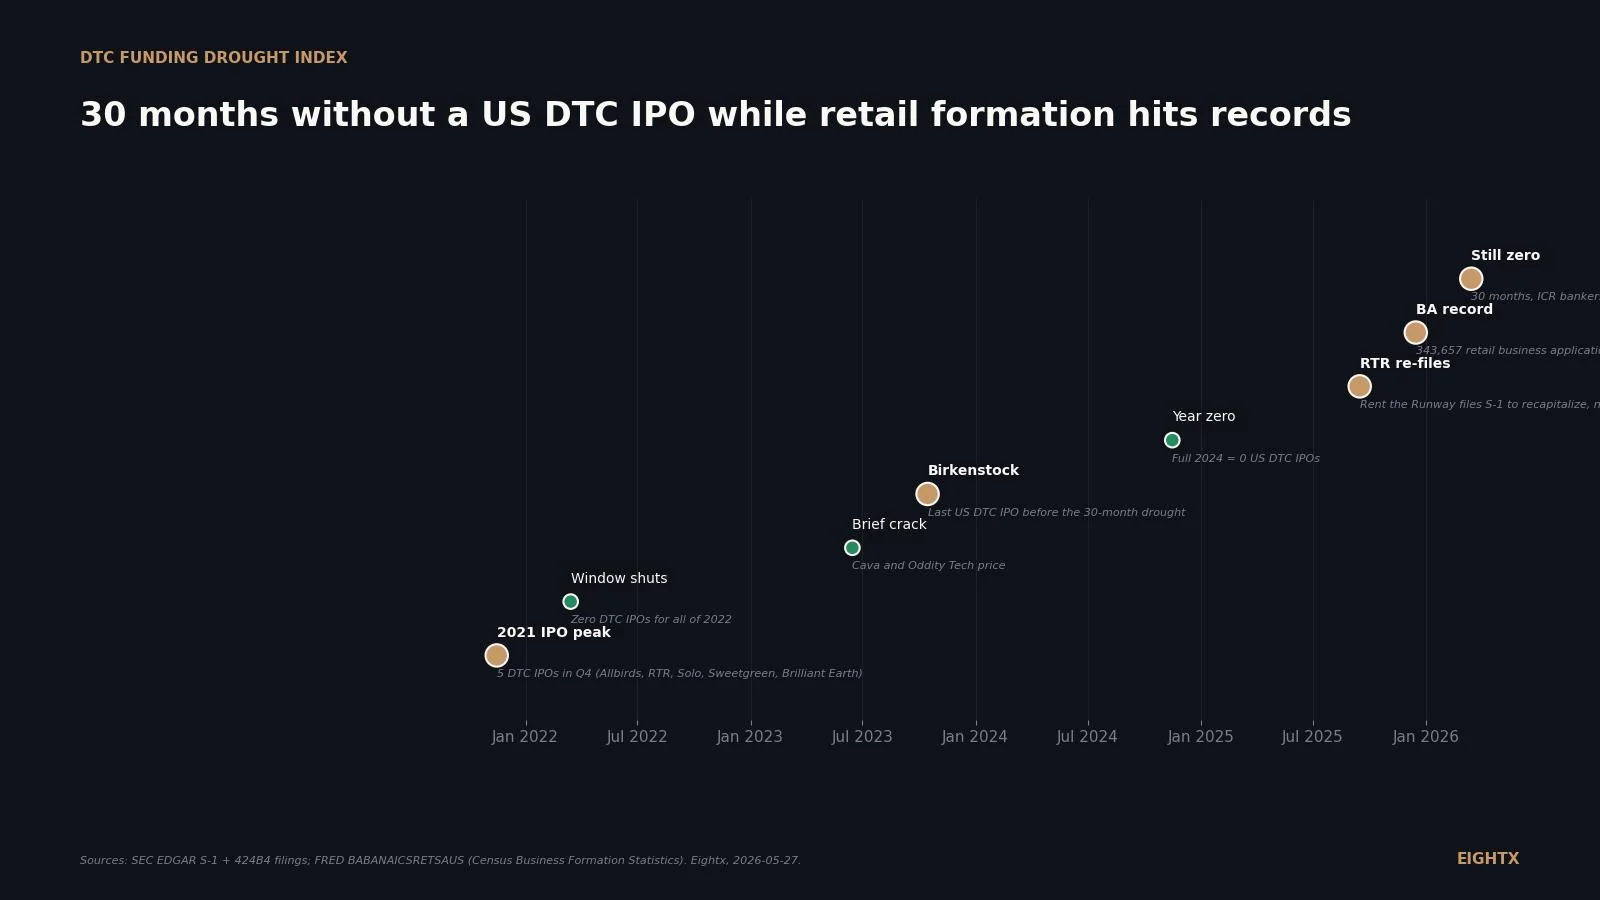
Birkenstock runs a 59-62% gross margin on cork-and-foam sandals. SEC filings show the margin is defended by distribution control, not cost.
US retail media spend hits $69.33B in 2026, but stores driving 80%+ of sales get only 3.3% of it. A DTC budget-allocation blind spot worth auditing.
La-Z-Boy is cutting 15 DCs to 3 hubs to trim cost. The CFO lesson for DTC operators: know when fewer fulfillment nodes beat adding more.
Milani beat its TikTok Shop launch goal by 250%, but it's a $250M wholesale brand. The real read: TikTok Shop as launch funnel, not revenue channel.
5,000+ baby stores closed 2015-2025, wiping out 20M+ sq ft of retail. Why this is a shrinking category, not a channel shift, and what it means for DTC operators
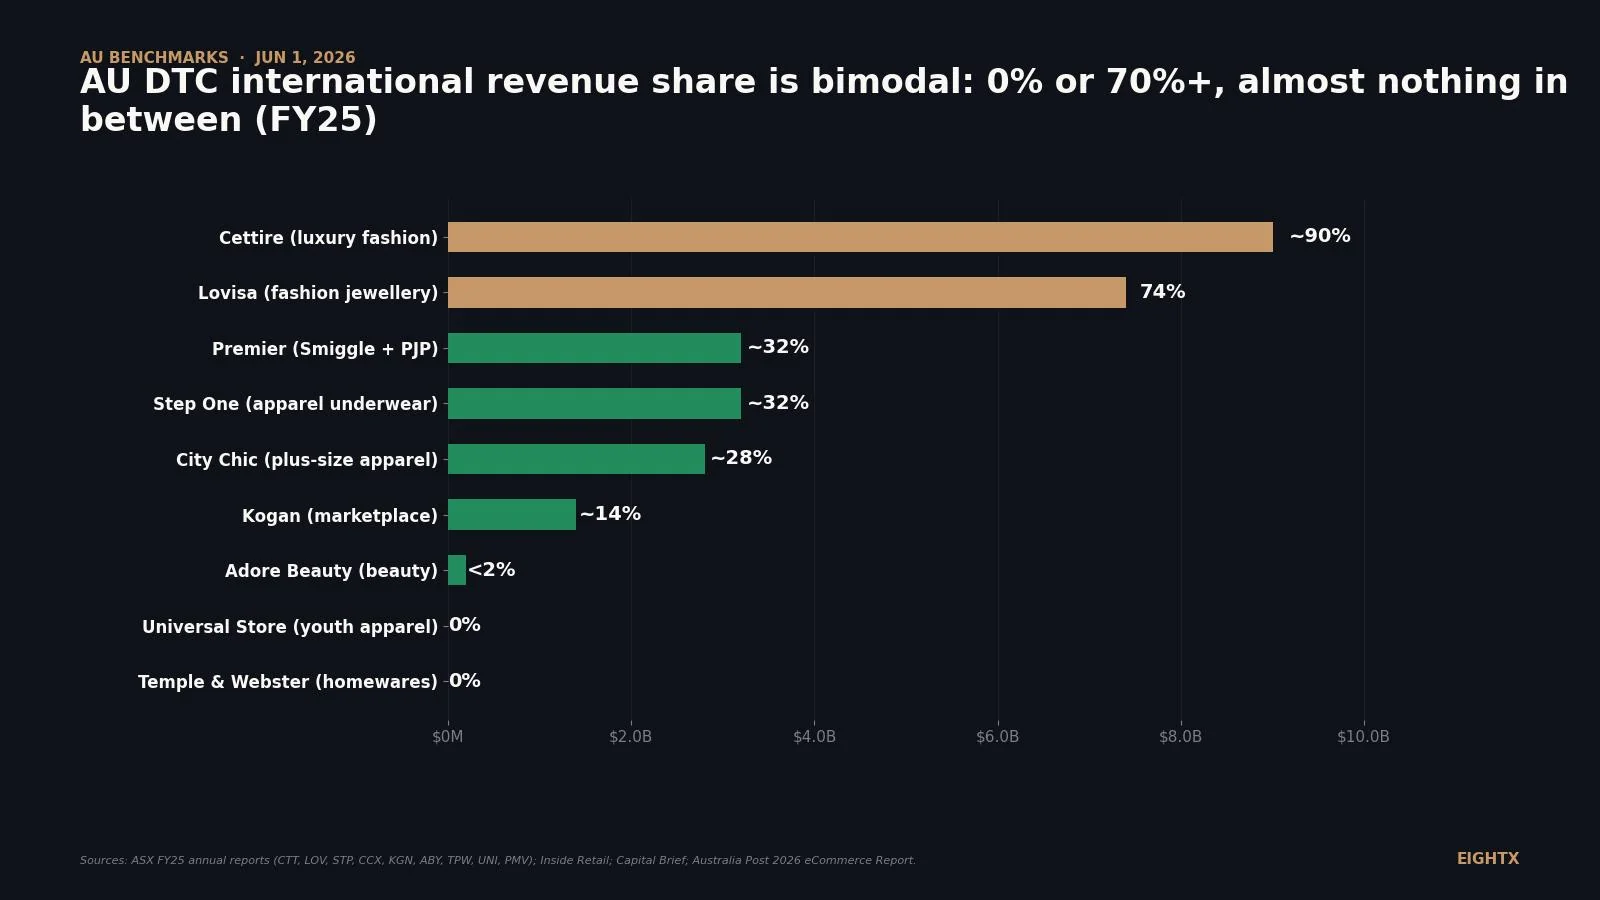
IAB Australia: nearly half of retail media spend is reallocated, not new. 73% cite inconsistent metrics. What AU DTC brands should do before shifting budget.
Most brands track the 2.5% card rate and miss the gateway surcharge, $15 dispute fee, and BNPL premium. Here is the real blended payment cost at $5M GMV.
About 1 in 5 R&W-insured deals draws a claim. Financial statements and material contracts drive 71% of payments. The 6 clauses DTC sellers must clean up first.
Before you submit a Lightning Deal, run three numbers: Amazon channel contribution margin, break-even discount depth, and restock lead time. Any one can kill it.
BFCM gross revenue is not cash. After returns, reverse shipping, labor, and markdowns, DTC brands recover about $0.42 per BFCM dollar. Here is the December 1 model.
Sell 60% of a $10M DTC brand to a PE firm and the waterfall pays the fund first. Here is the dollar math on cash at close, the second bite, and what year 3 really looks like.
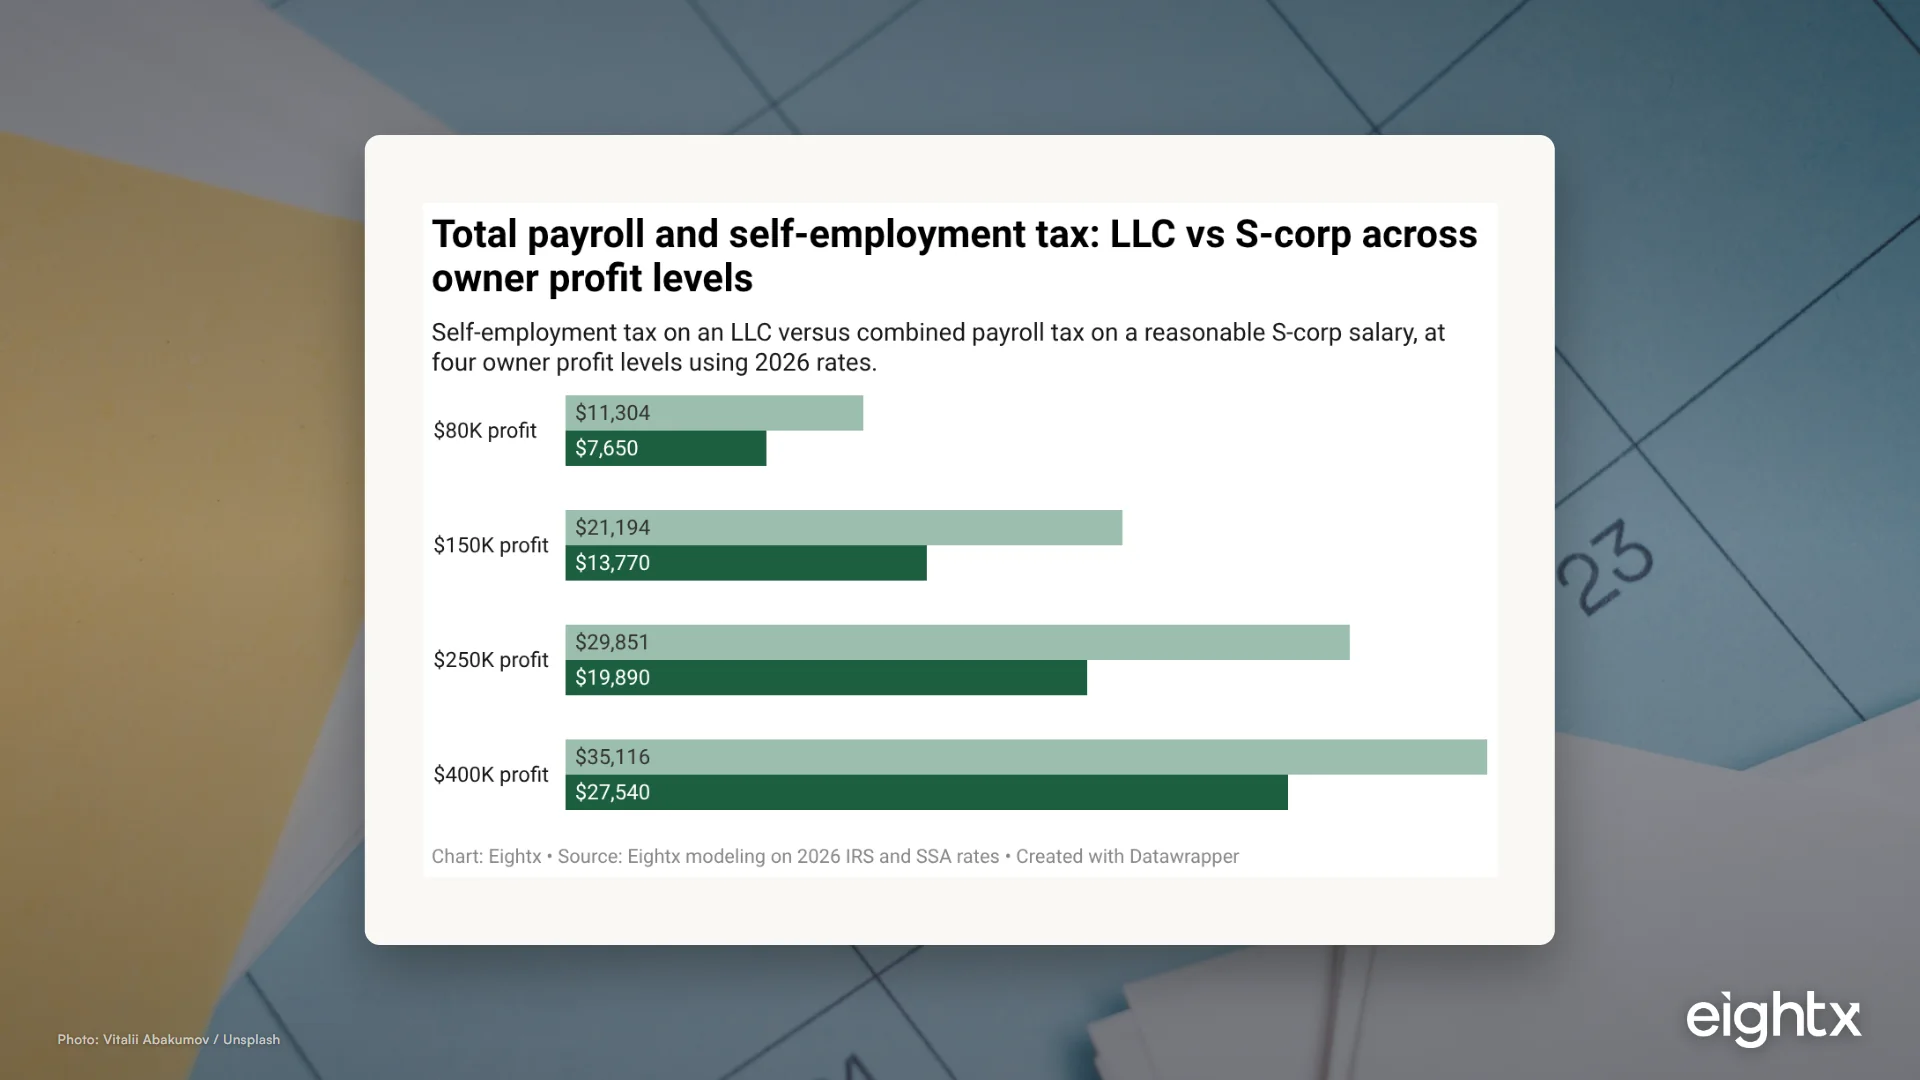
S-Corp owners save ~15.3% FICA on distributions, but under-paying salary builds a $15K-$40K surprise tax bill by April. The math, the audit risk, and a December checklist.
How much cash a $5M DTC brand needs in the account by September 1: the 8-12% of revenue floor, why the money leaves in August, and the January trough that follows.
A 5% earn rate on $4M of repeat revenue issues $200K in point liability a year. Here is the real loyalty P&L: breakage, platform fees, and the lift you must earn back.
We model the real 12-month cost of running 50 creators on Grin, Impact.com, or Creator.co for a $5M DTC brand. The SaaS fee is only 7% to 23% of it.
Buyers hold 10-12.5% of a DTC sale price in escrow for 12-18 months. What triggers a claim, how deal size changes the terms, and how to negotiate it down.
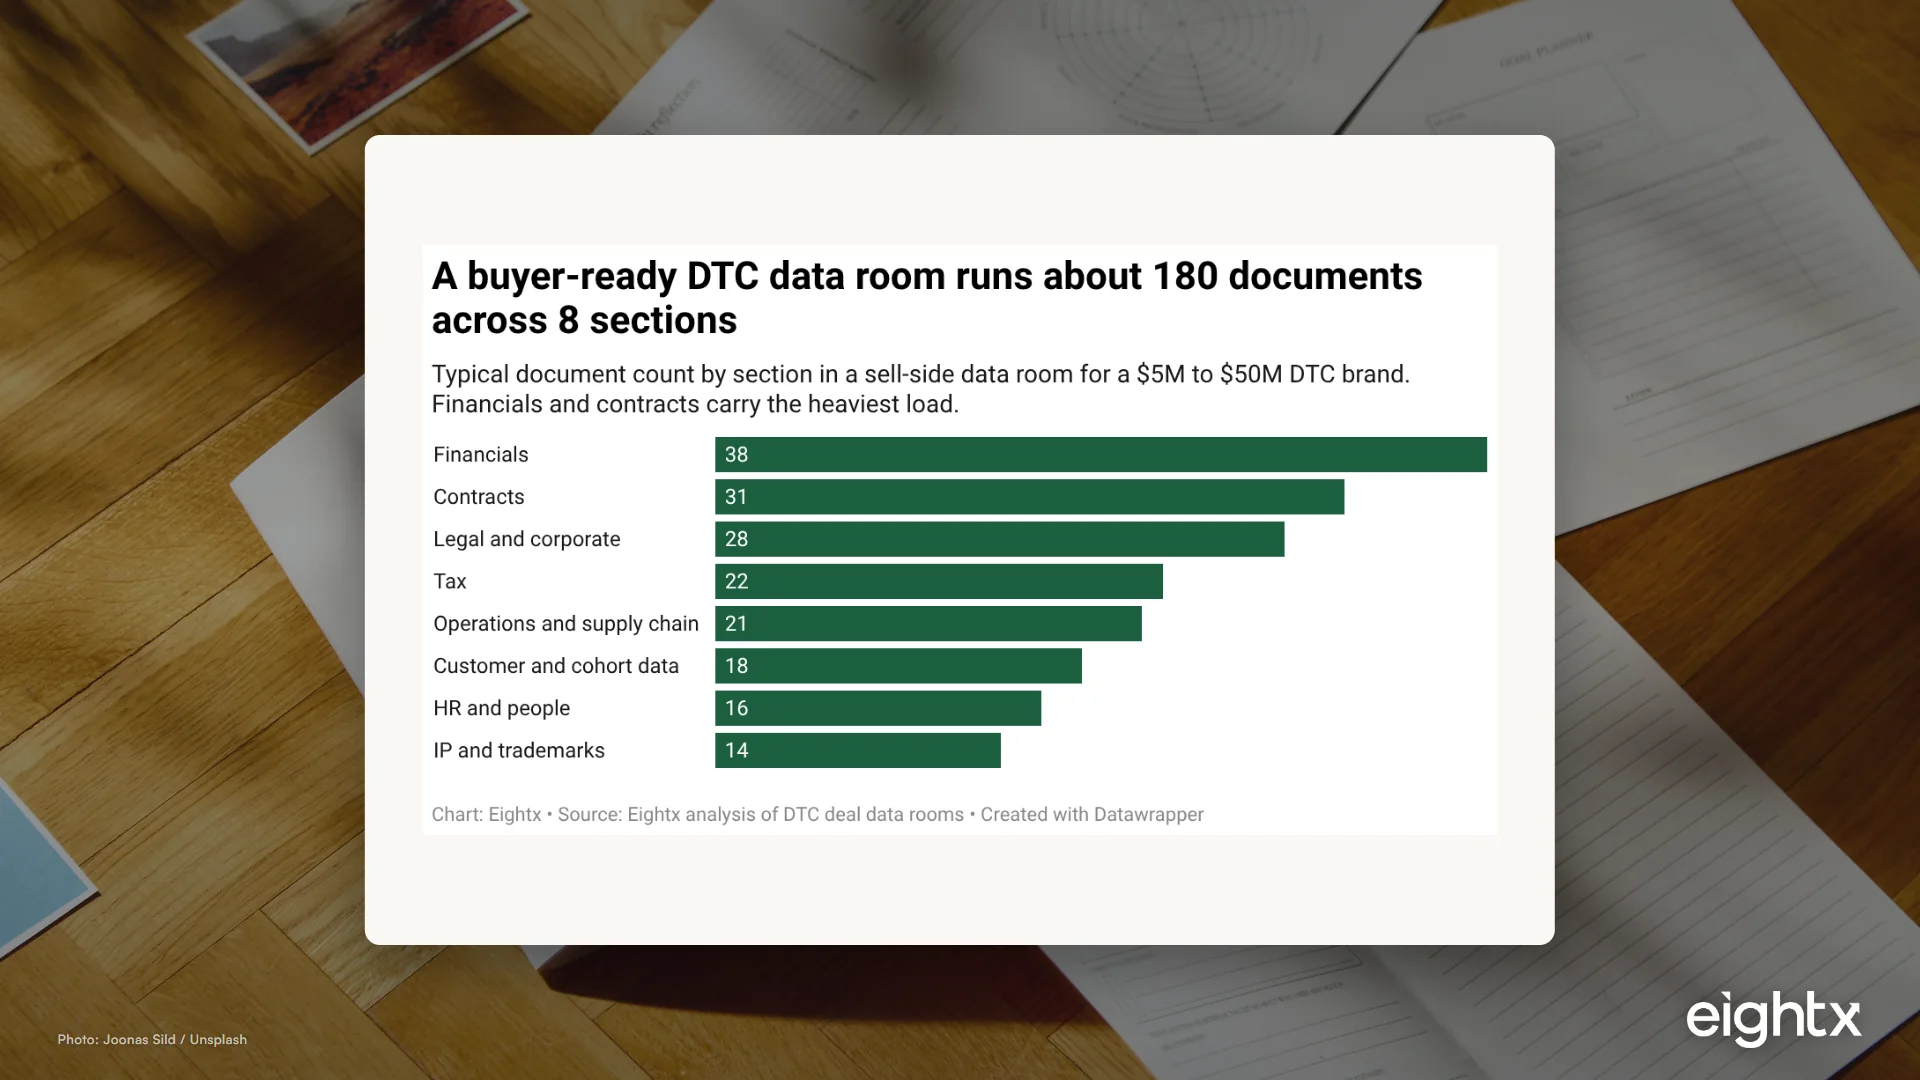
Most DTC brands lose an acquisition not on price but on 7 diligence surprises, each fixable 12 to 18 months before the LOI. Here they are.
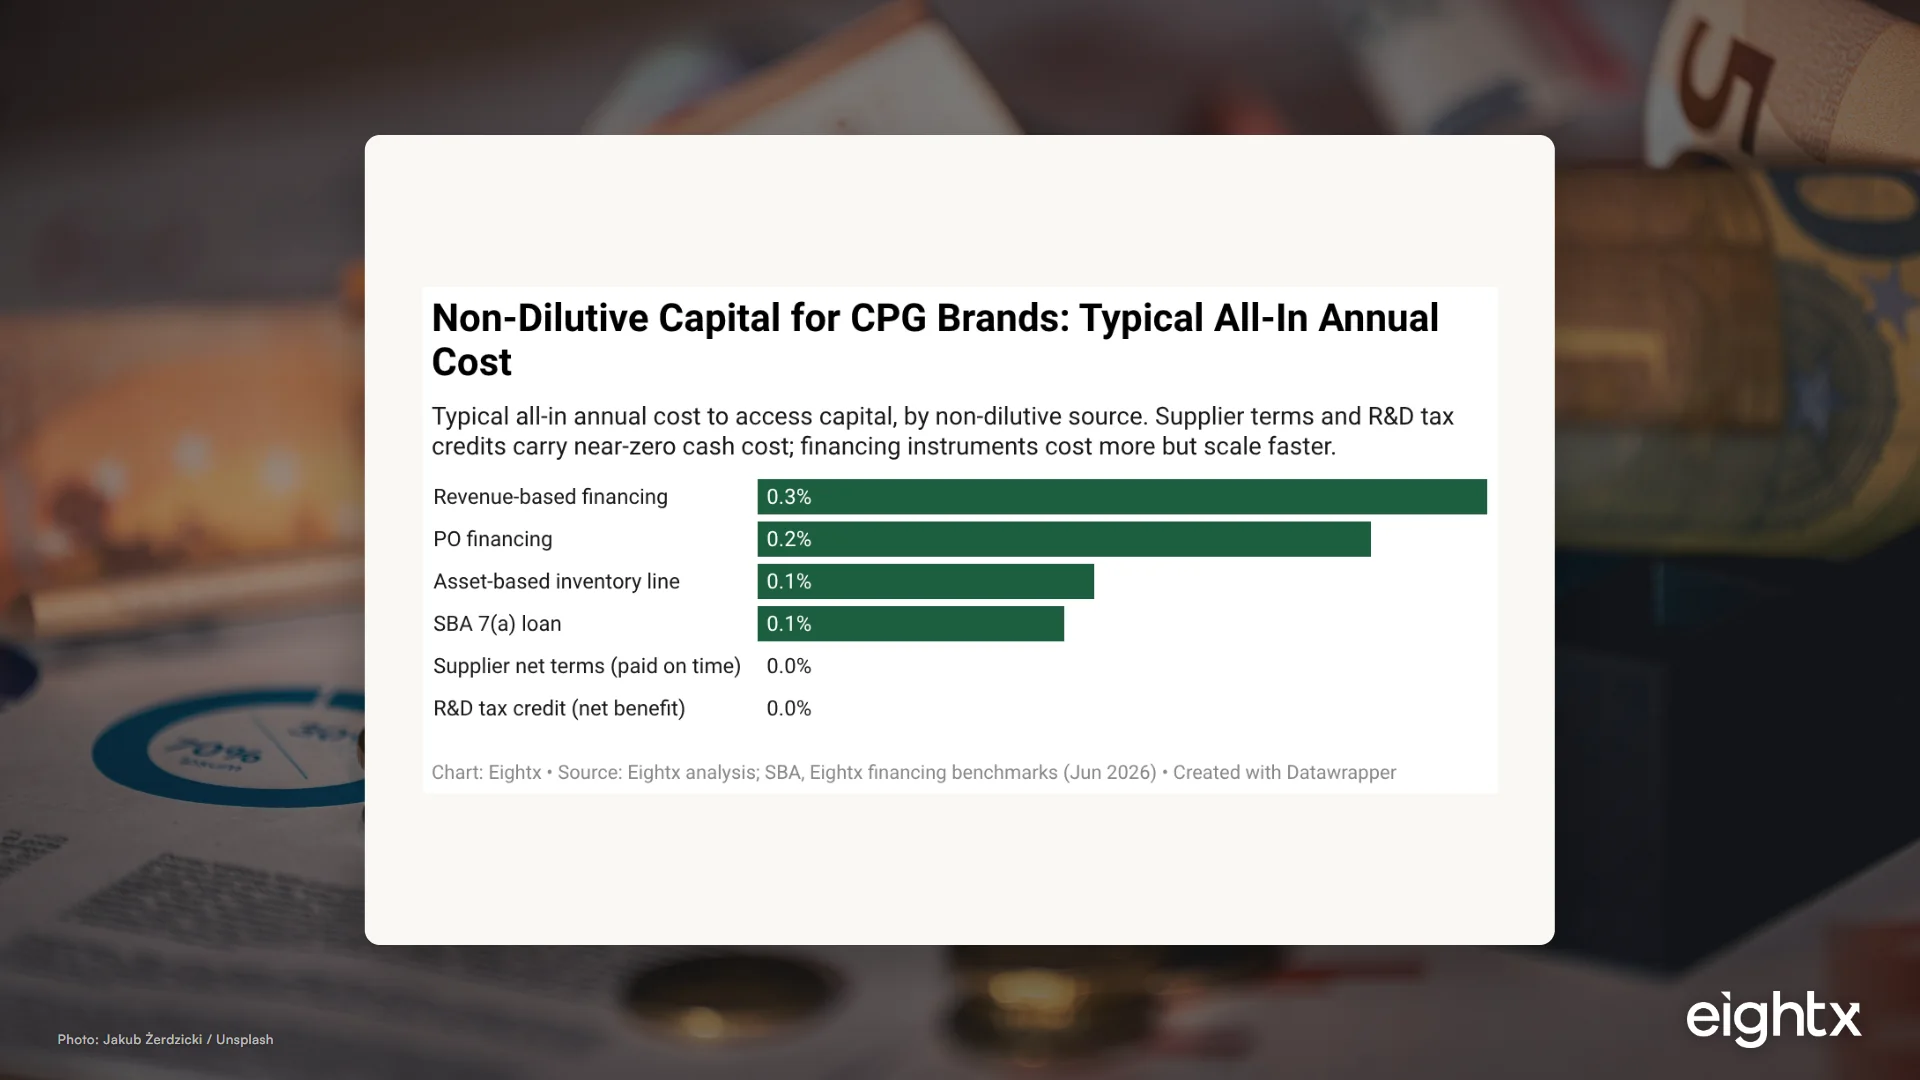
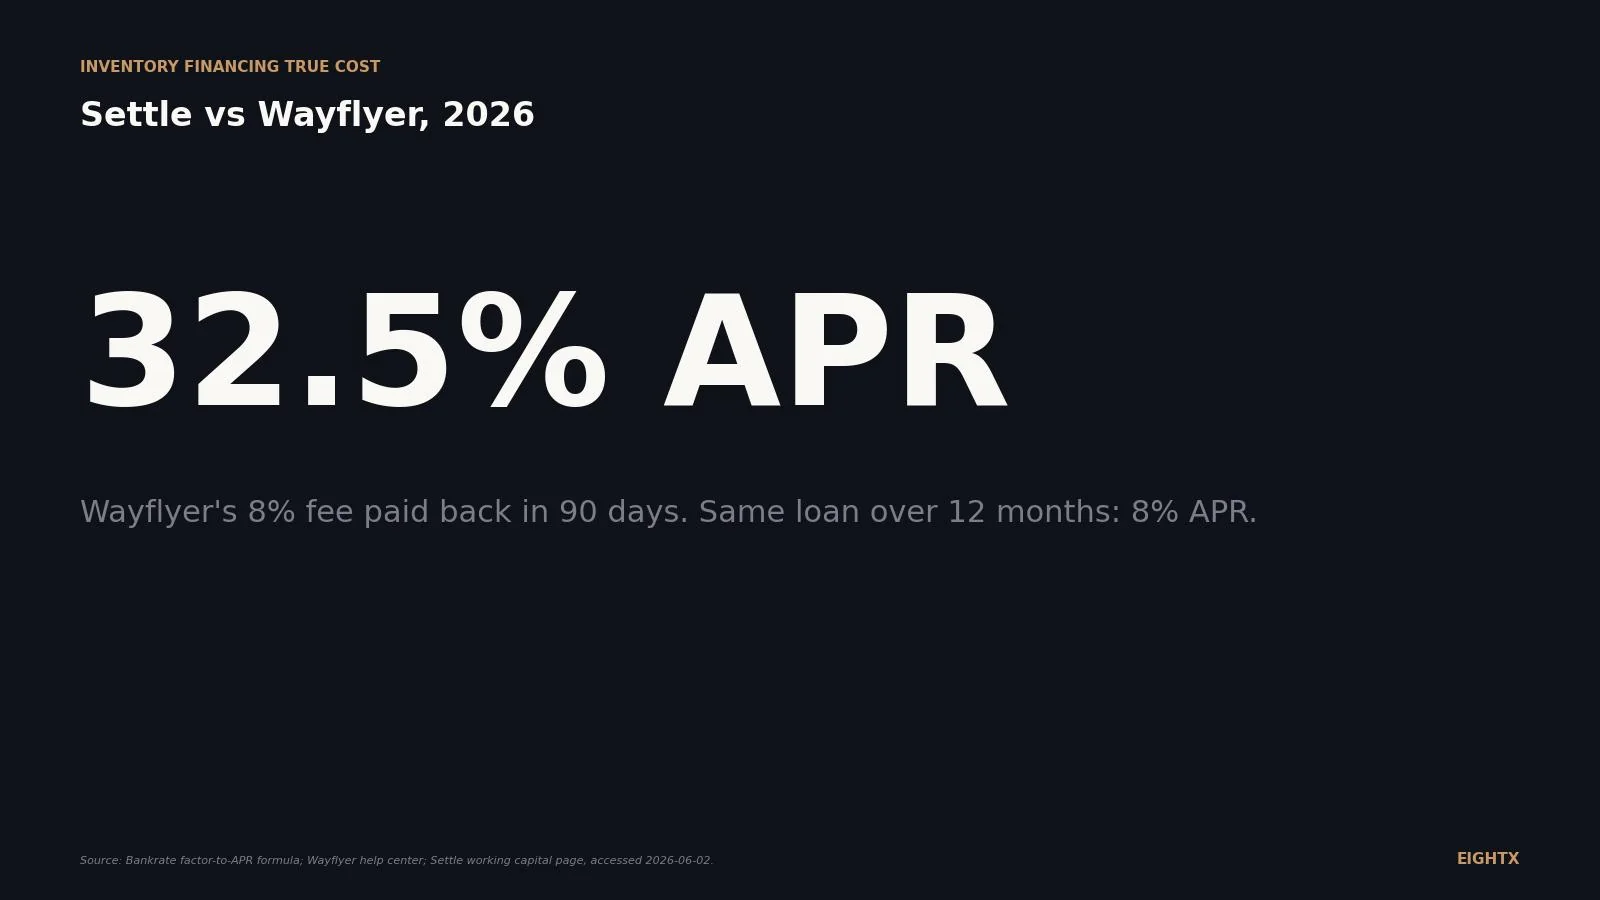
What $500k of inventory capital actually costs a $5M ecommerce brand over 12 months: Clearco 5-8% flat fee, Settle, and bank LOC modeled to effective APR.
The 15% referral fee is the starting bid. On a $40 FBA consumable in 2026, Amazon keeps roughly 39% before your COGS. Here is the full fee stack, priced out.
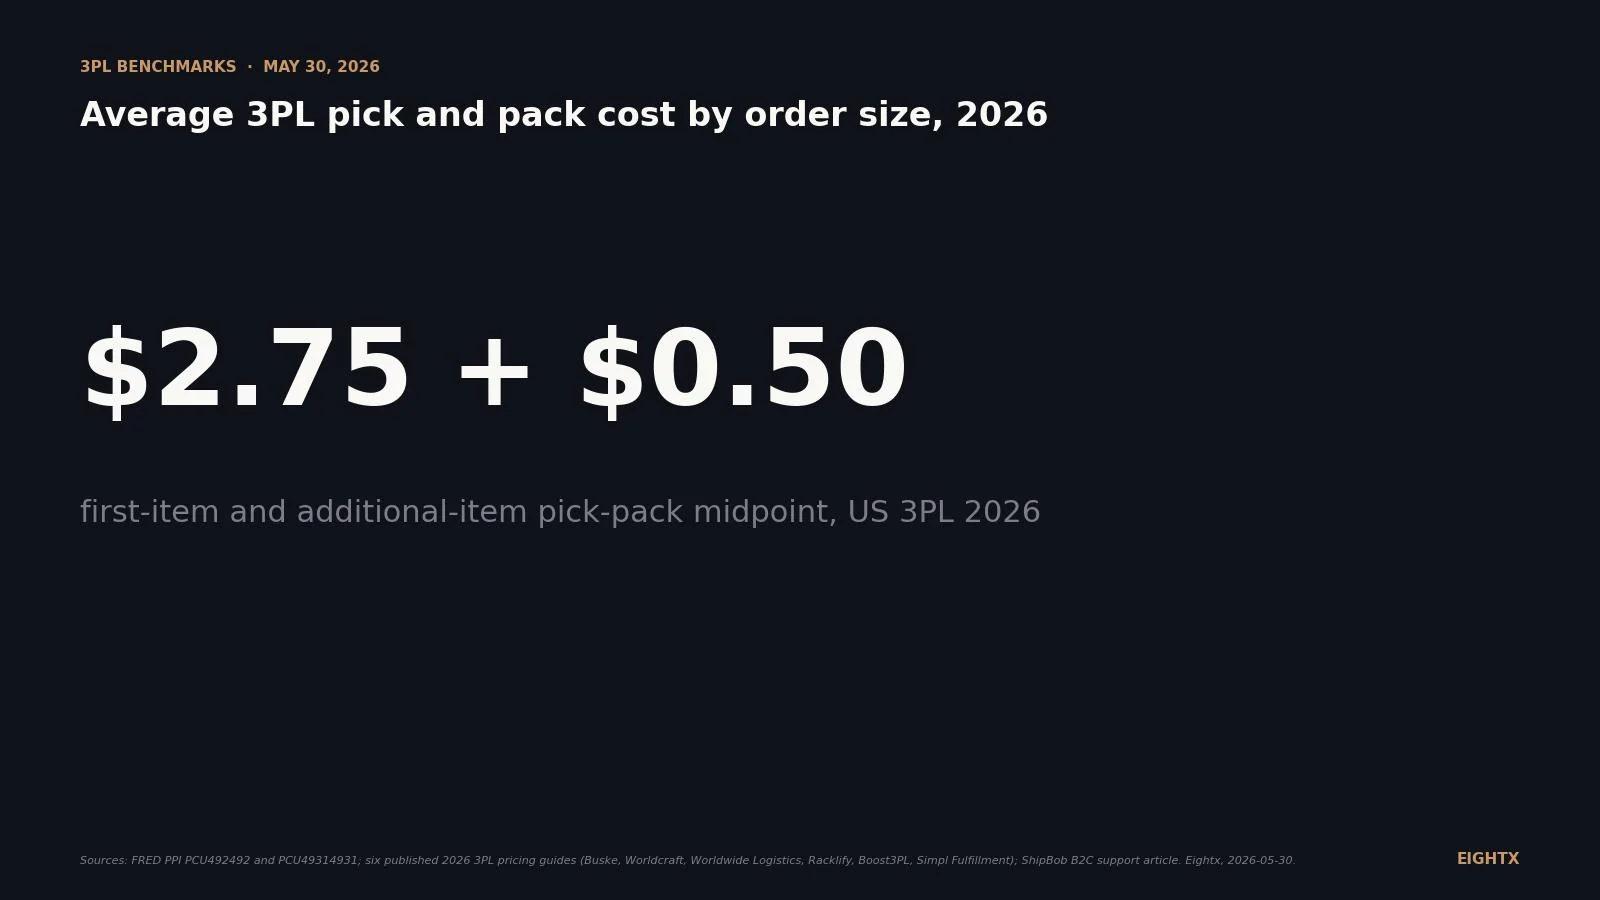
Pick-and-pack is only ~25% of your 3PL bill. Here's the full per-order cost model for 2026, every hidden fee benchmarked, plus a one-hour invoice audit.
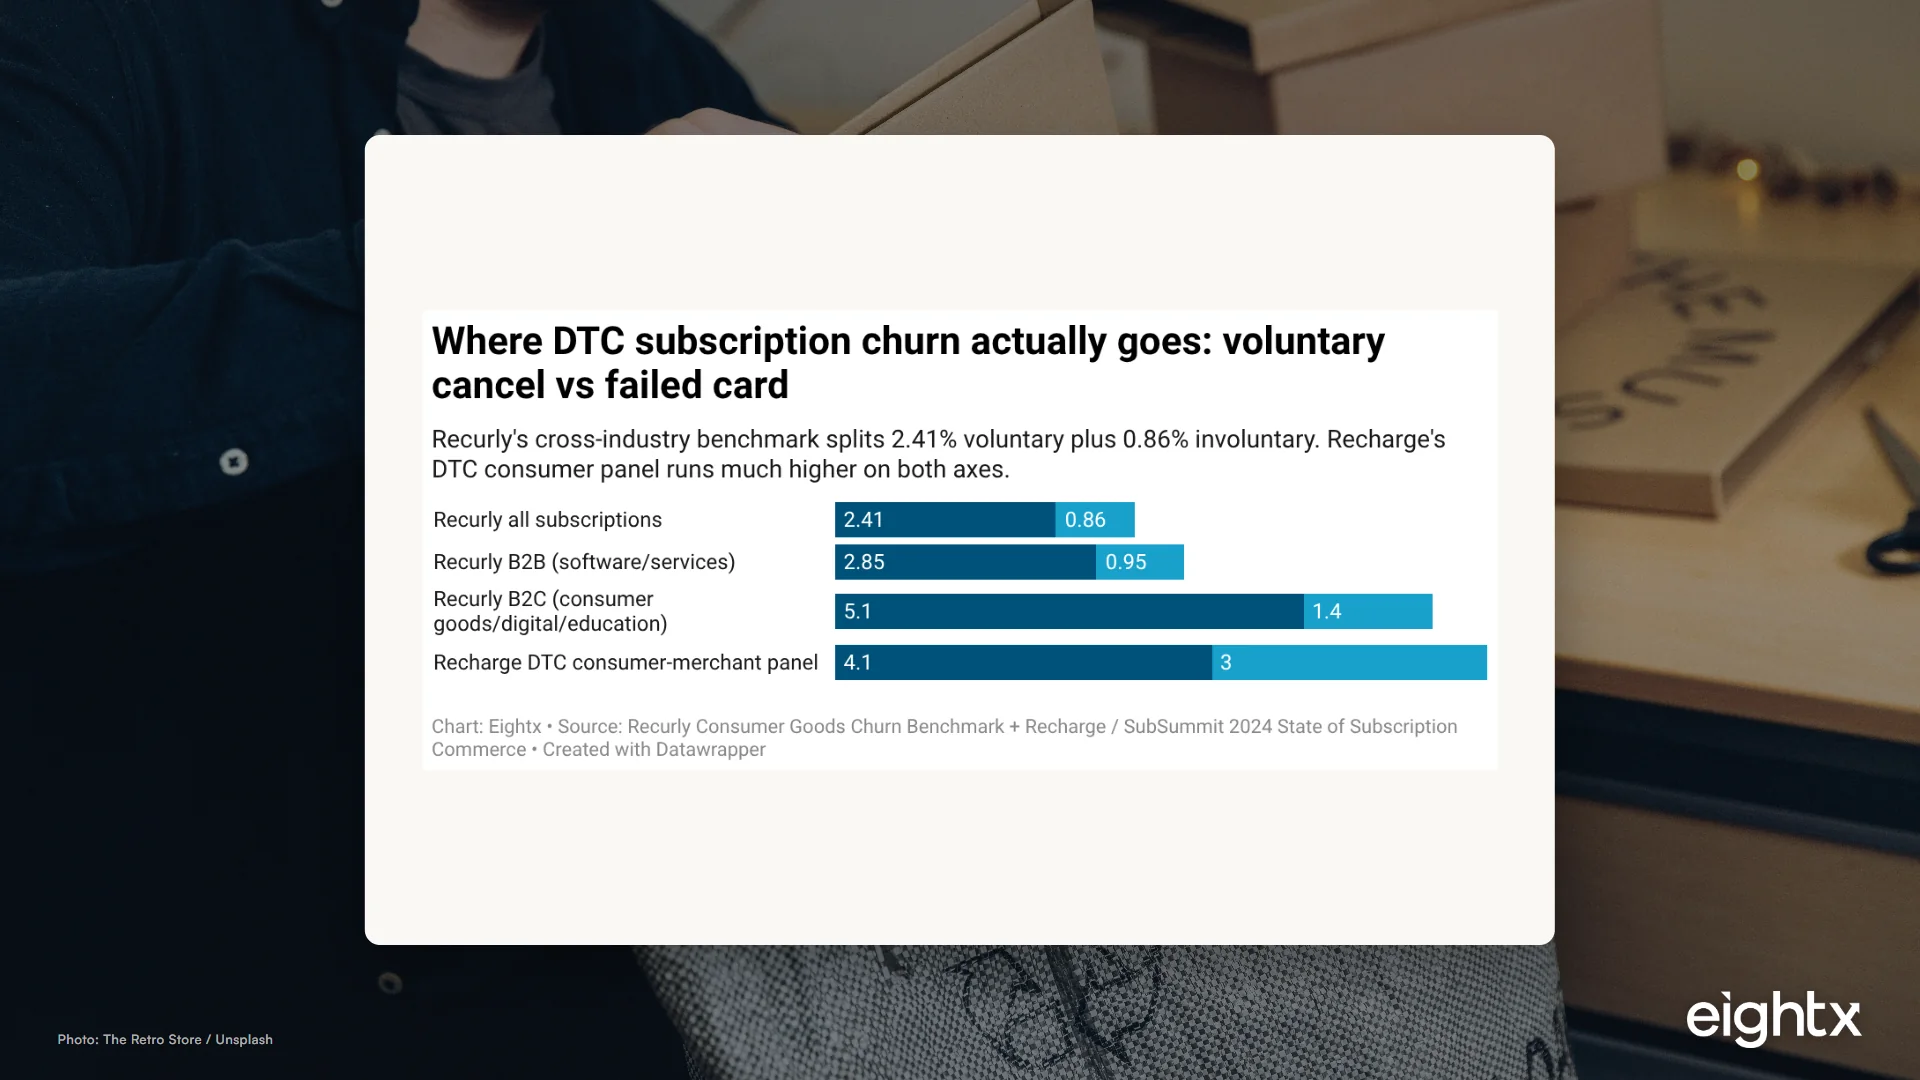
The Recharge line on your P&L reads as a tidy SaaS fee. Modeled correctly it runs 1.56% of GMV app-layer and 3.8-4.5% all-in, before the involuntary-churn leak nobody prices.
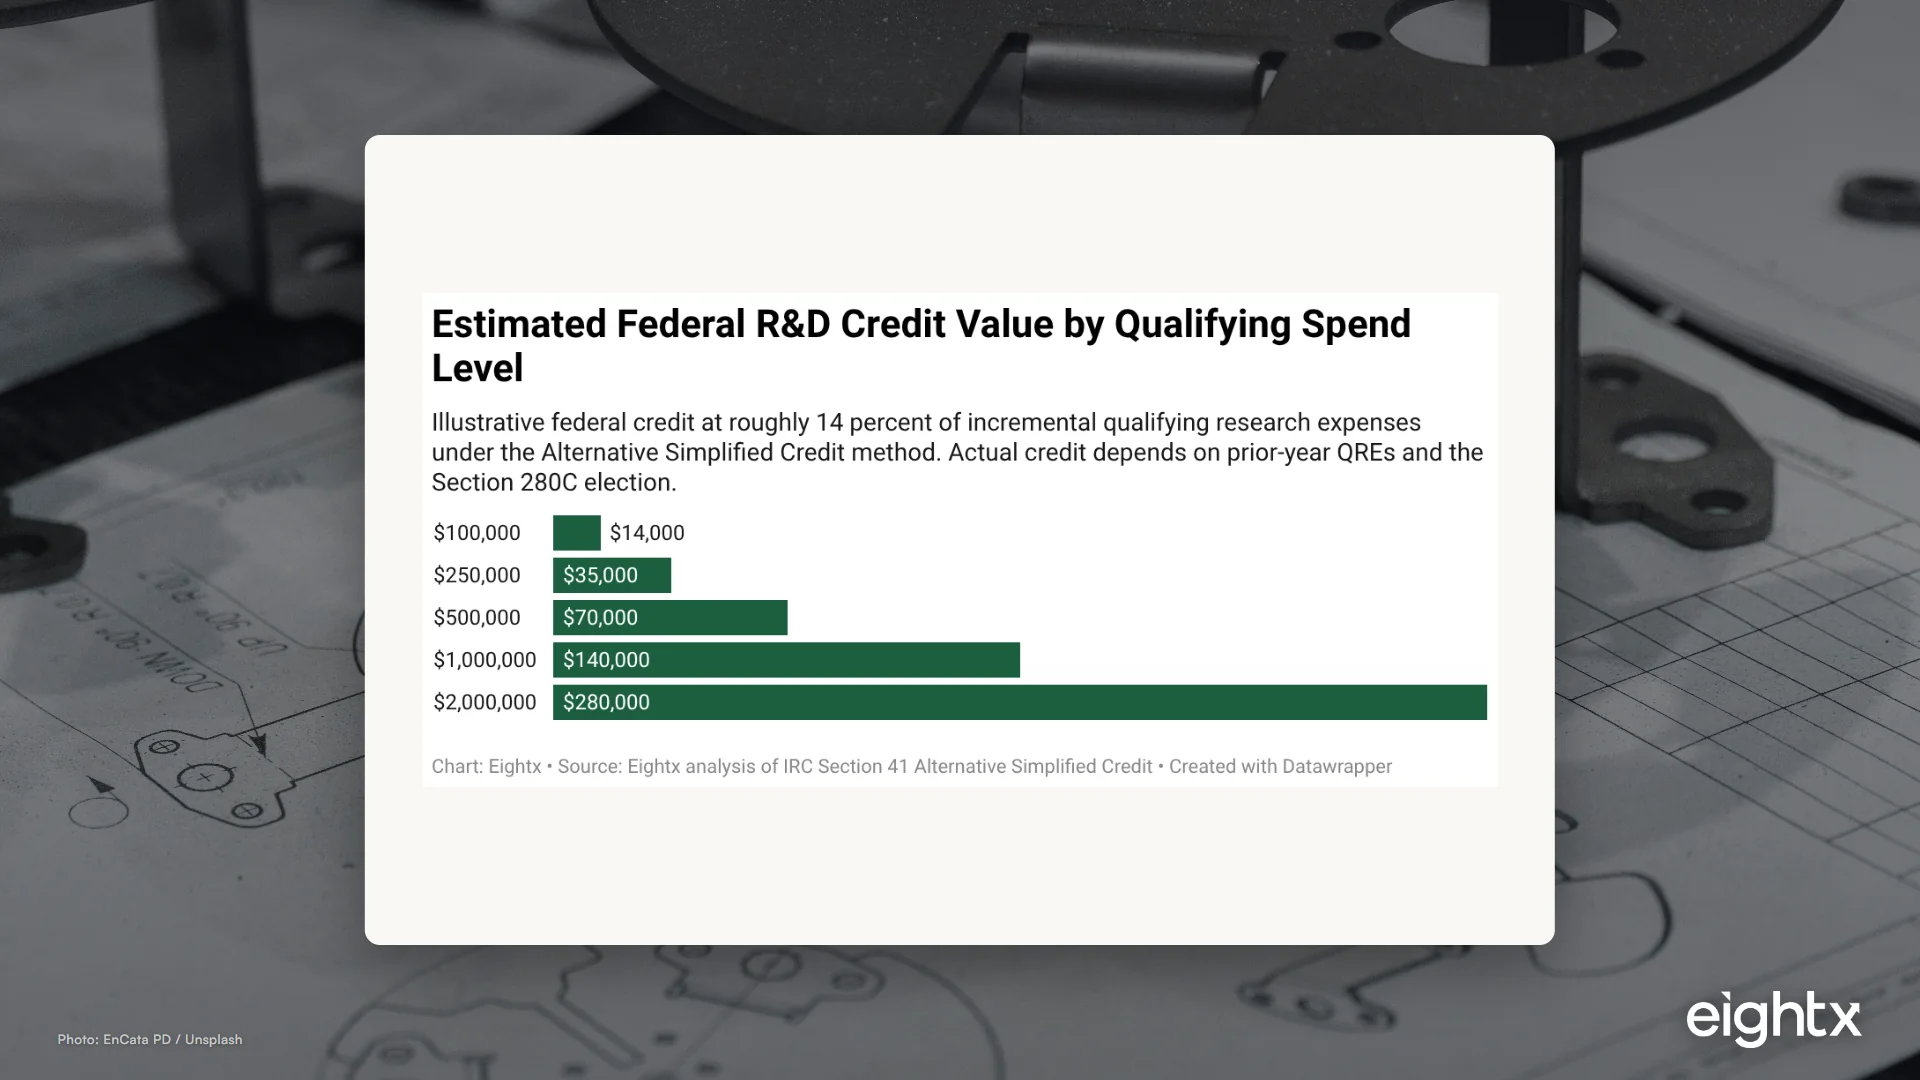
Most DTC founders write product and Shopify development off as an expense. IRC Section 41 turns $200K-$600K of that spend into a $15K-$40K federal R&D tax credit.
For an $8M-$12M DTC brand the Q4 buy is a ~$400K bet placed in August, before a single BFCM sale. A step-by-step sizing formula, cash timeline, and downside stress test.
Parker went bankrupt in May 2026. We model net annual cash-back for Ramp, Amex Business Gold, Capital One Spark, and Chase Ink on $720K of DTC card spend.
You signed at 15% of ad spend. Six out-of-SOW line items push the real number to ~25% at scope midpoint, 28-29% with active creative. True-cost breakdown for $200K/month brands.
Why profitable Q4 DTC brands hit their worst cash week in mid-January, what causes it, and the December 15 pre-mortem that turns it into a planned event.
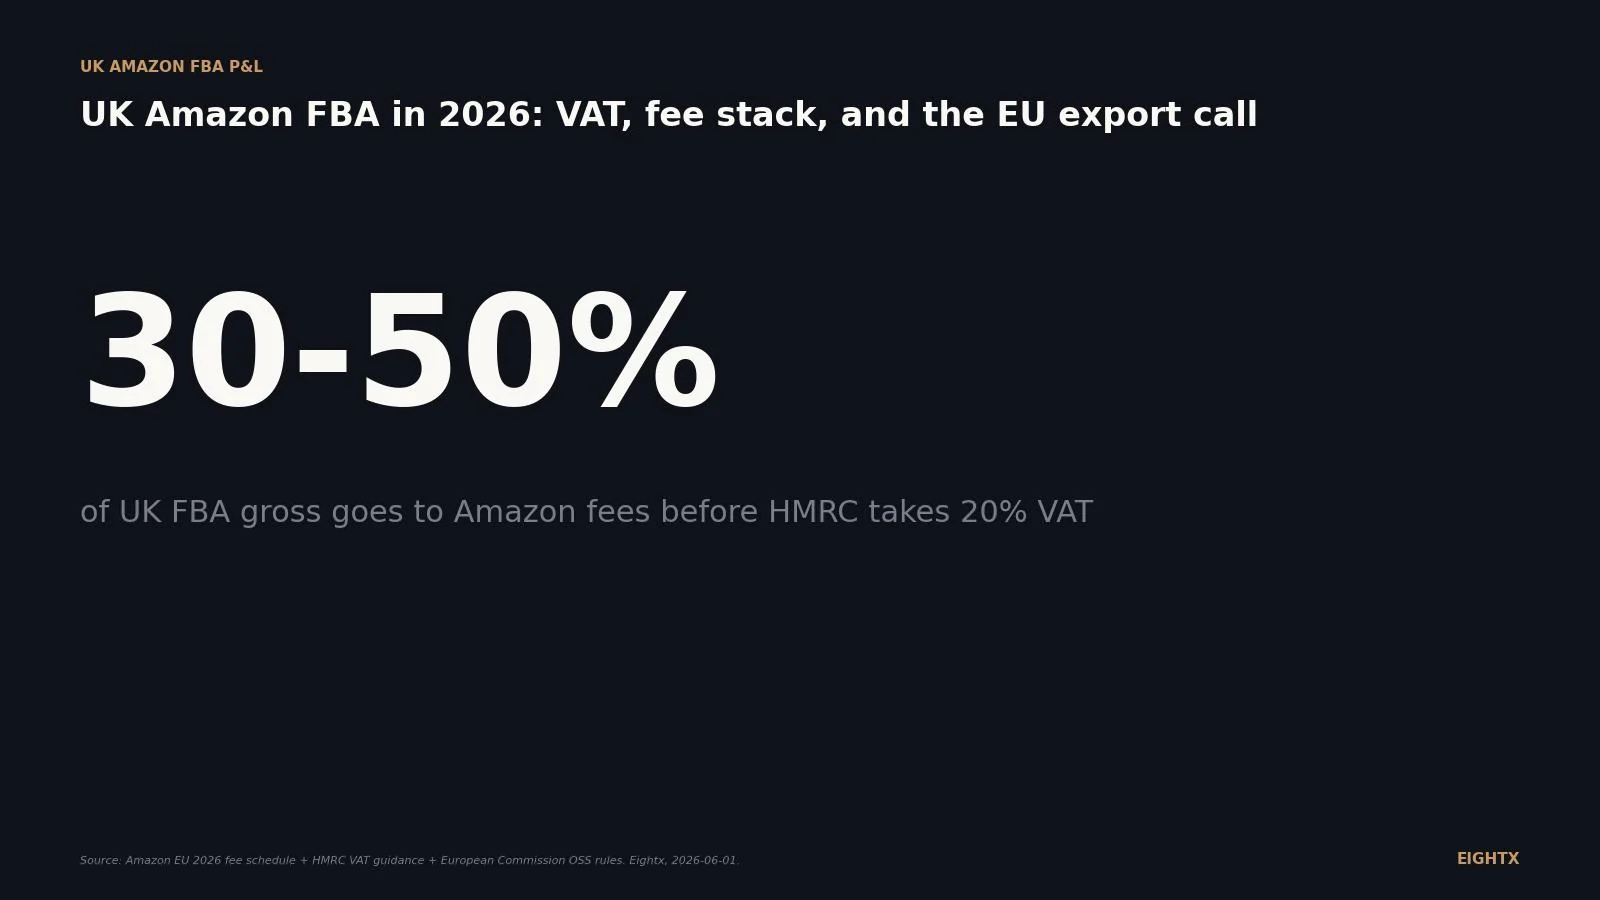
A $40 US product shipped DTC to the UK loses $20.70 a unit before a dollar of ad spend. The full 2026 cost stack: freight, duty, VAT, FX, returns, and the fix.
Median DTC gross margin is 56.6% (public 10-Ks), but the benchmark is not your target. Use a three-scenario worksheet to set a defensible number before you lock the budget.
Faire charges up to 25% on new-retailer first orders and 15% on reorders. Here is what adding wholesale does to a $2M DTC brand's contribution margin in year one.
The average Shopify brand ran a 28% BFCM discount without knowing if it was profitable. Here is the contribution-margin breakeven floor to calculate before Black Friday.
Back-to-school is a May-July cash-out event for a $4M-$8M apparel brand, not an August revenue event. The 90-120 day order-to-cash gap and how to size a facility.
At $8M on Shopify, A2X runs $79-$115/mo, Finaloop Core $895-$995/mo, and manual reconciliation $600-$1,200/mo in labour. The fully-loaded cost of each path.
Loop's fee is $155-$340/month, but the all-in returns bill at 500 returns/month runs $6,530-$11,915. The correct P&L split, and the exchange rate that makes Loop pay off.
NIQ completed its acquisition of Flywheel's China and SEA e-commerce data business on July 1, 2026. The CFO case for digital-shelf metrics as revenue signals.
TikTok cut 450+ Tokopedia jobs while part-owner GoTo shrugged it off. The CFO read on channel concentration and why one marketplace can't be your foundation.
The EU scrapped its 150-euro duty exemption and added a 3-euro parcel fee on July 1, 2026. What it does to Shein/Temu pricing and your EU landed cost.
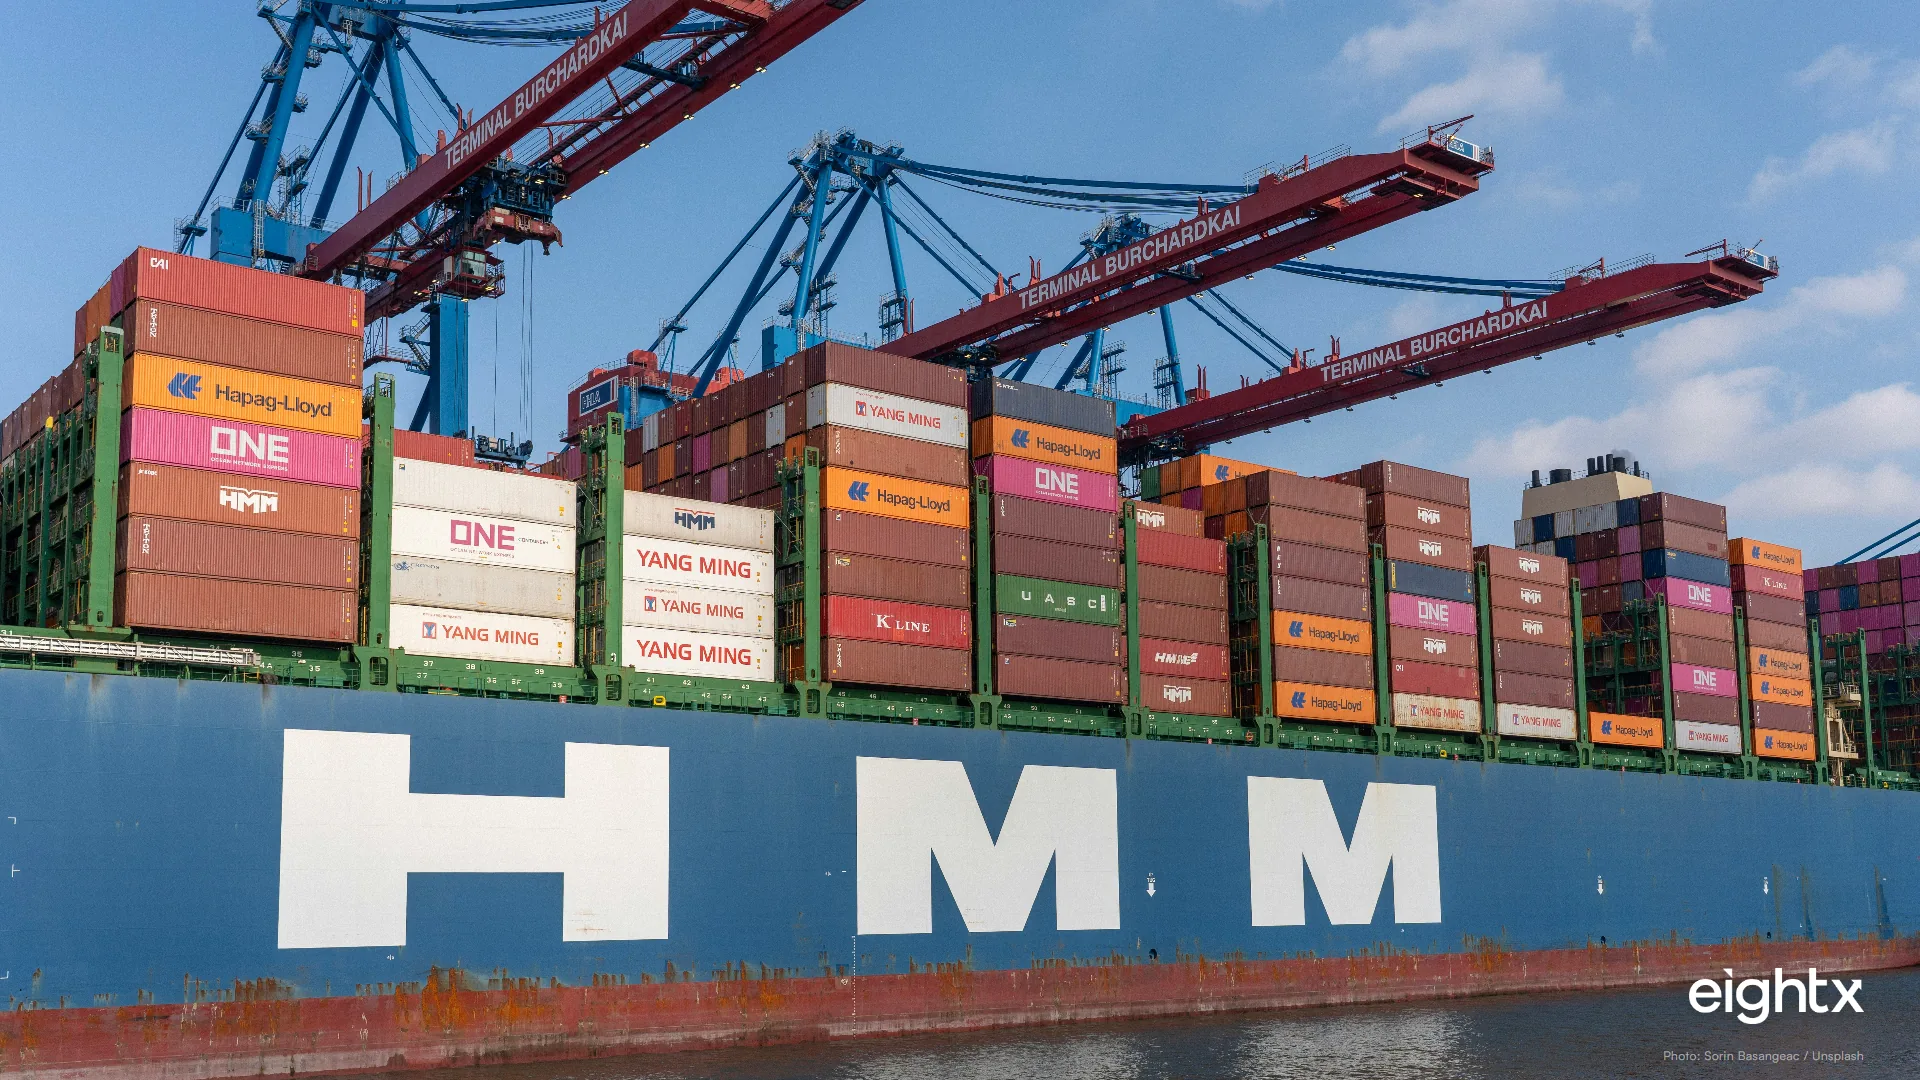
Hapag-Lloyd added a $1,000 per container GRI on India and Pakistan to North America lanes, effective Aug 1, 2026. The per-unit landed cost math.
Under $10M EBITDA, a management buyout usually bids 15-30% below a strategic sale. At $5M EBITDA that gap can top $5M in day-one cash. Here's how to model it.
Solo Brands grew revenue 28% through acquisitions while gross margin fell 6.8 points. The SEC filings show the three leaks that did it and what to check before an LOI.
When a 20% equity roll beats full cash in a DTC brand sale, and when it doesn't. Four inputs founders underweight: exit multiple, hold period, MIP, cap-table position.
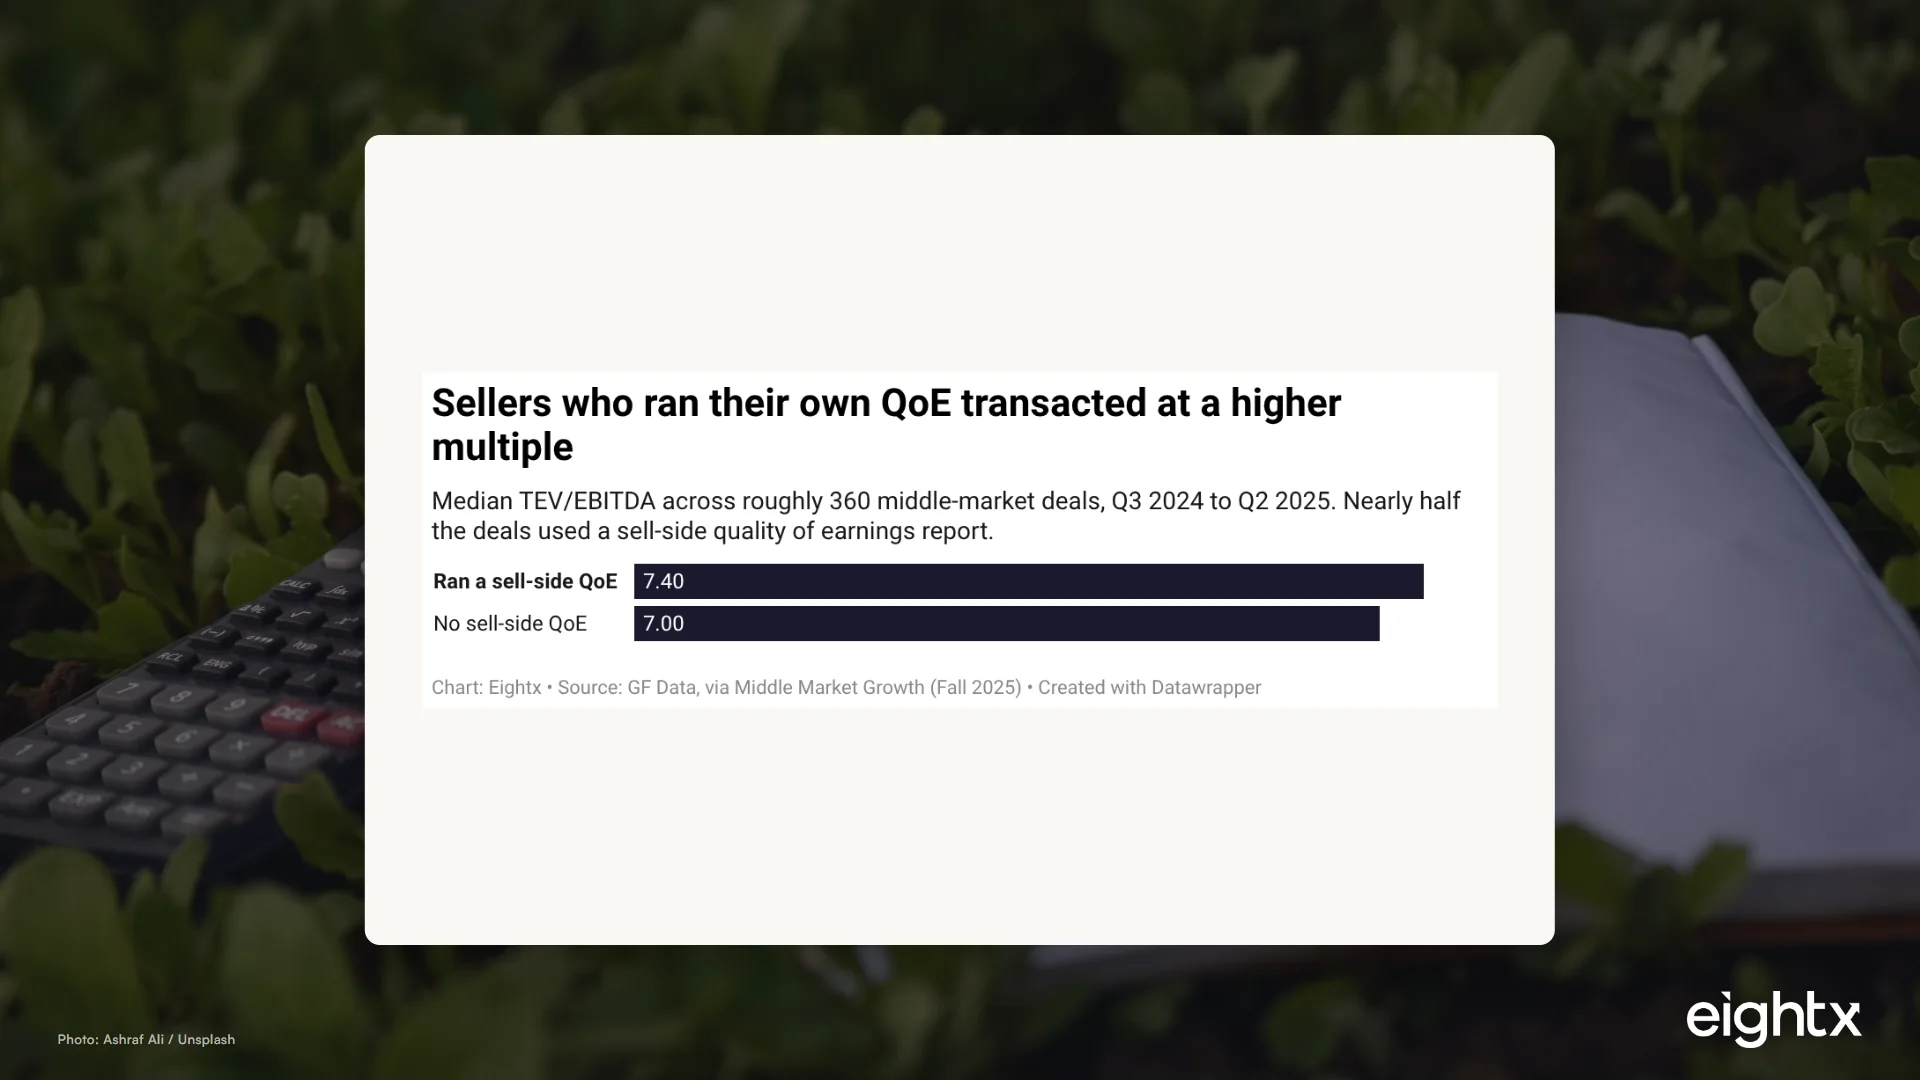
A DTC quality-of-earnings report costs $25K to $75K for a $5M to $30M deal. What it does, who pays, and why skipping the sell-side version hands buyers the pen.
A $5M DTC exit taxed as long-term capital gains nets ~$3.81M. The same price sold as a C-corp asset deal can net $800K+ less. Here is where ordinary income sneaks in.
Between 25% and 35% of signed LOIs in the lower middle market never close. The four failure modes that kill them, the data behind each, and how to prevent them.
Amazon FBA fees run 13% to 47% of revenue depending on category and price. The 2026 benchmark by category, plus the three levers that move your fee rate.
Beauty ecommerce brands cleared 14.9x EV/EBITDA in 2025 while apparel sat near 8x and food fell to 5.8x. Acquisition multiples by vertical, and what moves yours.
Dead stock runs 20-30% of inventory in apparel but 3-7% in beauty. 2025 benchmarks for dead stock, write-off, and markdown rates across eight retail verticals.
On a $50 order, Shopify keeps about 36% contribution margin to Amazon FBA's 29%. But below roughly $45-50 AOV, Amazon wins. The SKU-level math for 2026.
The month-by-month exit prep playbook a CFO builds for DTC founders: clean the P&L, kill concentration risk, and get diligence-ready before the LOI, worth 1-3 EBITDA turns.
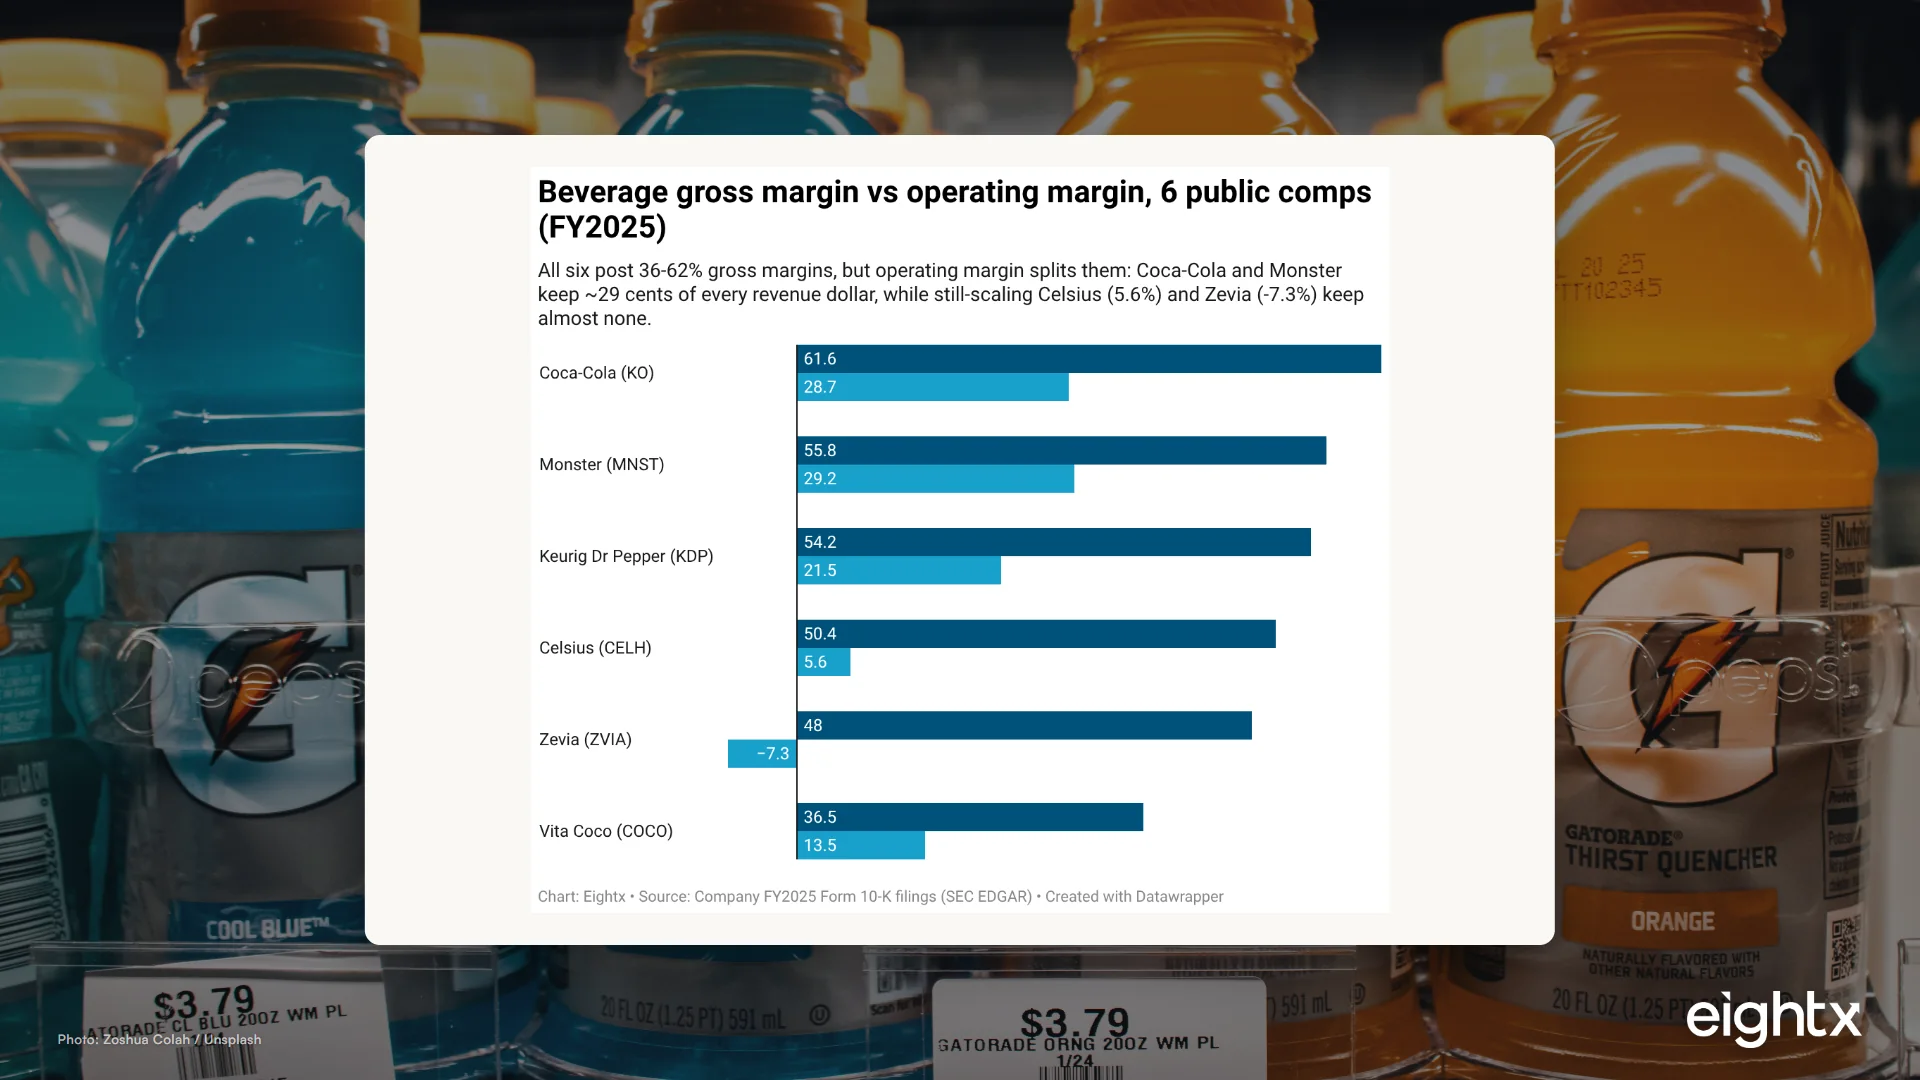
Celsius gross margin went from 41.4% to 50.2% in two years after the 2022 PepsiCo deal. Here is what actually drove it, and the cost risk the same deal embedded.
A CRO pro's 25% conversion lift from dropping all-caps headlines cuts effective CAC about 20% on the same spend. The math every DTC CFO should run first.
Walmart is wiring Google Gemini into checkout to lift marketplace conversion. The CFO read: model channel contribution margin before you chase it.
Homeplus was pushed into bankruptcy on July 3, 2026 by fixed leases and labor it could not shrink. The operating-leverage lesson for DTC founders.
Ulta and NielsenIQ found influencers barely move Gen Alpha beauty buyers. Parents and in-store trust do. Here is what that means for your CAC model.
Port congestion has 11% of the global container fleet stuck at berth and freight rates spiking. The CFO move: rebuild landed cost, don't panic-order.
Moving suppliers from net-30 to net-60 frees one full month of COGS at 0% cost. The cash conversion math, the DPO benchmarks, and the exact ask script.
The exact formula to size a refund-and-chargeback reserve before returns, disputes and Stripe fees settle your profitable month at negative 30-60 days later.
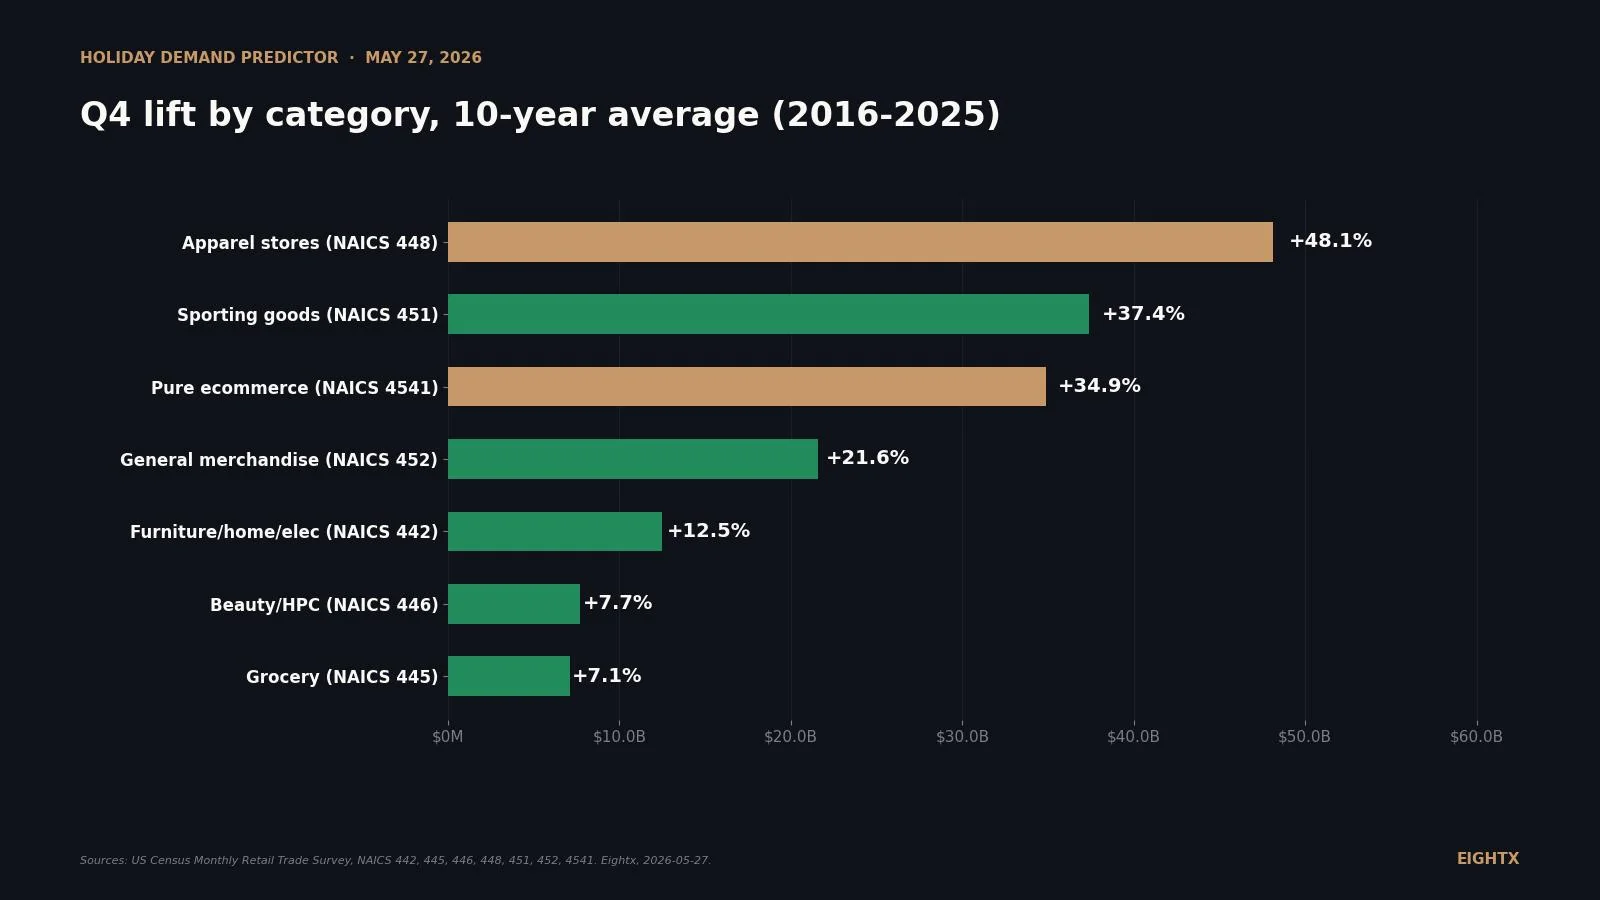
Jewelry earns 34-36% of annual revenue in Q4, toys 30-33%, consumables and beauty 24-27%. Public-company holiday benchmarks every operator needs before October.
Month-by-month cash map that shows your Q4 inventory gap before August ends. Secure capital at 8-12% instead of a 60-350% emergency MCA.
A $100K owner-comp gap becomes $400K to $600K of enterprise value at exit. The math, the SDE vs EBITDA rule, and the documentation buyers demand.
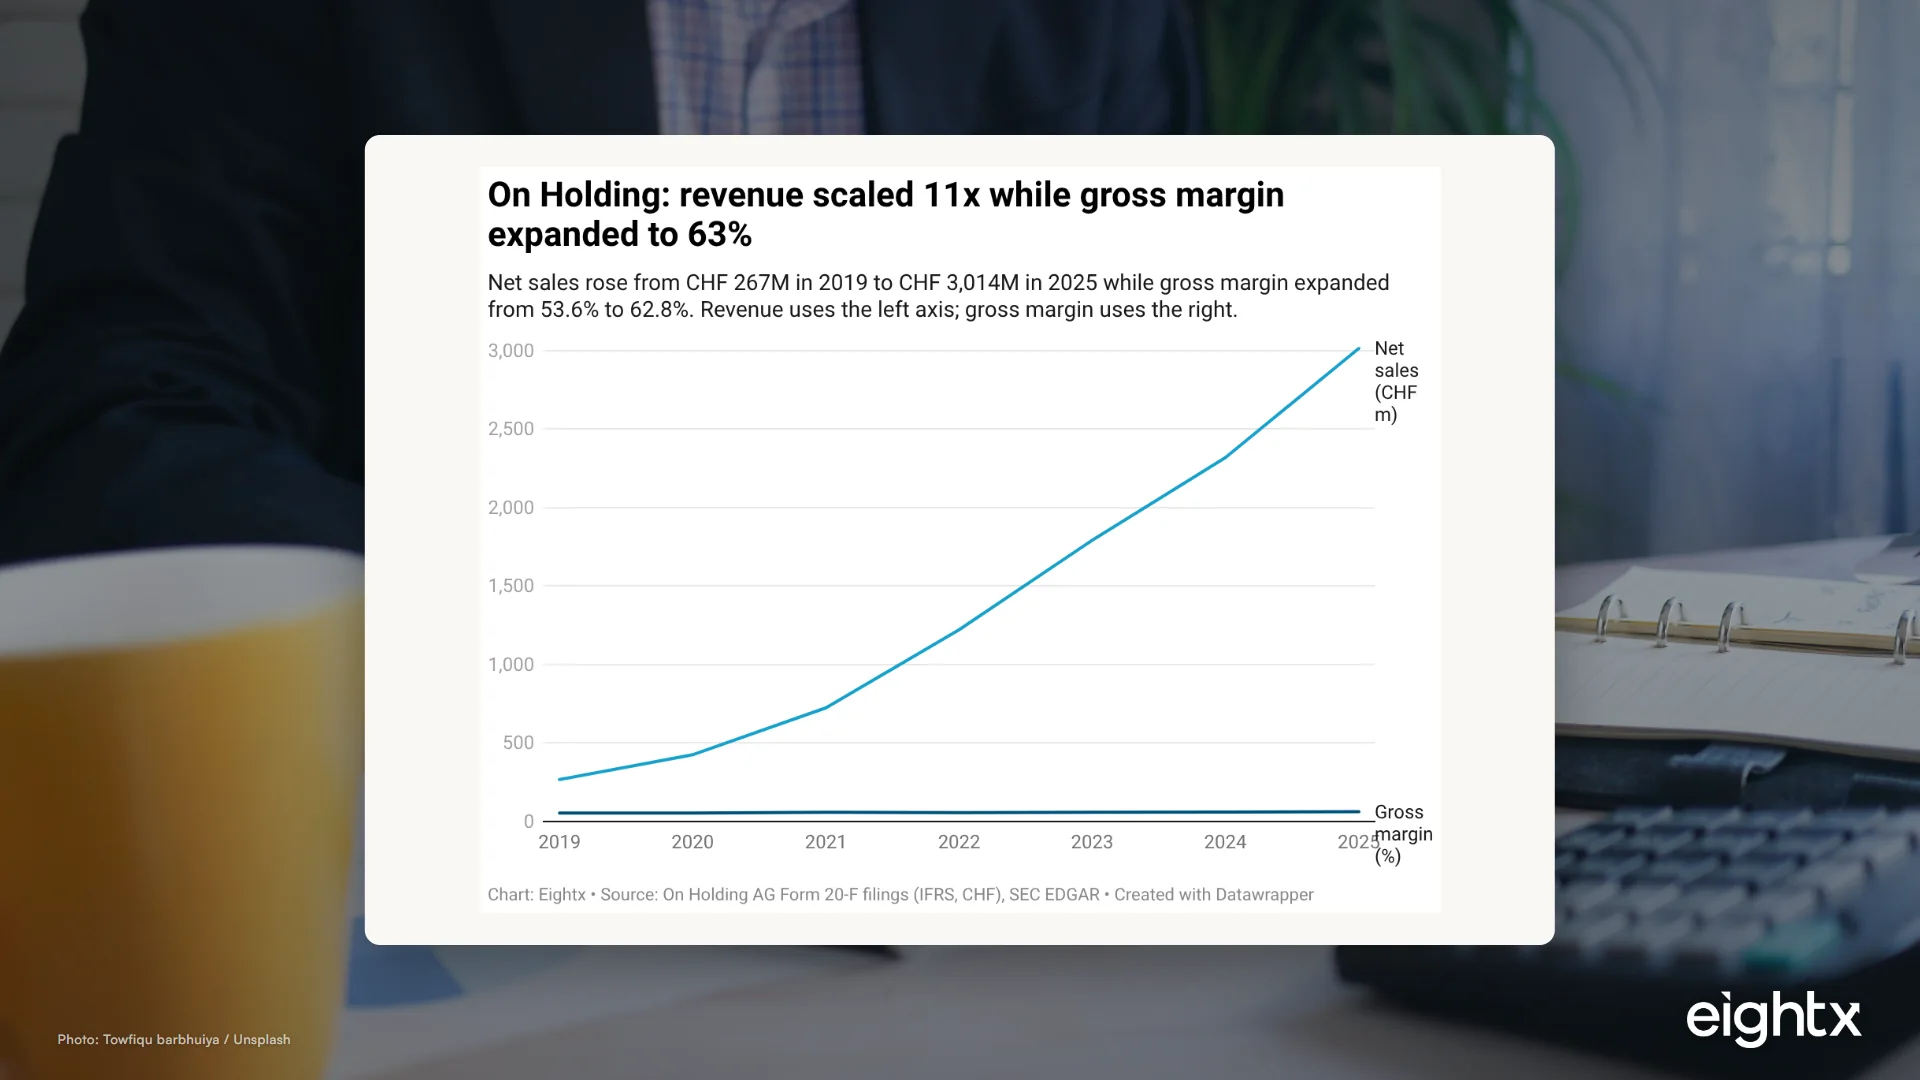
On Holding lifted gross margin from 54% to 63% in six years without a price increase. Its SEC 20-F names exactly two levers, and both are copyable by any premium brand.
Olaplex's gross margin fell from 79.2% to 69.2% between 2021 and 2024. The 10-K names the cause: a supply shock in 2022, then a distributor destock in 2023.
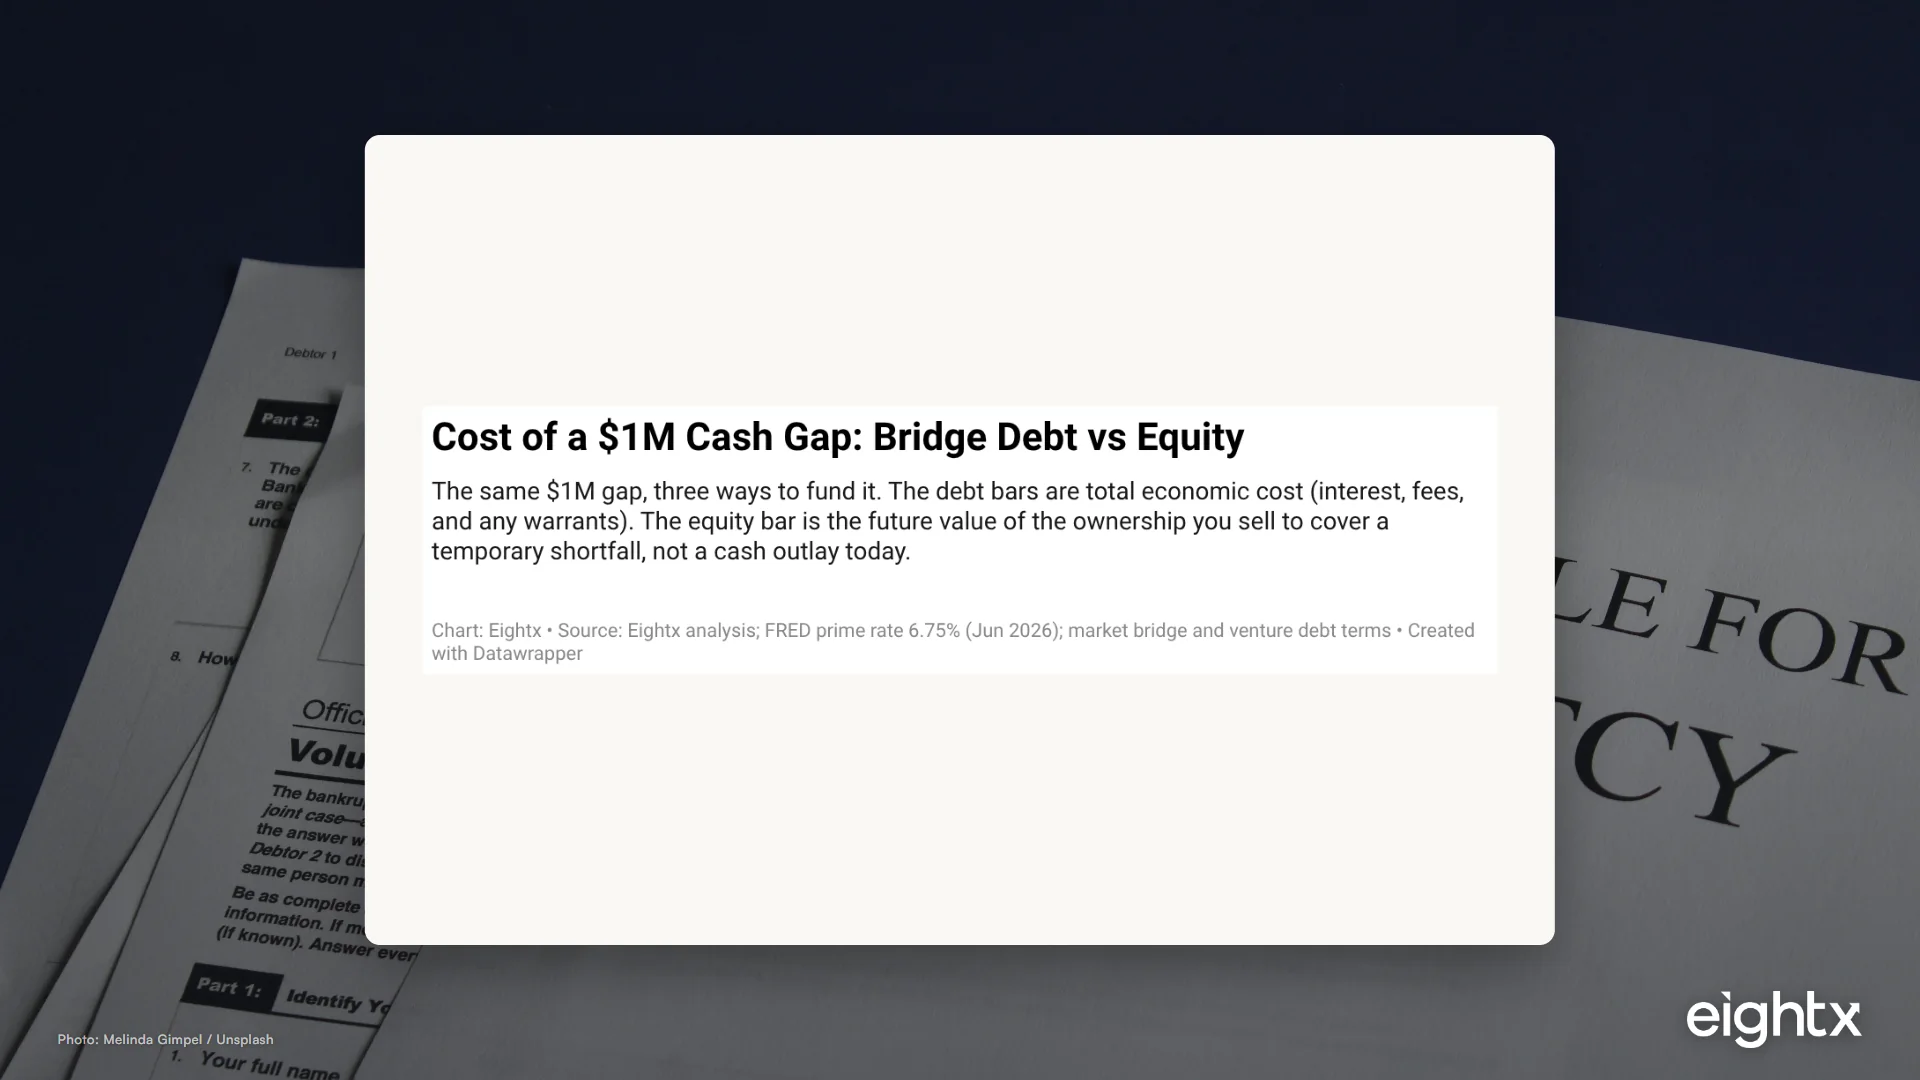
Holding a $500k line of credit unused costs about $1,875 a year. Drawing $500k via merchant cash advance in an emergency costs $125k to $250k. Here is the timing math.
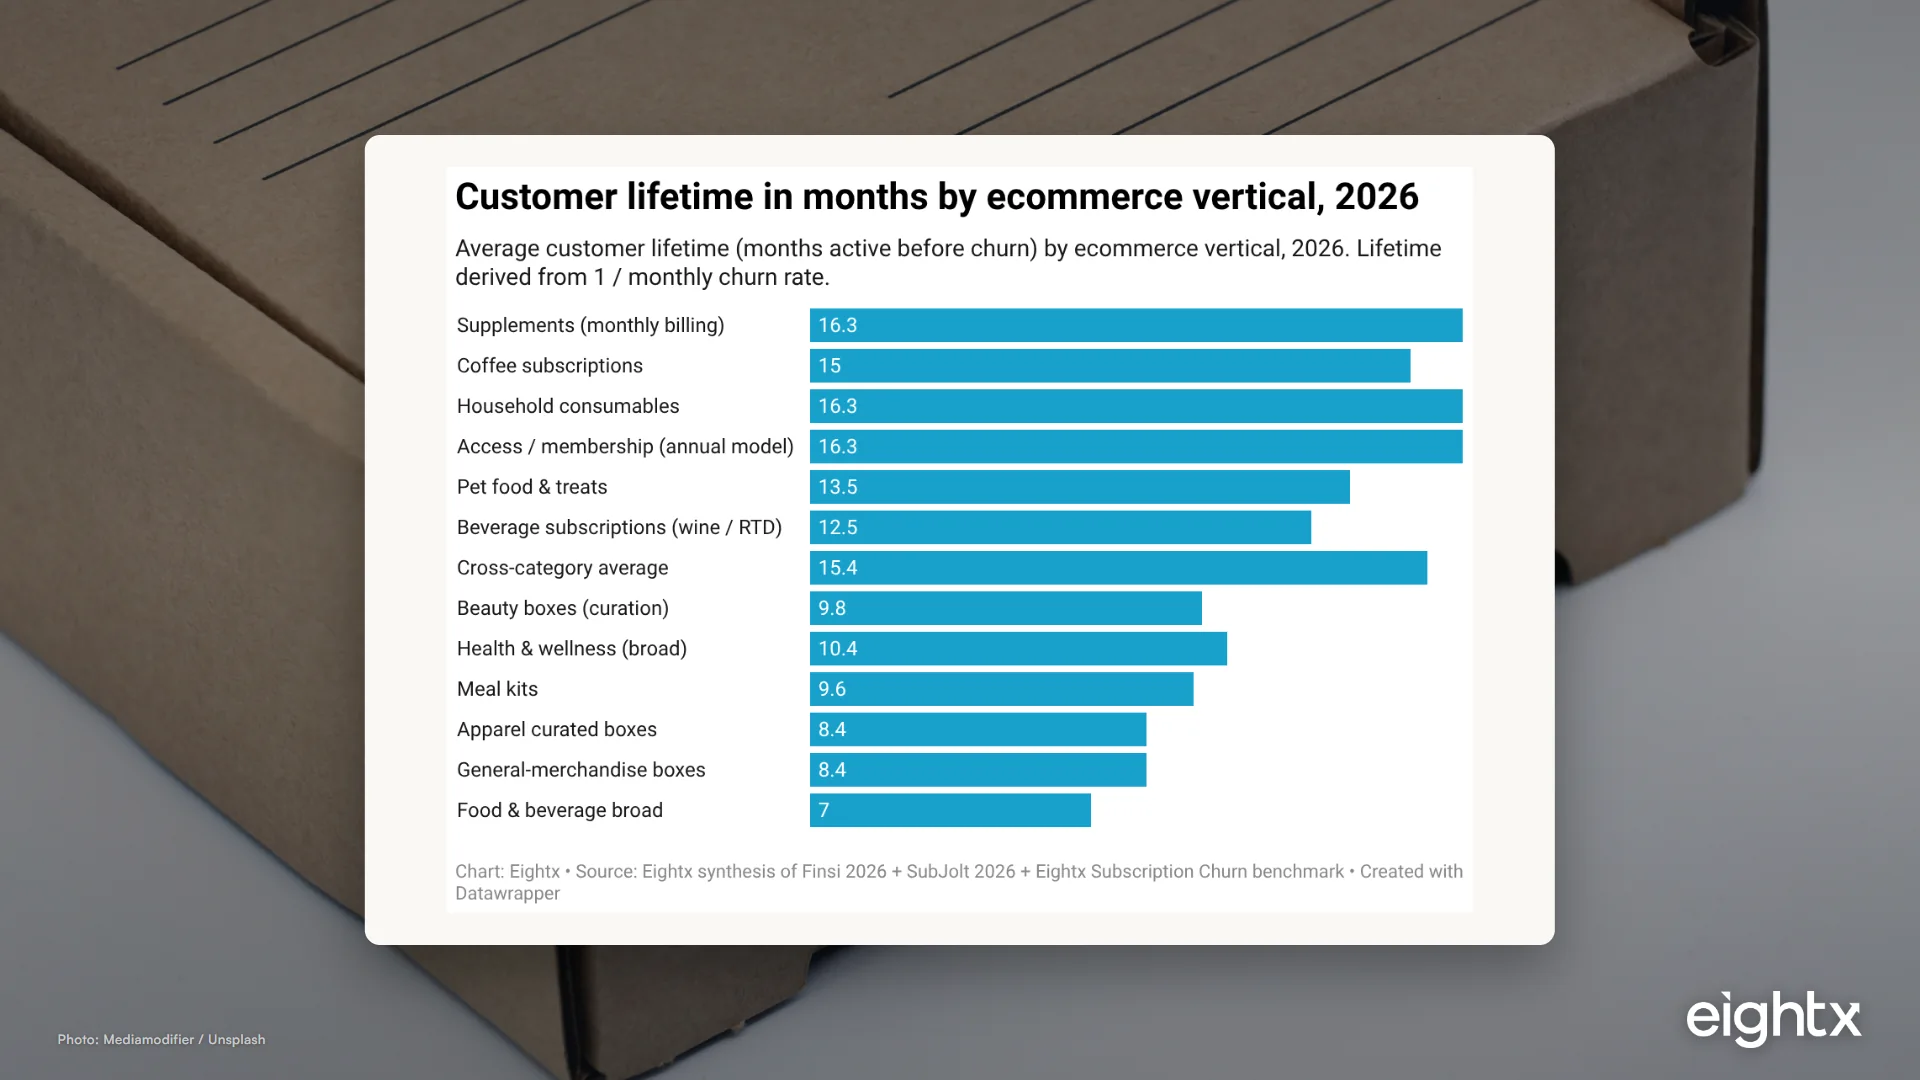
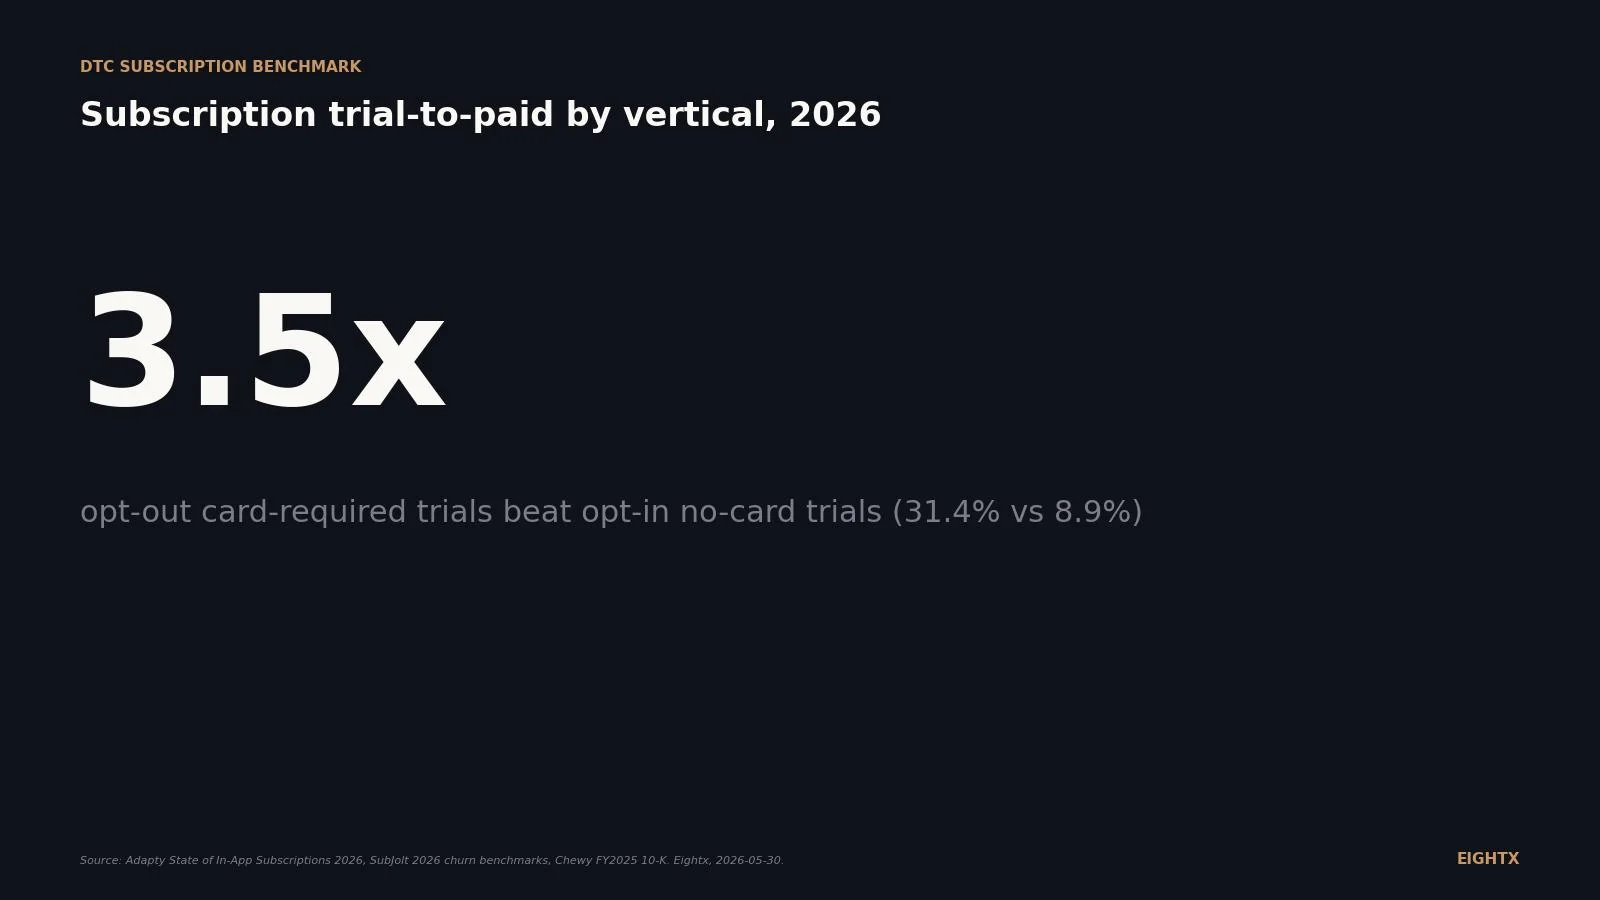
Coffee subscription churn runs 5 to 10% monthly, with 28% canceling in 90 days. The 2026 benchmark, LTV math, and the pause fix that lifts retention 22%.
Run the stress test before the bad month: divide fixed costs by contribution margin, compare to 70% of average revenue. If break-even is higher, you have 60-90 days.
Cash conversion cycle benchmarks by DTC vertical, from 10-K data. Beauty runs 130+ days, CPG under 30. See how your inventory and supplier terms compare.
Asset sale vs stock sale on a $5M DTC exit: the federal tax bills land within $12K, but the buyer's lost step-up drives a meaningful price gap. How to structure it.
Square launched ChatGPT and Claude integrations so AI agents can discover and check out with sellers. The CFO read on agentic commerce as a new channel.
Stitch Fix's Vision AI now generates images of clients wearing recommended outfits. With AI image cost near zero, the real apparel margin lever is returns.
Target Plus GMV rose ~60% as it added Forever 21, Clarks and more, chasing $5B by 2030. The CFO read on marketplace margin, fees and customer ownership.
June 2026 payrolls rose just 57,000 and leisure and hospitality shed 61,000. The CFO read on what a cooling labor market does to your Q3 demand plan.
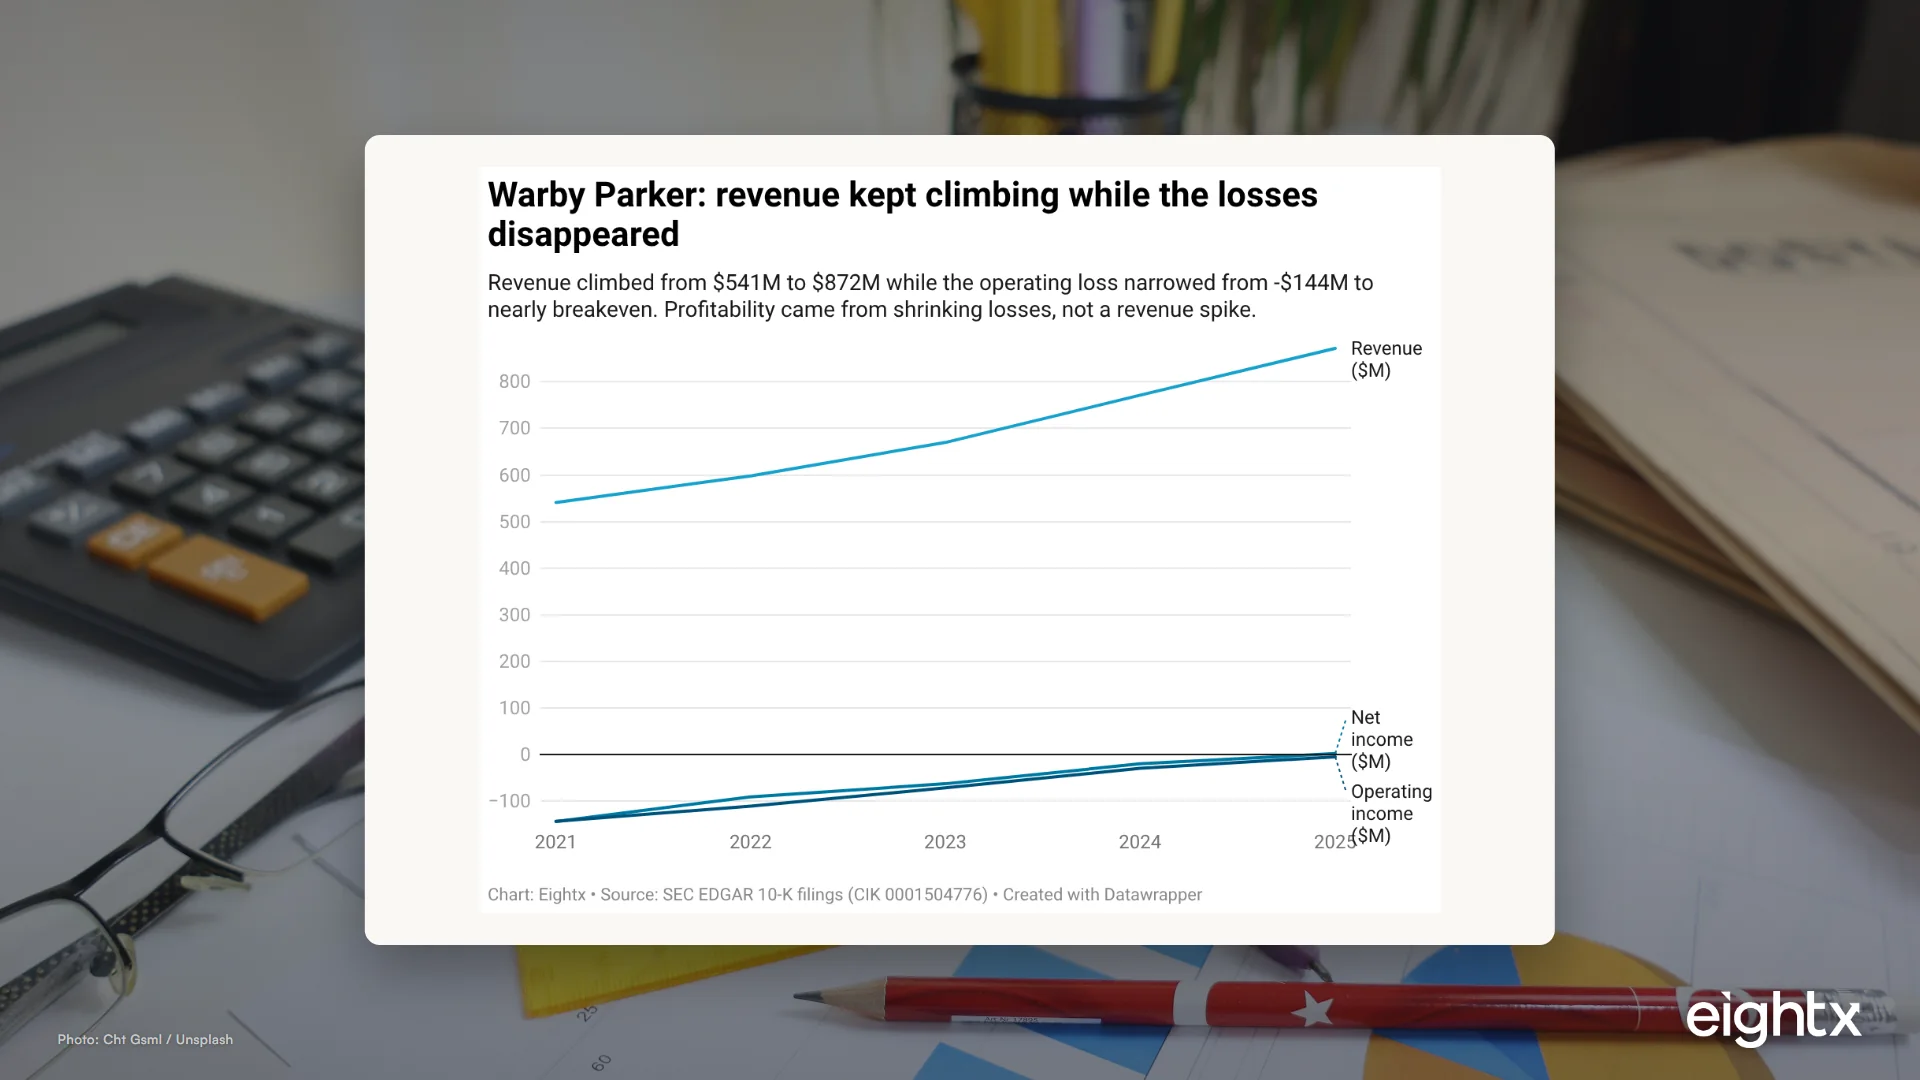
Warby Parker's stores drove all its growth, yet gross margin fell from 58.8% to 54.0% as the fleet doubled. What the 10-K reveals before you sign your first lease.
At midpoint (MER 4) a $40 DTC order is roughly break-even. Favorable operators (MER 5, lean COGS) land $2 to $6 positive. Line-by-line teardown.
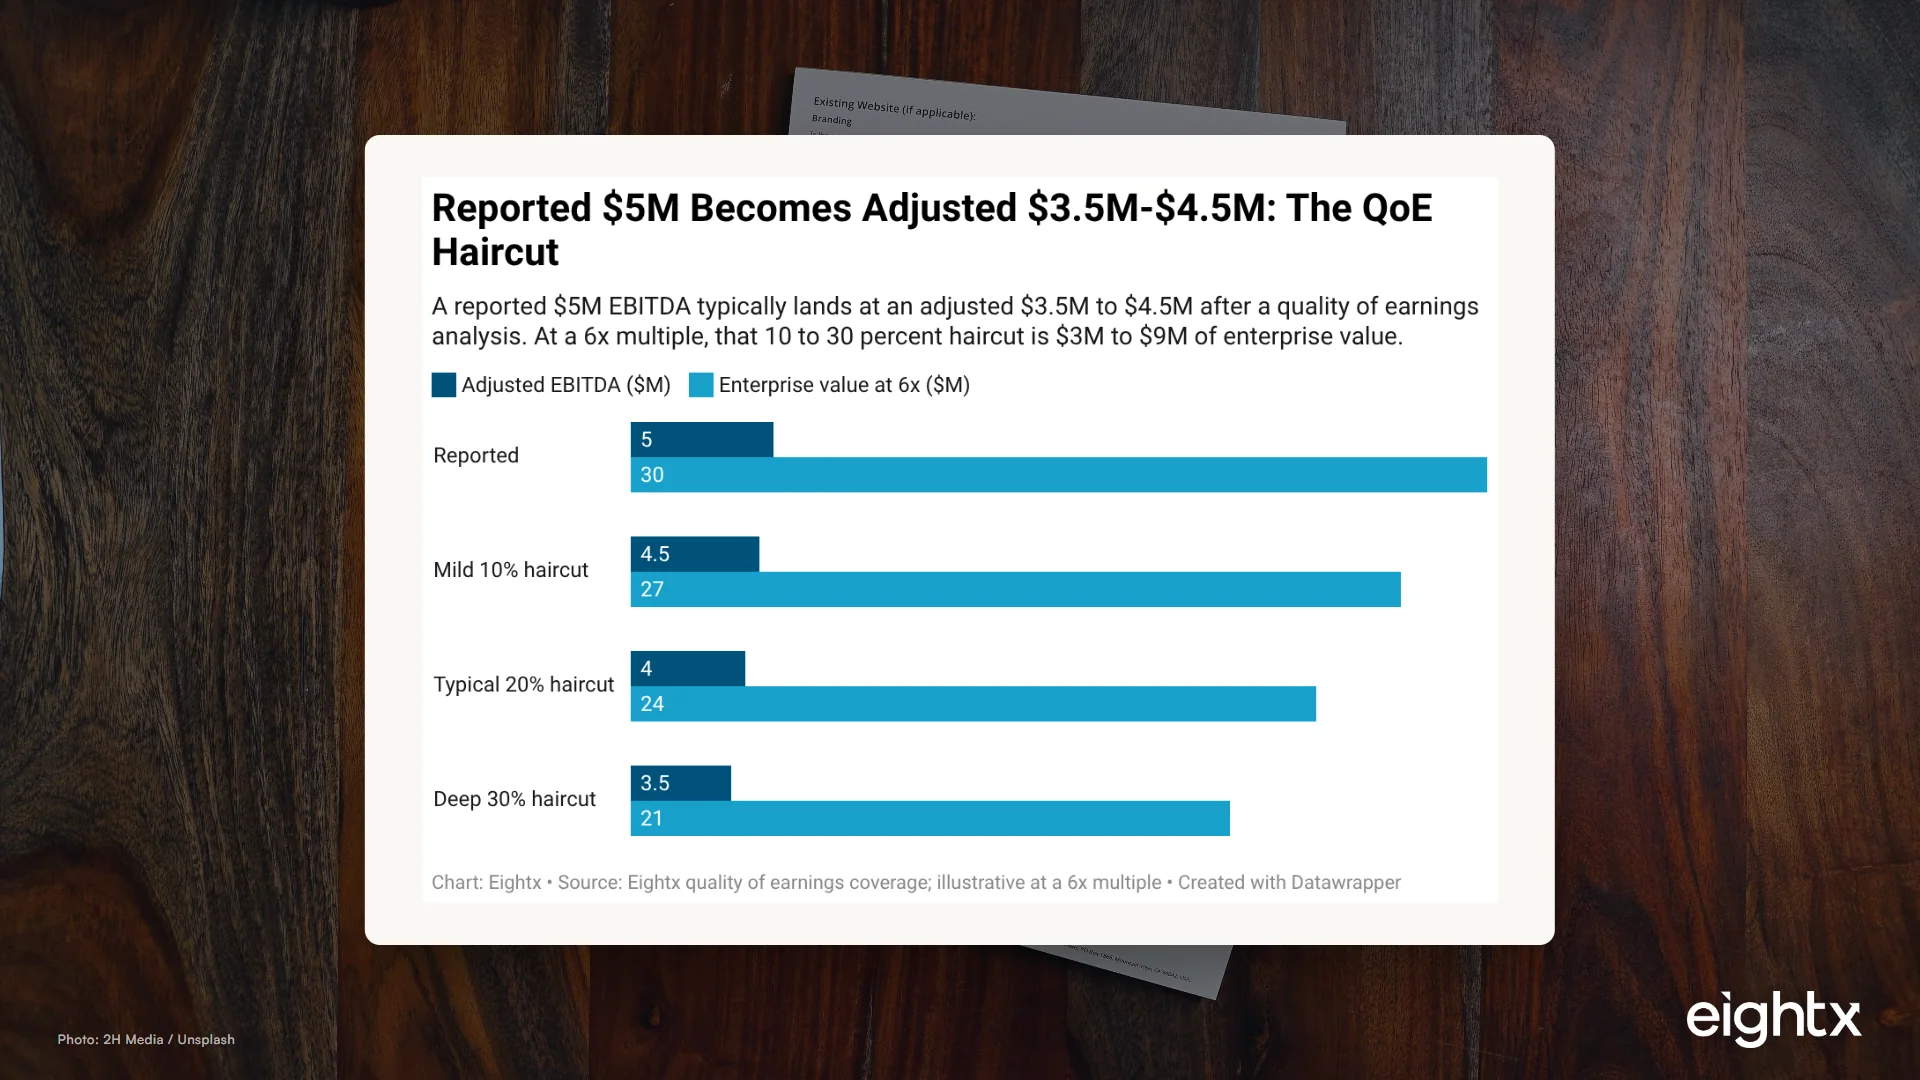
A buyer's quality-of-earnings team recasts your P&L first. At a 3x multiple a $4M normalization is a $12M valuation swing. The five DTC add-backs to defend early.
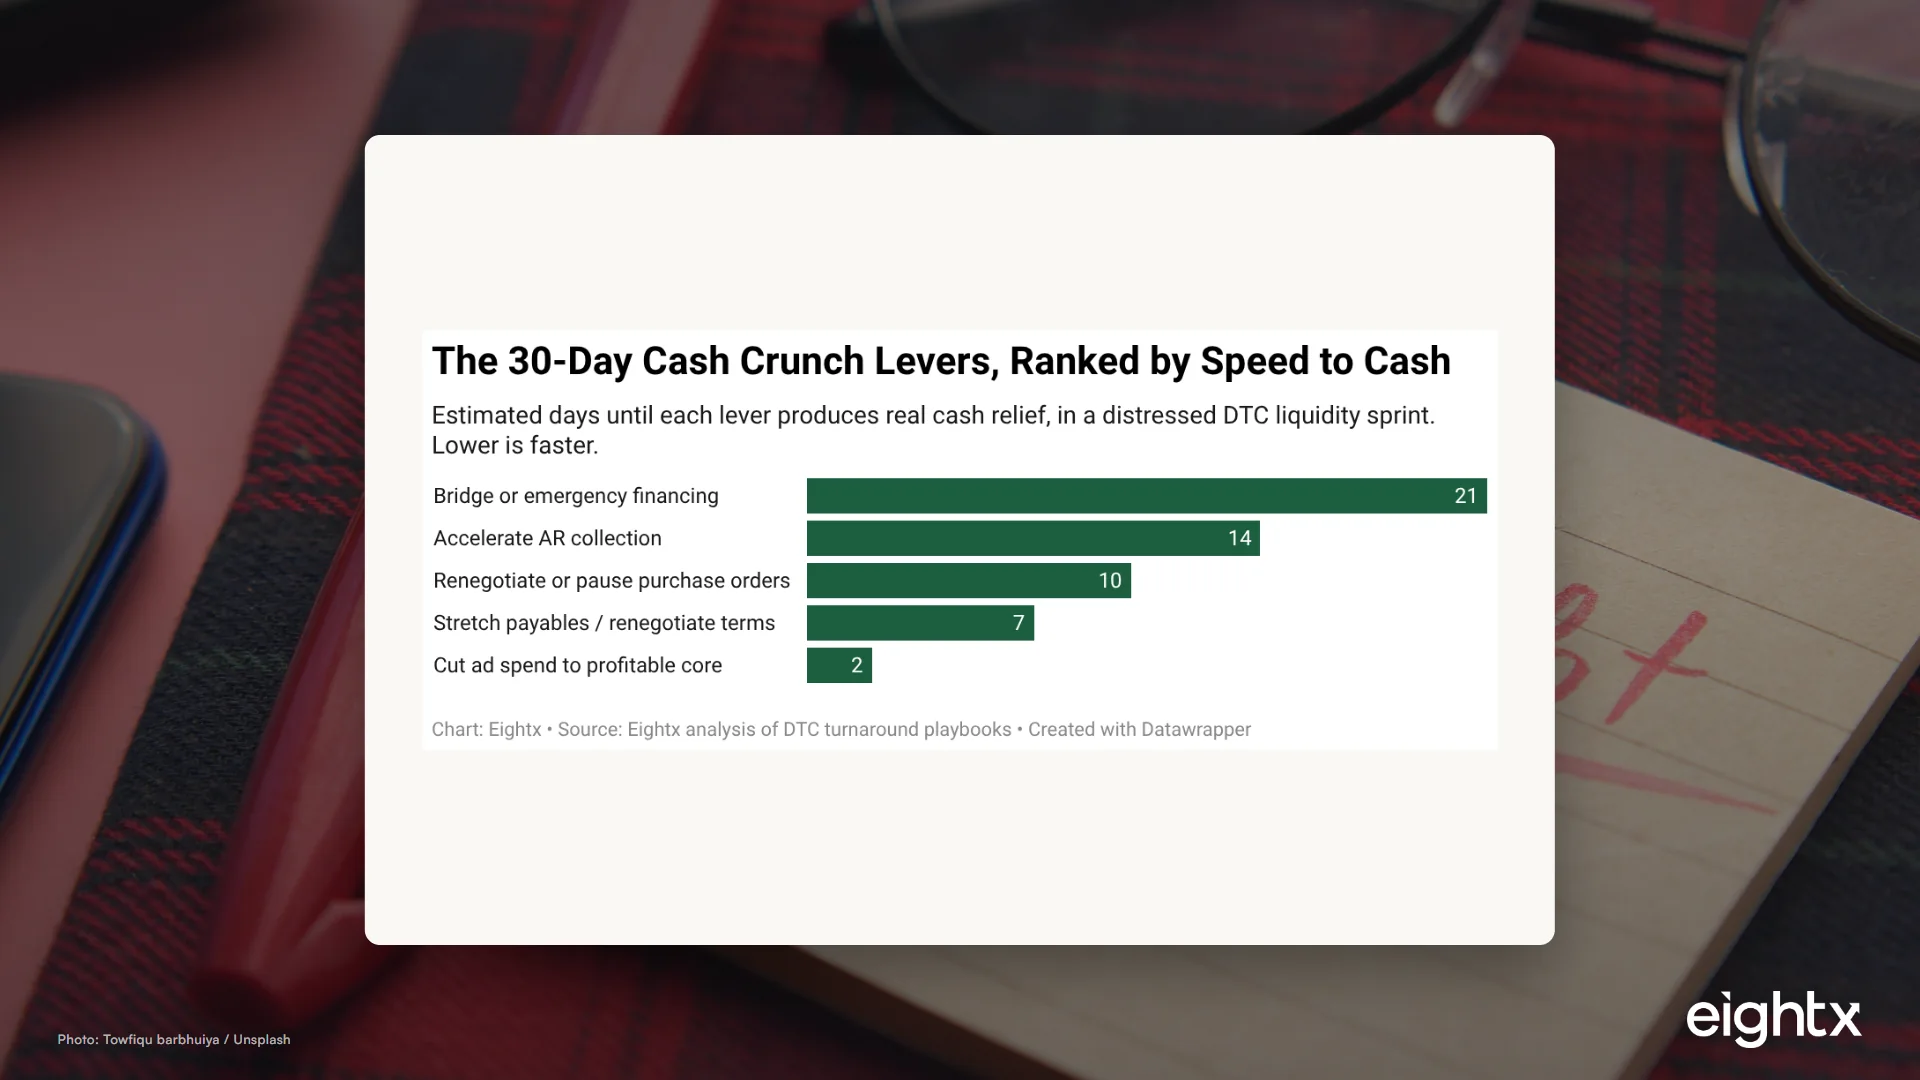
Your P&L says you made money, your bank account says otherwise. The 5 warning signs of a DTC cash crunch and a 30/60/90-day recovery plan, with the data behind it.
MER, ROAS, and blended CAC measure marketing at three different altitudes. Here is what each one means, when each one lies, and the five-step reconciliation a CFO runs.
Most DTC LTV numbers are inflated 30-65%. The honest version uses contribution-margin cohort LTV over fully-loaded CAC, and payback in months drives real spend decisions.
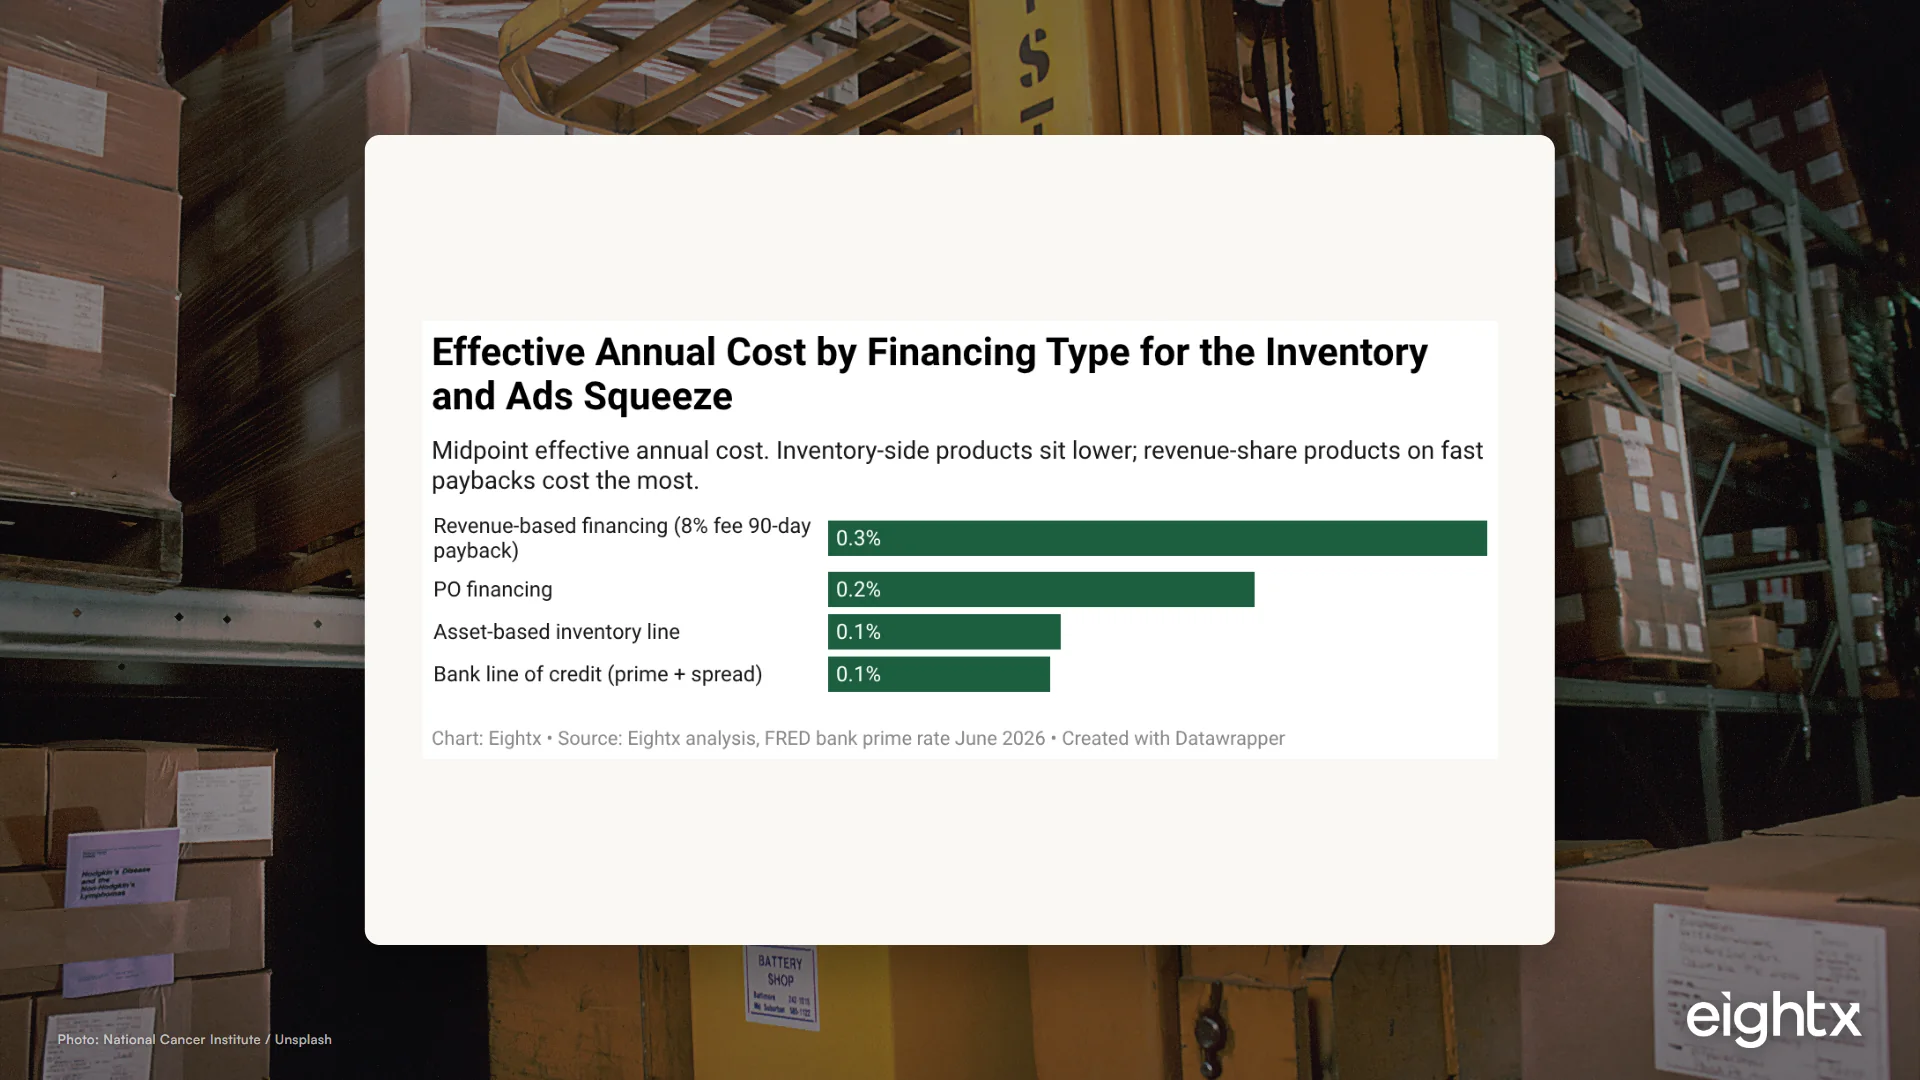
Every DTC inventory financing option priced as real APR: bank LOC, SBA, ABL, Clearco, Wayflyer, Settle, and PO financing on a $500k position over 6 months.
e.l.f. Beauty runs a ~71% gross margin selling $3 products, while Coty runs 64% and Revlon ran 58%. The 10-Ks show exactly where the gap comes from.
DTC brands run a 60-120 day cash conversion cycle that traps ~14.8% of revenue. Here are the 7 levers, the safe-purchase formula, and how to fund inventory.
Walk DTC unit economics end to end: AOV, COGS, fulfillment, returns, CAC and the breakeven-ROAS math that tells you whether your brand can actually scale paid spend.
Profitable DTC brands go broke on timing, not demand. The 13-week cash model, the 6 traps that drain a scaling brand, DIO benchmarks by vertical, and 9 fixes.
Median DTC brands report 60-70% gross margin but finish at 15-20% contribution margin. The CM1-CM4 ladder, benchmarks by vertical, and six accounting mistakes.
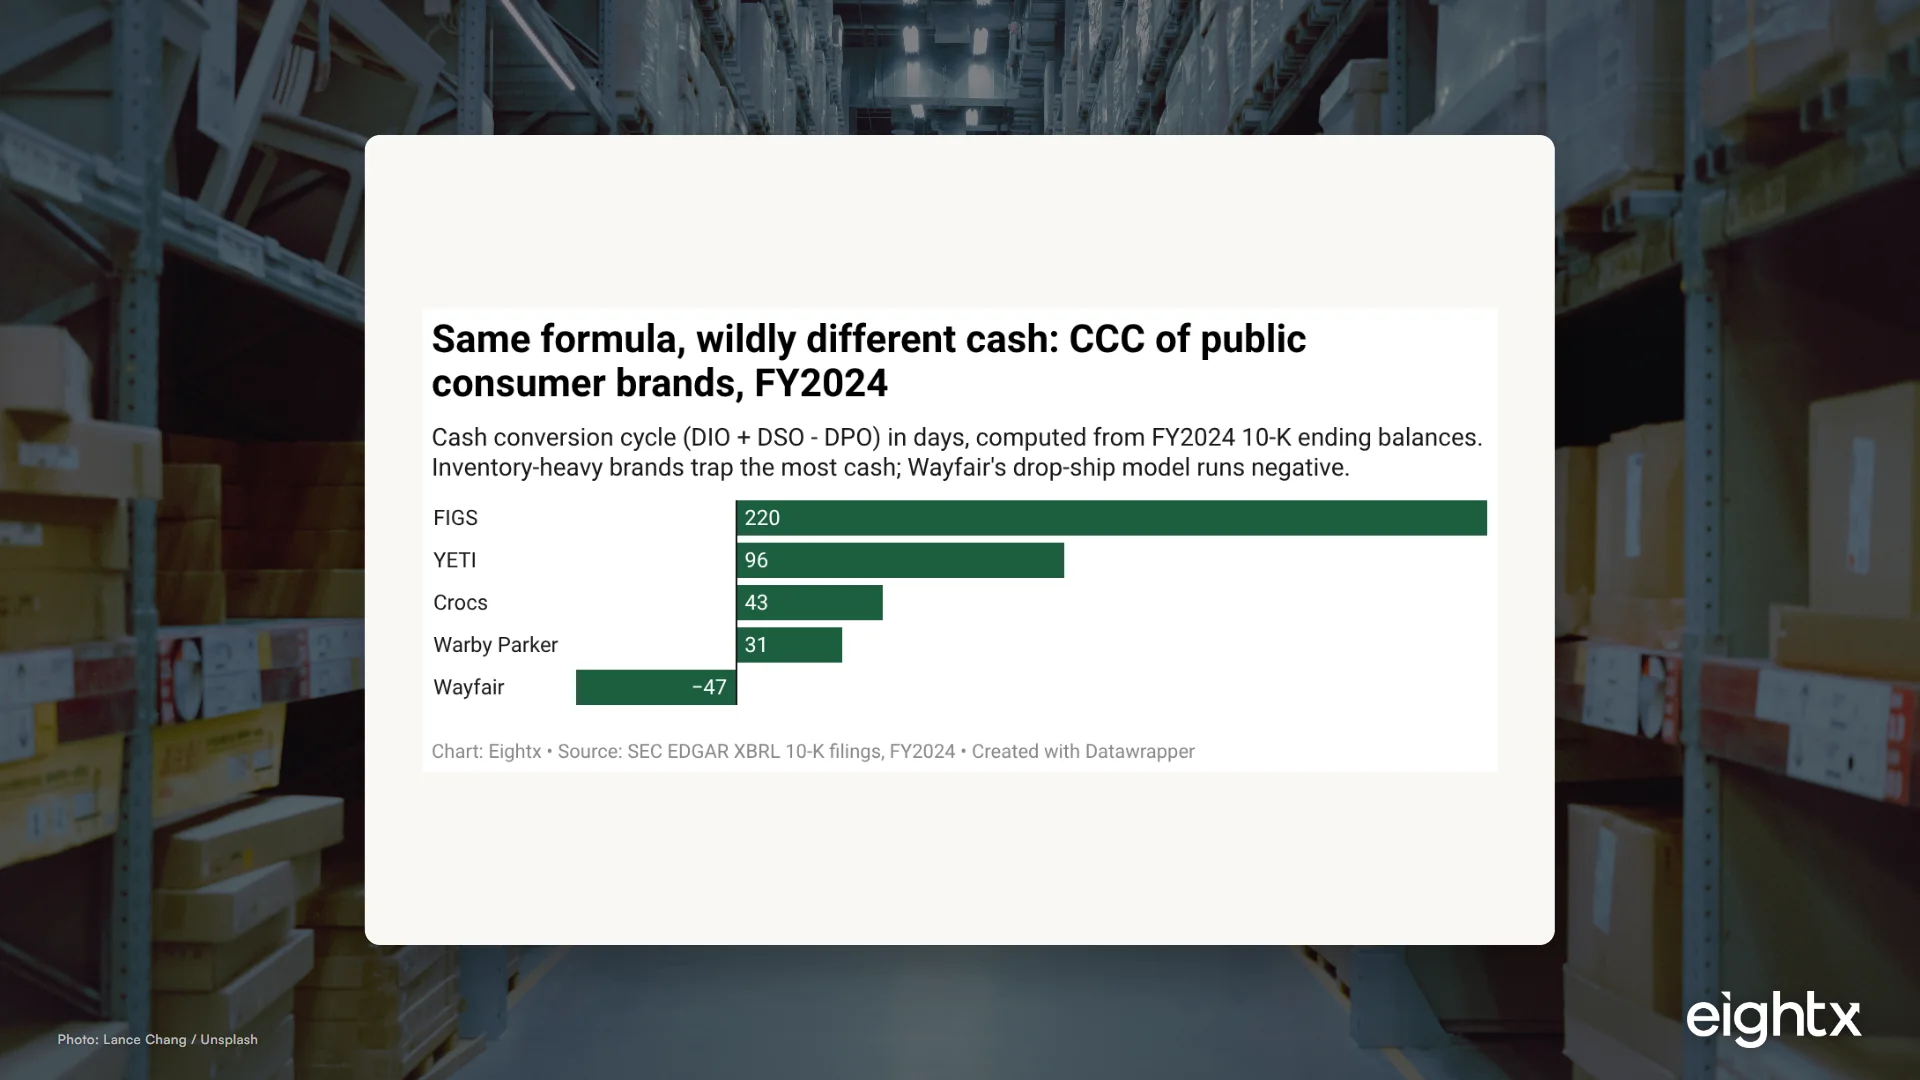
The median public DTC brand runs a 113-day cash conversion cycle. Here is the formula, real 10-K benchmarks, and the three levers that free trapped cash.
Under Armour's Feng Chen Wang collab won't move a $5B revenue decline. The CFO read on why designer collabs are brand-equity spend, not a margin bet.
A Swedish court ordered Google to pay Klarna's PriceRunner nearly $2B for self-preferencing. The CFO read is channel concentration risk, not the verdict.
The USMCA joint review launches July 1, 2026. The CFO read: this is not a deadline, it is a multi-year rules-of-origin uncertainty window. Plan the range.
Bogg is pushing deeper into wholesale despite lower gross margin. The CFO read: model contribution margin and cash, not gross margin, on channel mix.
Nike expects a $986M IEEPA tariff refund but booked only $300M in cash. The CFO read on filing, accounting for, and not spending an uncertain refund.
Does BFCM lift your average order value? Mostly no. Cyber Week 2025 AOV was +1% overall, -5% electronics, -7% gifts, plus how to protect basket size.
Meal kit subscriptions churn at 8 to 15% a month, the highest of any consumable subscription category. Blue Apron's SEC filings show why, plus the LTV math for 2026.
Fine jewelry online returns run 8% to 15%, fashion jewelry 12% to 20%. Benchmarks by category and channel, the January spike, cost per return and policy levers.
Inventory carrying cost runs 20 to 40 percent of inventory value a year, and it varies by vertical. 2025 benchmarks by category plus the markdown-vs-hold math.
Furniture ecommerce returns run 19-23% online, and one large return costs $55-$108 to process. Benchmarks, cost stack, and the levers that actually move it.
Online footwear returns run a median 18-19% for DTC and 25-30% for multi-brand, roughly 2-3x in-store. Benchmarks by channel, why width drives returns, and the cost.
Consumer electronics returns average 10-11% online, one of the lowest major-category rates, yet cost $30-$65 to process. Benchmarks, subcategory rates, and fixes.
Consumer brands sell 16-24% at seed and end up near 30.5% founder ownership after Series A. 2026 dilution benchmarks plus the option-pool and SAFE math that hides.
Beauty returns run 4 to 12 percent online, lowest of any ecommerce category. Foundation hits 23 percent on shade mismatch. Subcategory benchmarks inside.
The average online apparel return rate is 23-25%, about 3x in-store. Benchmarks by subcategory, what returns cost your gross-to-net, and the levers that move them.
What DTC brands actually discount at BFCM by category: electronics 30%, apparel 23-37%, beauty 35-40%. Plus why your headline banner is not your real margin hit.
Shaver Shop (ASX:SSG) grew gross margin to a record 45.5% while revenue held at $219m. FY2022-FY2025 financial spine, channel mix, and dividend payout mechanics.
Hydrogen now one-click deploys to Vercel. The CFO read on headless commerce: the deploy is cheap, the build and engineering are not.
Google's Nano Banana 2 Lite makes 1,000 AI images for about $0.034. The CFO read on what near-free creative does to testing and CAC.
Primark heads toward 60 US stores on a near-zero-ecommerce model while DTC retreats. The CFO read on value-retail store economics.
A bigger creator commission is rarely the best lever. The CFO math on base commission plus behaviour bonuses, the $5-per-sale floor, and how to beat a flat 30% rate.
Cotopaxi tested BOPIS and declined a full omnichannel build. The CFO read on when store fulfillment pays and when it just adds cost.
How much revenue DTC brands carry into a seed or Series A in 2025: $250K-$3M at seed, $7M-$20M for a competitive A. Carta, Crunchbase, and operator data.
Most ecommerce brands under $5M sell on a multiple of SDE, not revenue. The 2025 SDE multiple by revenue band, from about 2x under $500K to 6x at $3-5M, and the levers.
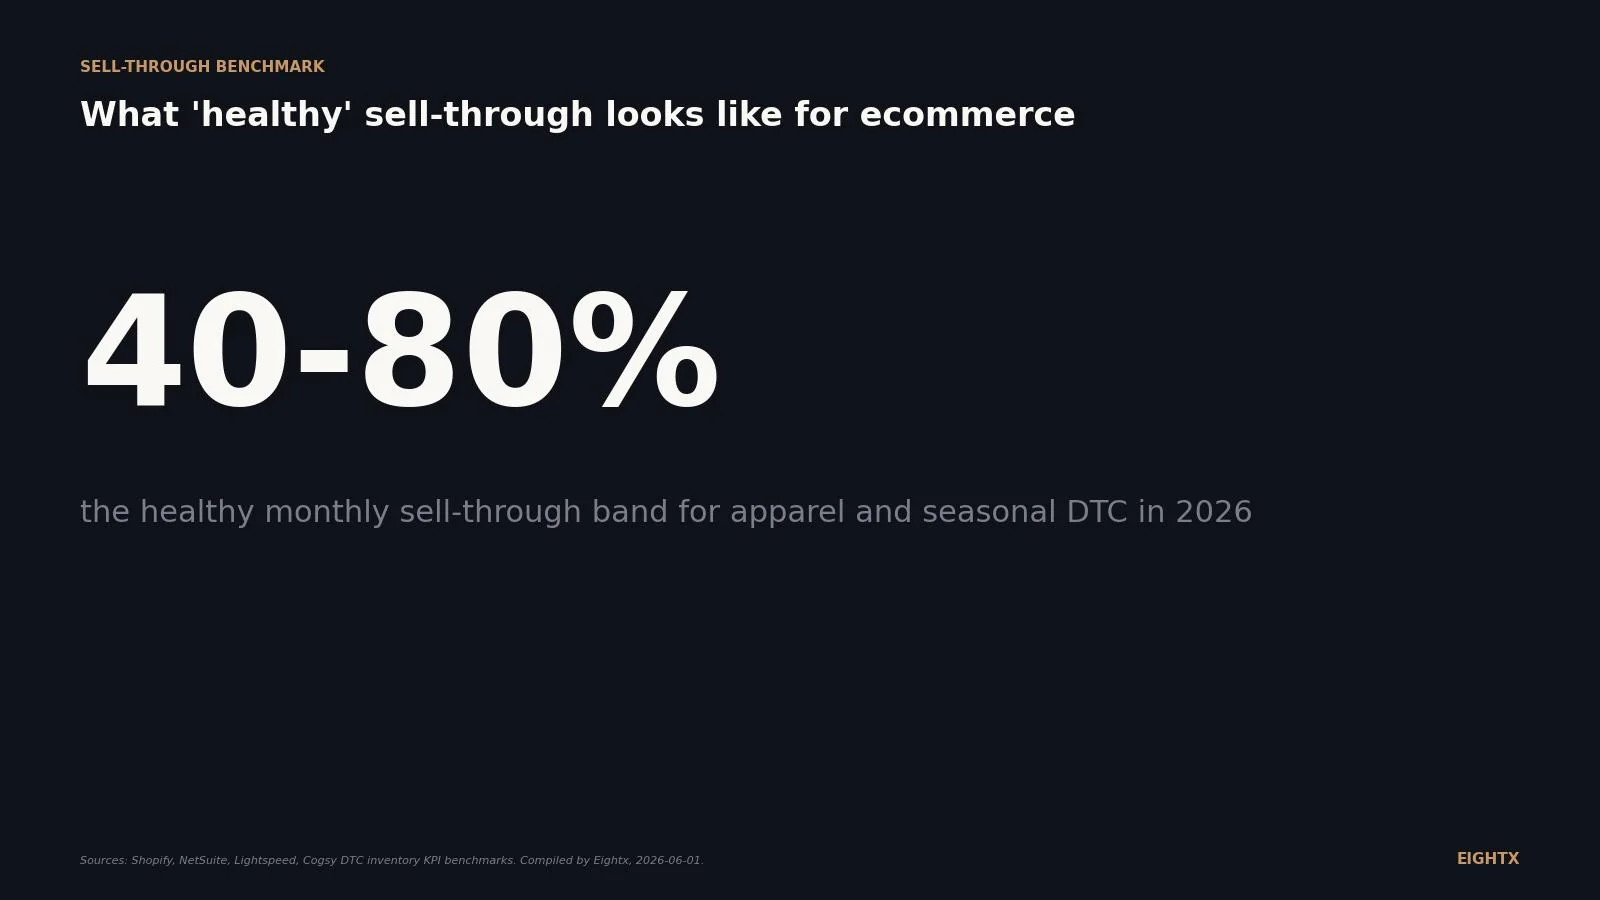
Sell-through rate benchmarks by vertical for 2026: beauty 75-90%, seasonal apparel 60-85%, premium footwear 35-50%, home goods 55-75%. Calibrate against your category.
A healthy Amazon TACOS is 10-15% of revenue; launches run 25-40%. The 2026 TACOS benchmarks by category and lifecycle stage, plus how to set your own target.
Beauty box subscriptions churn 8-14% a month, losing 63-83% of subscribers a year. What the Birchbox collapse and Ipsy's survival teach operators about retention.
Premium fashion DTC loses ~64% of gross sales before net revenue; beauty loses ~14%. The gross-to-net gap by category, from SEC 10-K filings and returns data.
Holiday return rates run 17% above annual baseline, spiking Dec 26 to mid-January. Benchmarks by category and a simple Q4 clawback model.
Pet subscription churn splits in two: replenishment (food, autoship) runs 5-8% monthly, discovery boxes 8-12%. The 2026 benchmark, with Chewy and BARK as proof.
DTC supplement subscriptions churn 5 to 8 percent monthly, half the rate of beauty boxes. See 2026 benchmarks, the churn-to-LTV math, and retention levers that work.
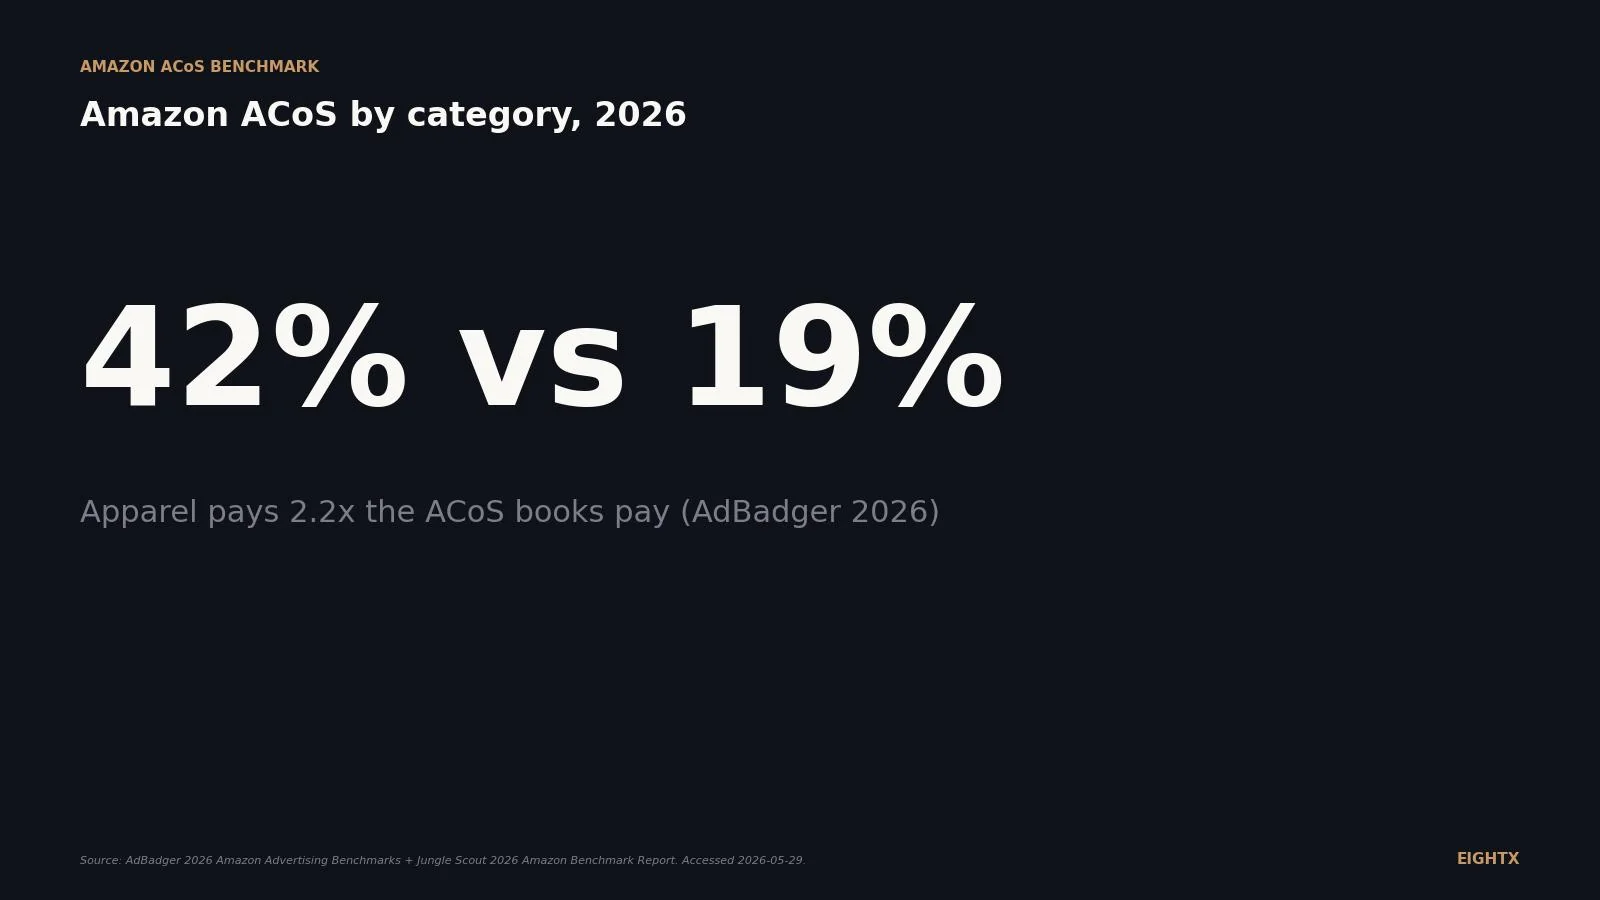
Amazon ACOS by category, 2026: Grocery 21%, Apparel 42%, platform-wide 29-32%. Full benchmark table and break-even math to check if your ACOS is profitable.
Movado Group has a 54% gross margin and zero debt. It also has a 4.4% operating margin. A CFO teardown of what SGA is doing to the Museum dial watch house.
Boston Beer (SAM) hit 48.5% gross margin in FY2025, its best since 2019, while shipments fell 4.7%. A CFO's teardown of the Twisted Tea risk and the $212M litigation shock.
Newell Brands runs Sharpie, Rubbermaid, Coleman and Yankee Candle on a 0.5% GAAP operating margin and $4.5B in debt. A CFO teardown of the turnaround math.
Genesco posts $2.4B in revenue but only 0.7% operating margin. One banner generates 61% of sales and all the profit. A CFO teardown of what that means.
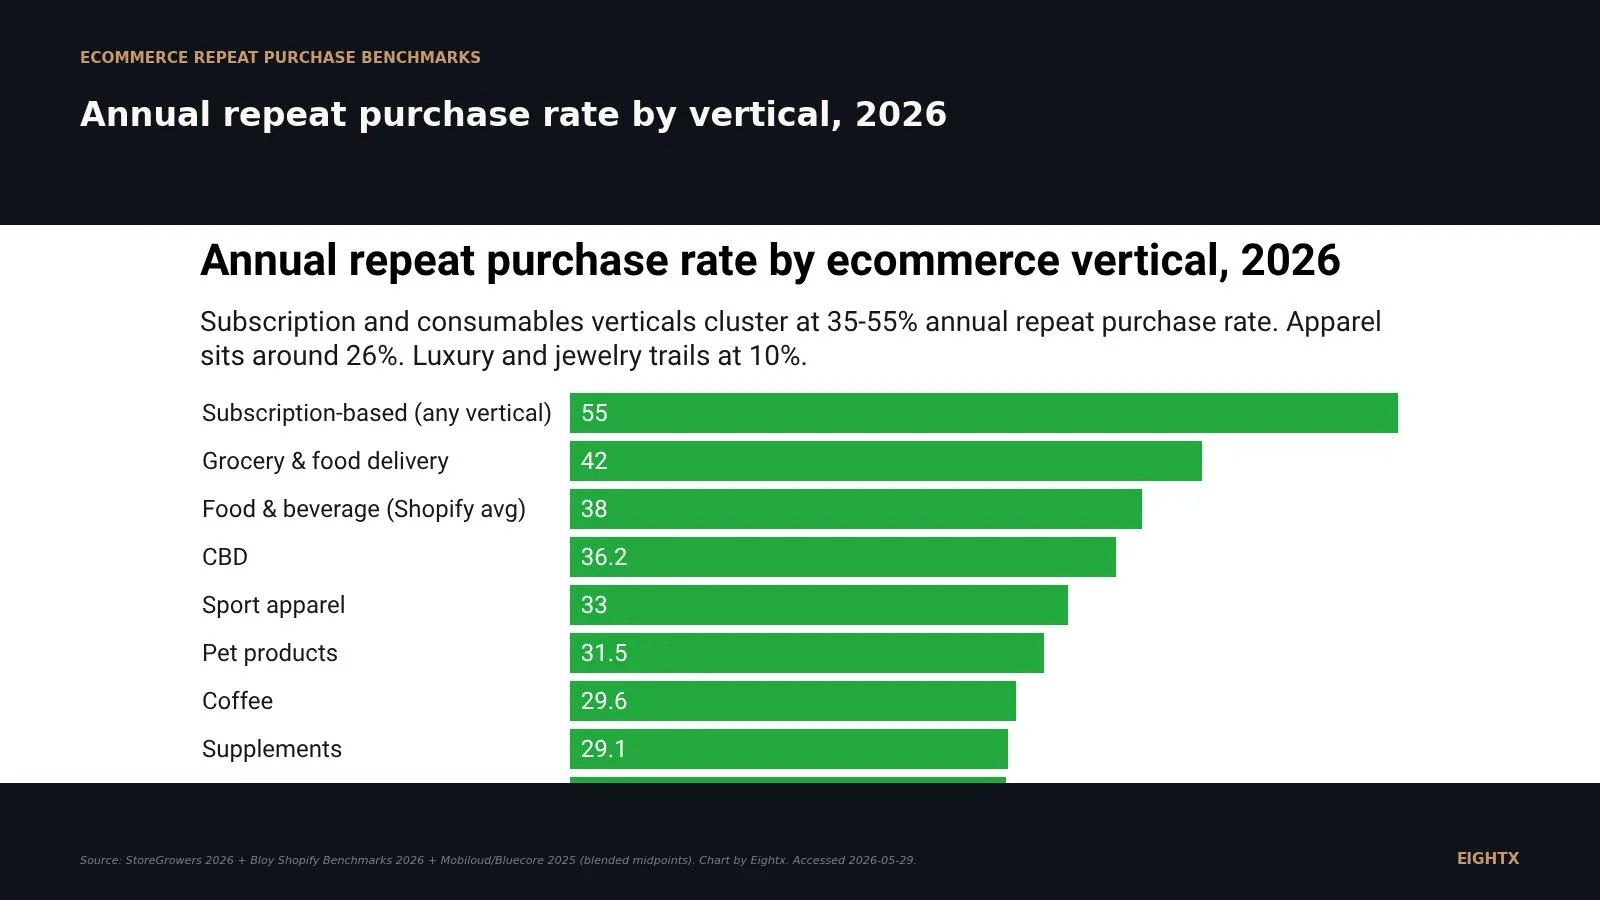
DTC repeat purchase rate averages ~28%, but it ranges from 11% in jewelry to 45% in food and supplements. 2026 benchmarks by vertical, plus how to read yours.
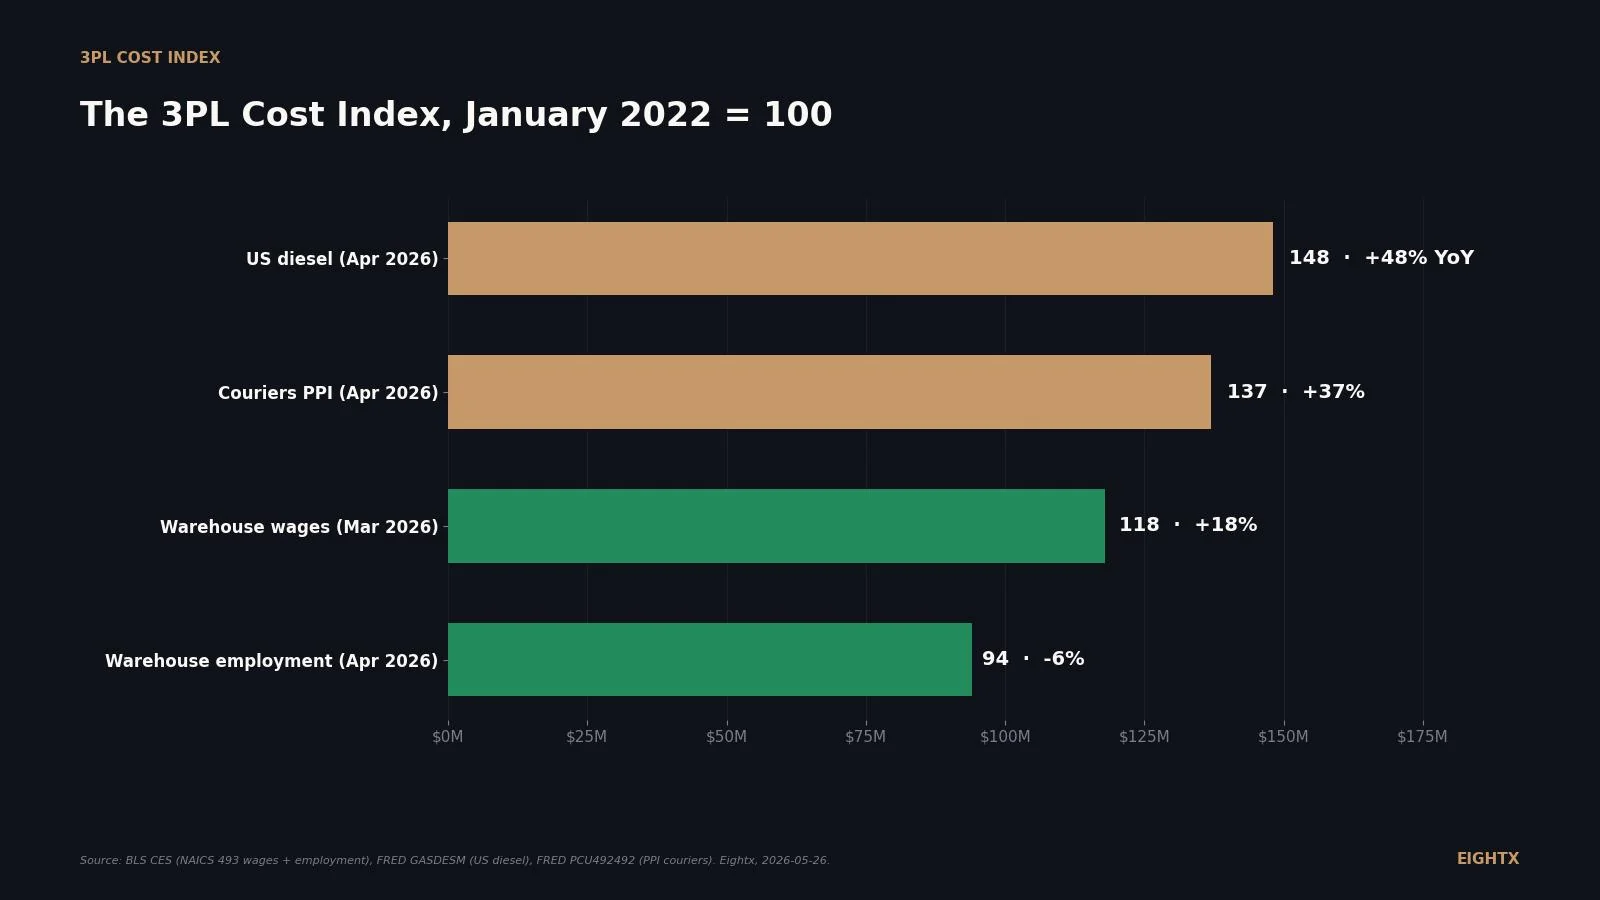
All-in DTC fulfillment runs $11 to $18 per order in 2026, from apparel to fragile homewares. Vertical benchmarks, cost components, and BLS inflation data.
A well-run win-back flow converts 2-5% of lapsed email recipients, but program reactivation runs 12-20%. Benchmark ranges by tier, and how deep to discount.
How long DTC subscribers stay by category in 2026: supplements 12-20 months, beauty boxes 7-10, and the 3-5x LTV multiple that sets your CAC ceiling.
Only 9% of wholesale brands report seamless ERP integration in 2026 (down 16 points) even as 91% sync pricing. Inside the wholesale maturity gap and the Toggle Tax.
Wholesale brands shifted from set-and-forget to test-and-learn pricing in 2026, using AI for forecasting and pricing to protect margins. The survey data and operator read.
B2B wholesale is the top investment channel for 2026: 78% of surveyed brands rank it first, up from 70%, while DTC physical retail investment fell to 18% from 40%.
Container rates jumped double digits as tanker rates fell, driven by tariff frontloading, not fuel. The CFO read on landed cost and contribution margin.
India has 1.46B people but only $125B in online retail. For foreign sellers, the four legal entry paths, not the population, decide your CFO economics.
About 20% of the world's oil moves through the Strait of Hormuz. The honest transmission chain from an energy chokepoint to your DTC landed cost.
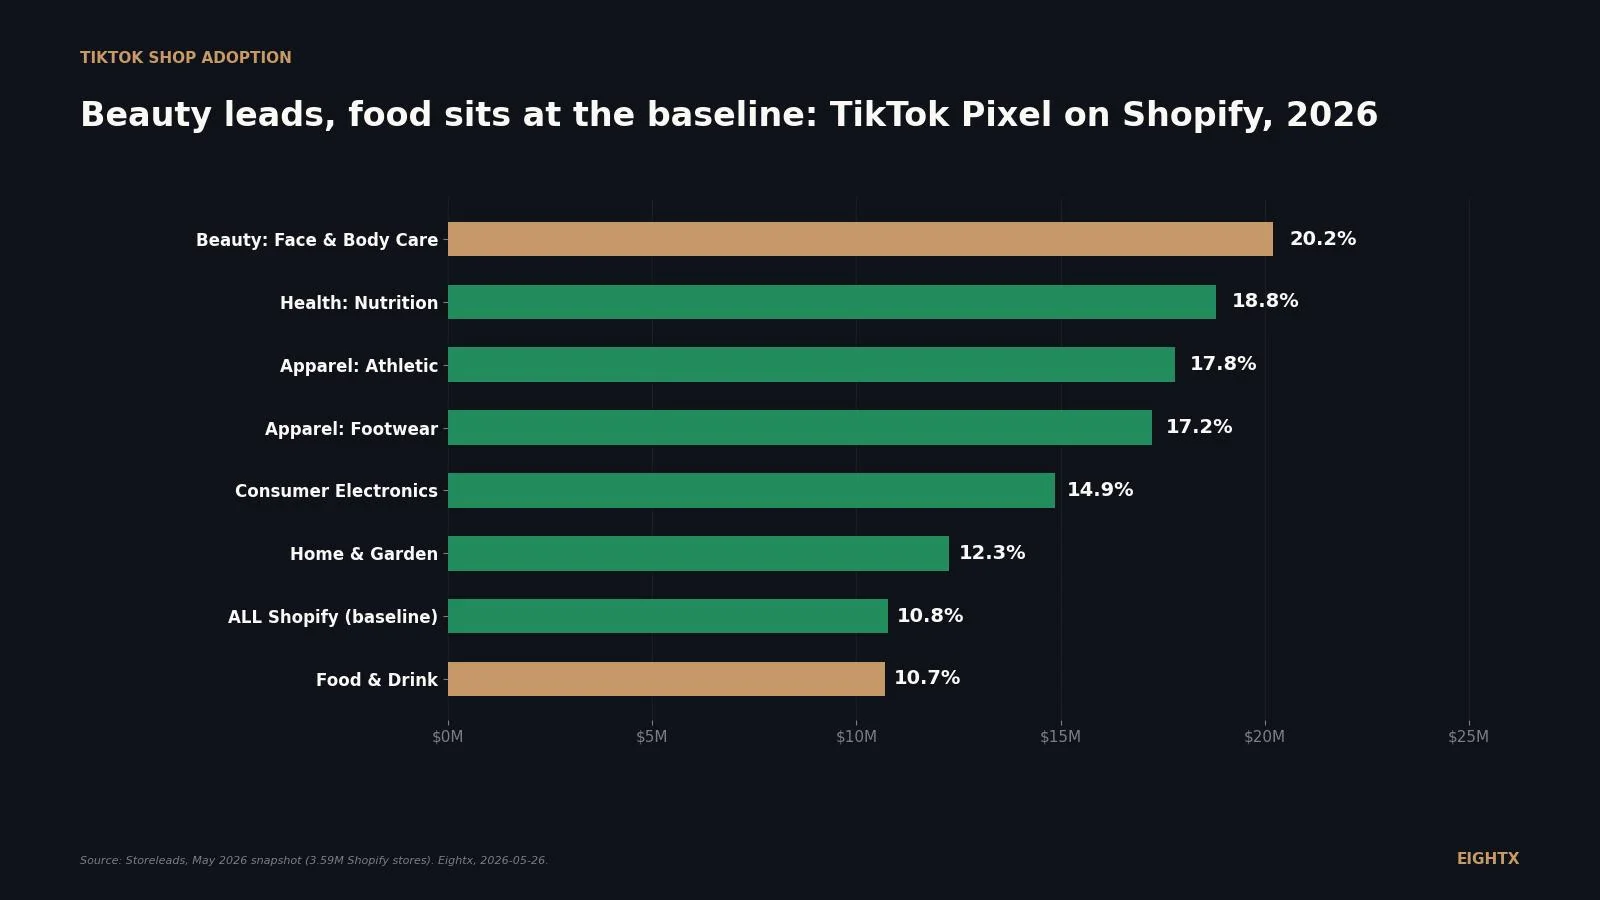
TikTok Shop food sales more than doubled YoY and legacy brands are piling in. Here is the CFO read on TikTok Shop channel economics for food brands.
TikTok Shop now requires qualification docs in 16 US categories. No paperwork, no listing. Here is the CFO read on the trapped-cash and channel risk.
Saks emerged from Chapter 11 as Exemplar with a 75% debt cut. What the restructuring means for any DTC brand selling wholesale into department stores.
India's UPI chief says AI will drive the next era of digital payments. Here is what the world's largest payment rails signal for your ecommerce finance ops.
A 2026 analysis says Chewy may buy vet clinics to crack the $54B pet-healthcare market. The CFO math of buying growth vs building it, for DTC operators.
TNVitamins recalled two moringa supplements for Salmonella across Amazon, Walmart, TikTok Shop and Target. The CFO cost stack behind a supplement recall.
Prime Day 2026 hit a record $26.4B, up 9.3%, driven by inflation. Here is what the headline number hides about Amazon seller margin, and the CFO read.
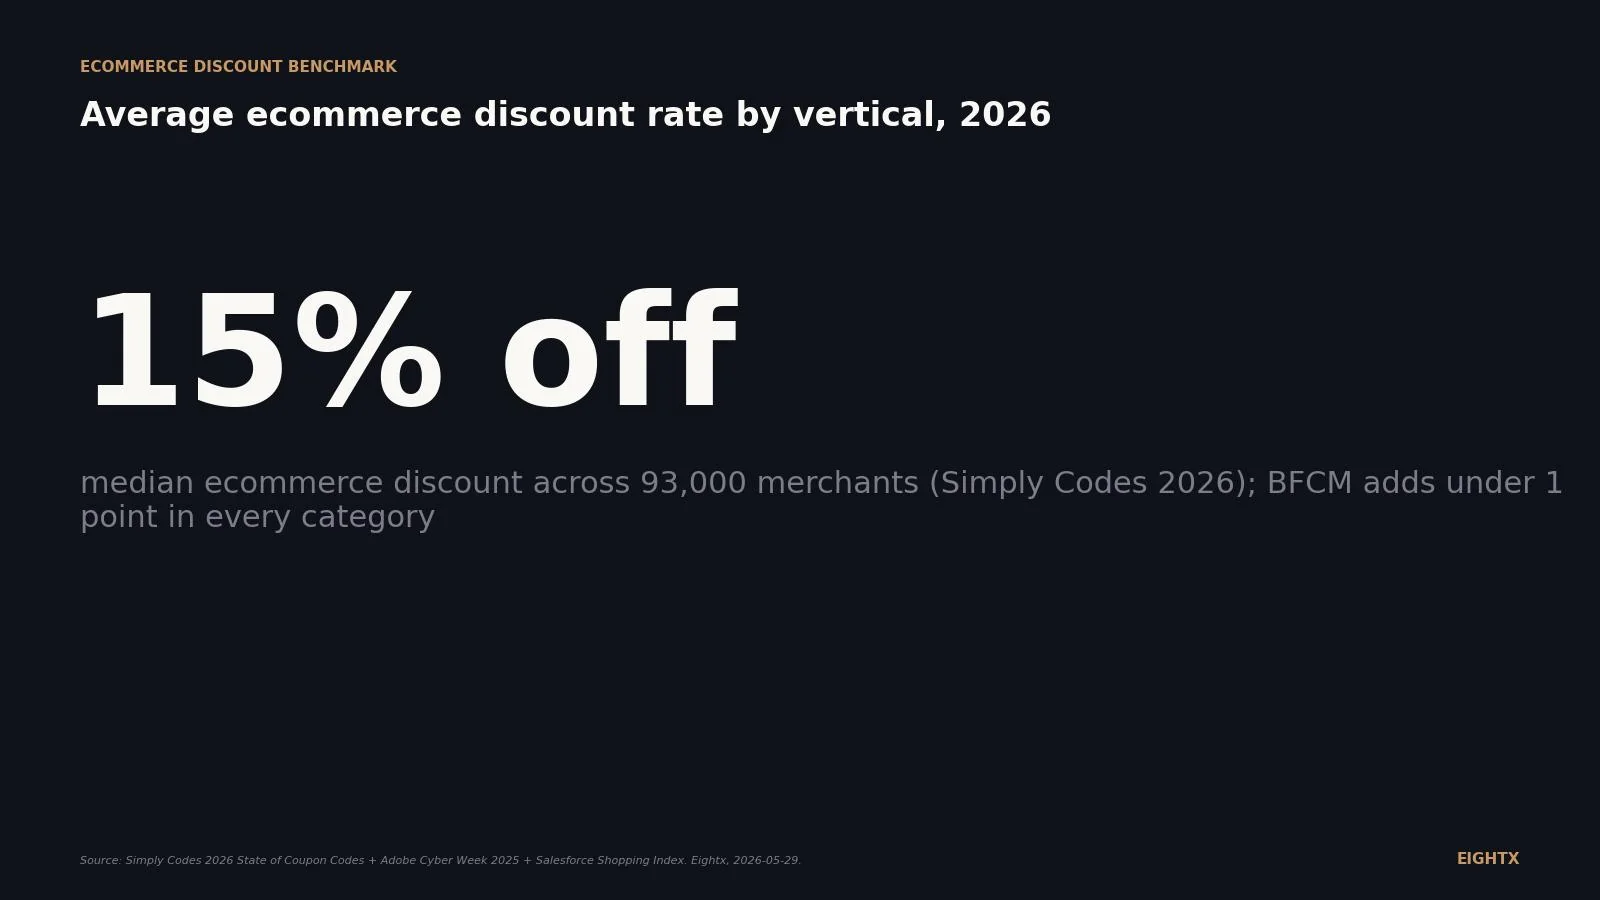
Median promo code depth is 15%, but effective discount rates run 5-10%. Benchmarks for beauty, apparel, and supplements, plus how to read your own number.
What a normal chargeback rate looks like by ecommerce vertical in 2026, plus the Visa VAMP and Mastercard thresholds that flag your processing account as Excessive.
How much of DTC revenue should be recurring? 2026 subscription-share benchmarks by category (pet, supplements, coffee, beauty, apparel) plus the churn math behind them.
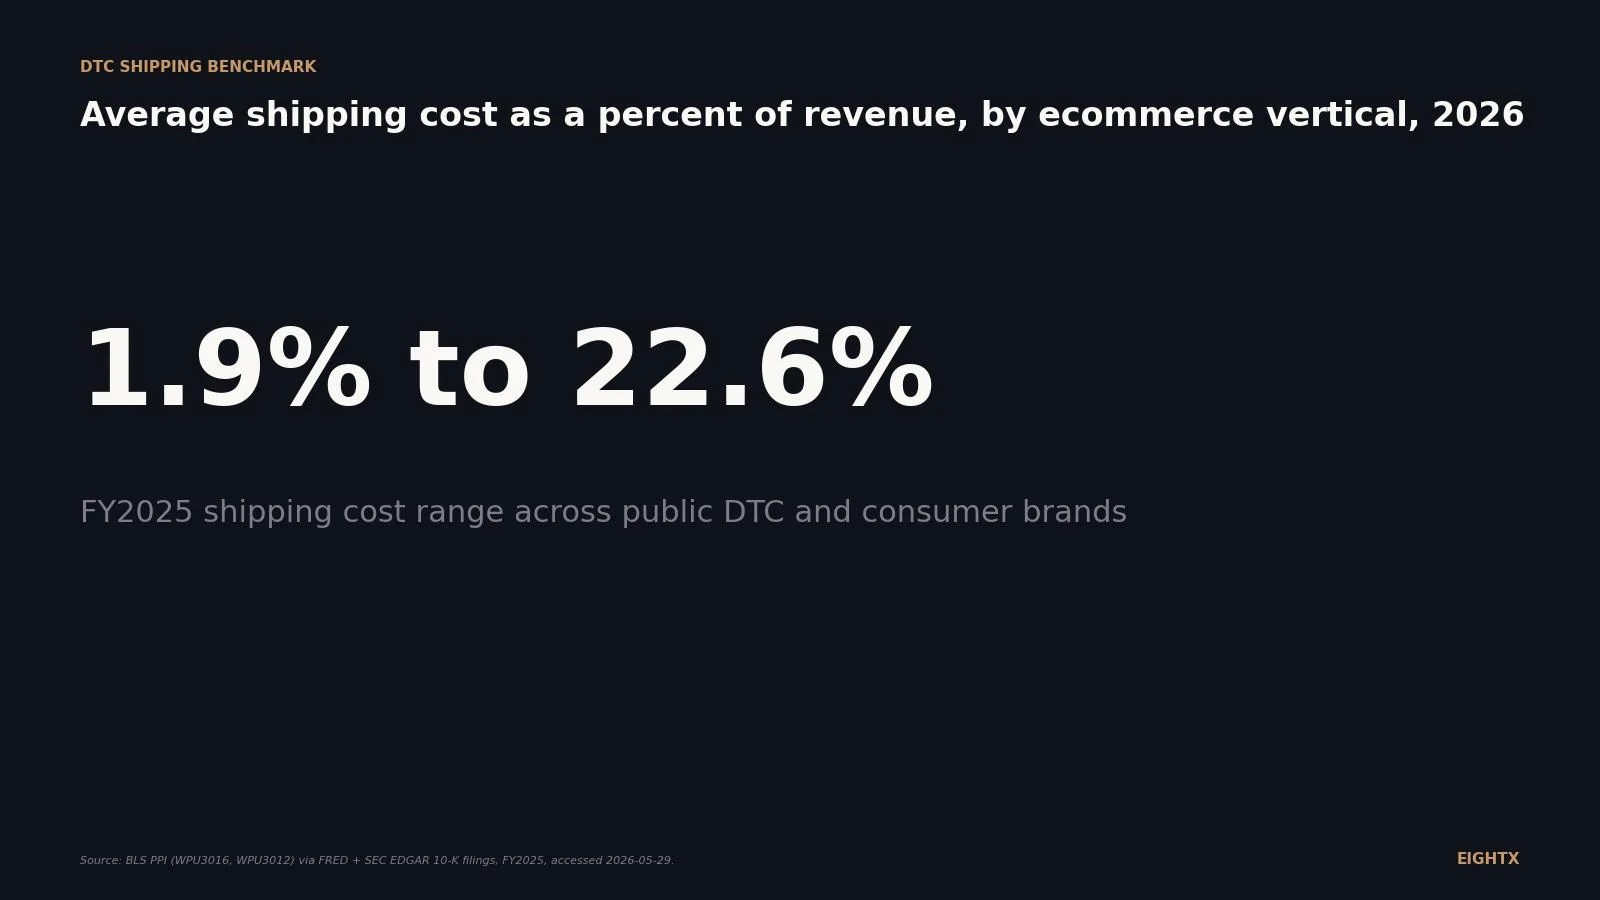
Shipping cost as a share of revenue runs 3% for electronics and up to 28% for furniture. 2026 benchmarks by vertical, plus the AOV and packaging levers that move the line.
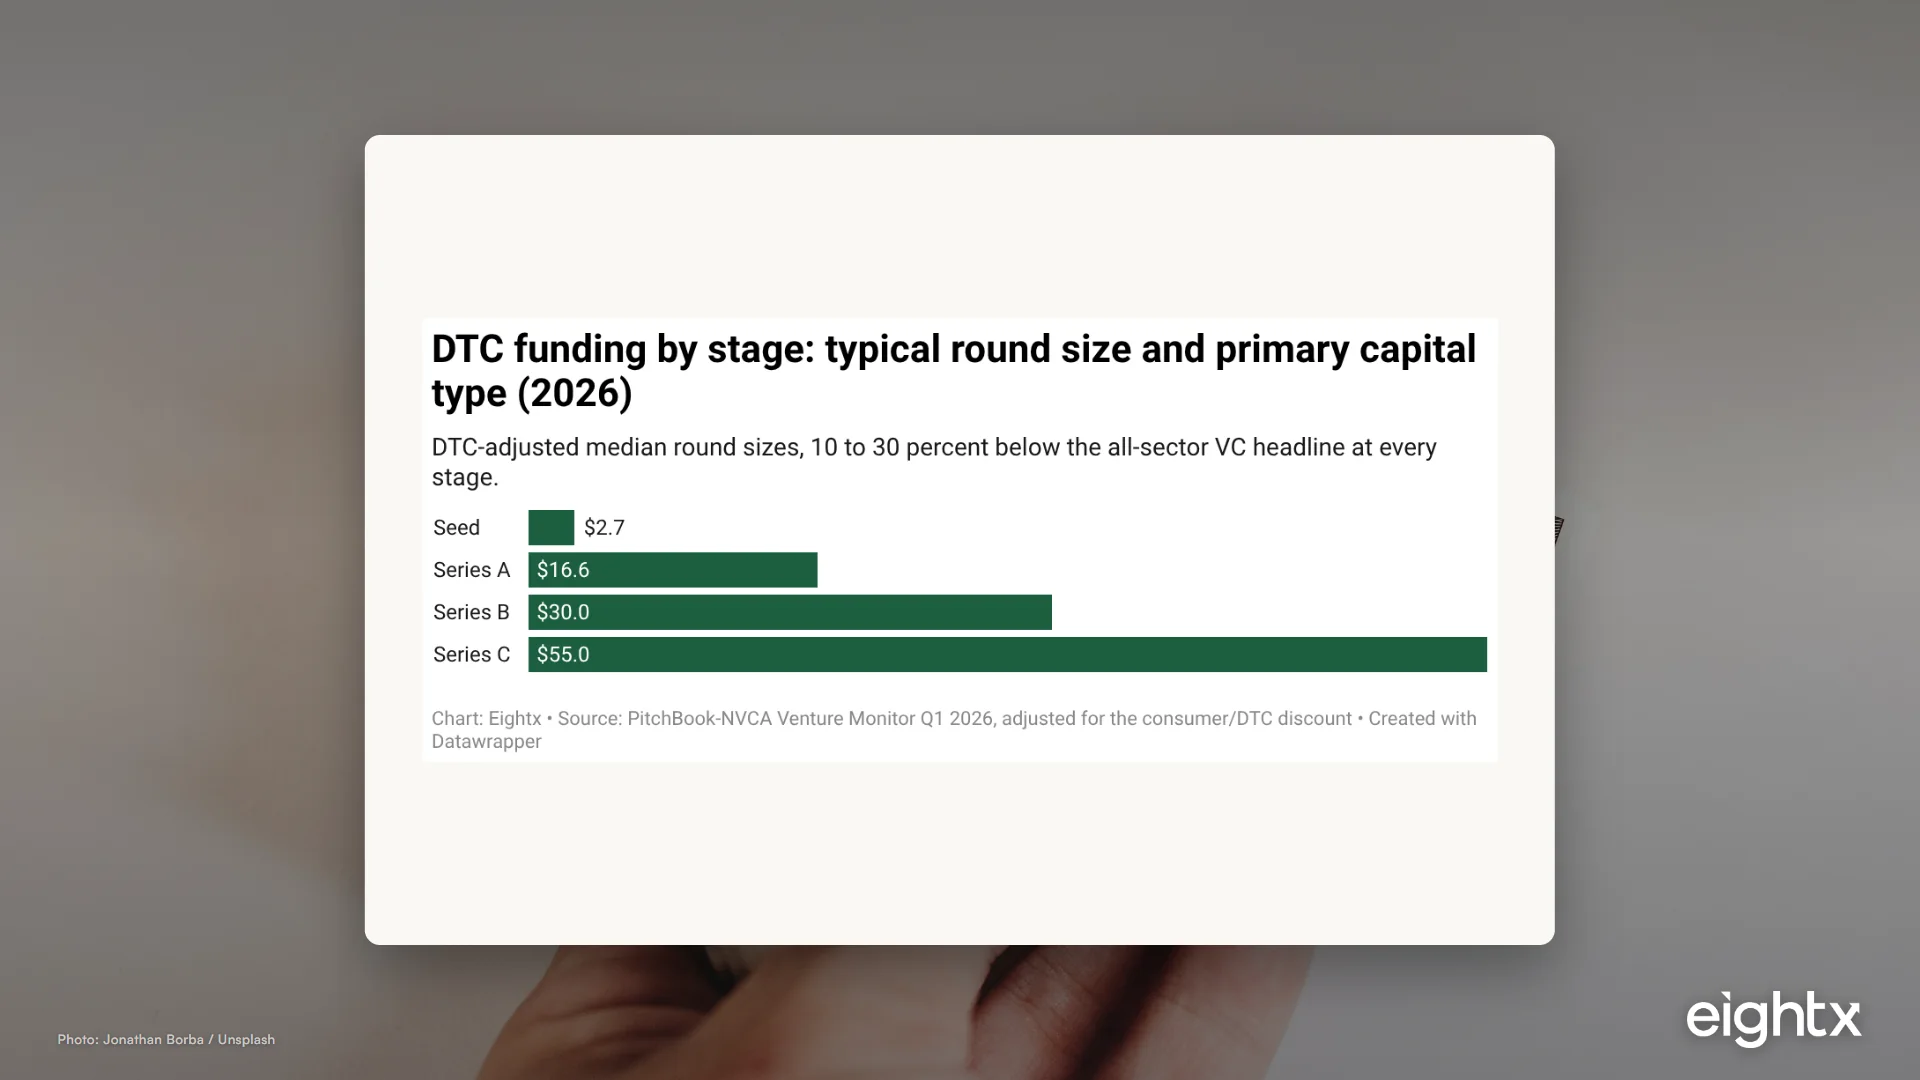
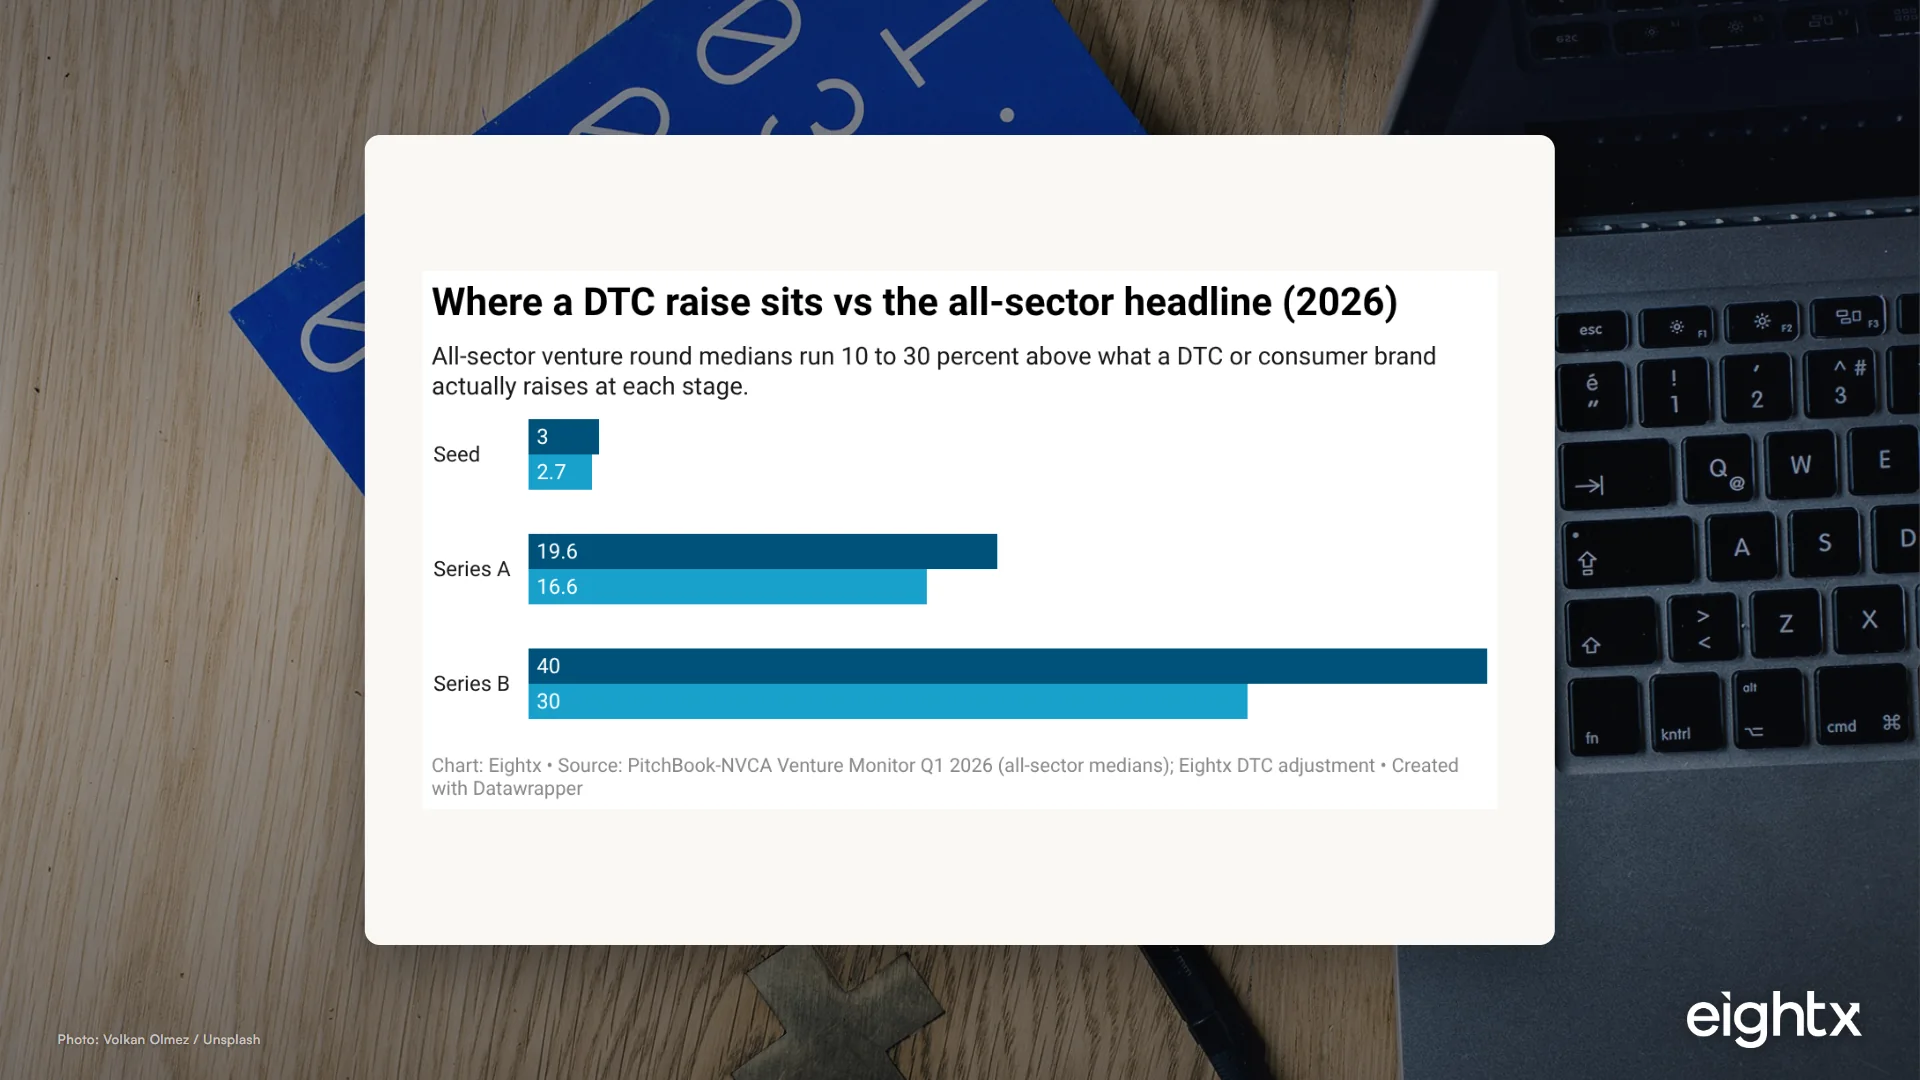
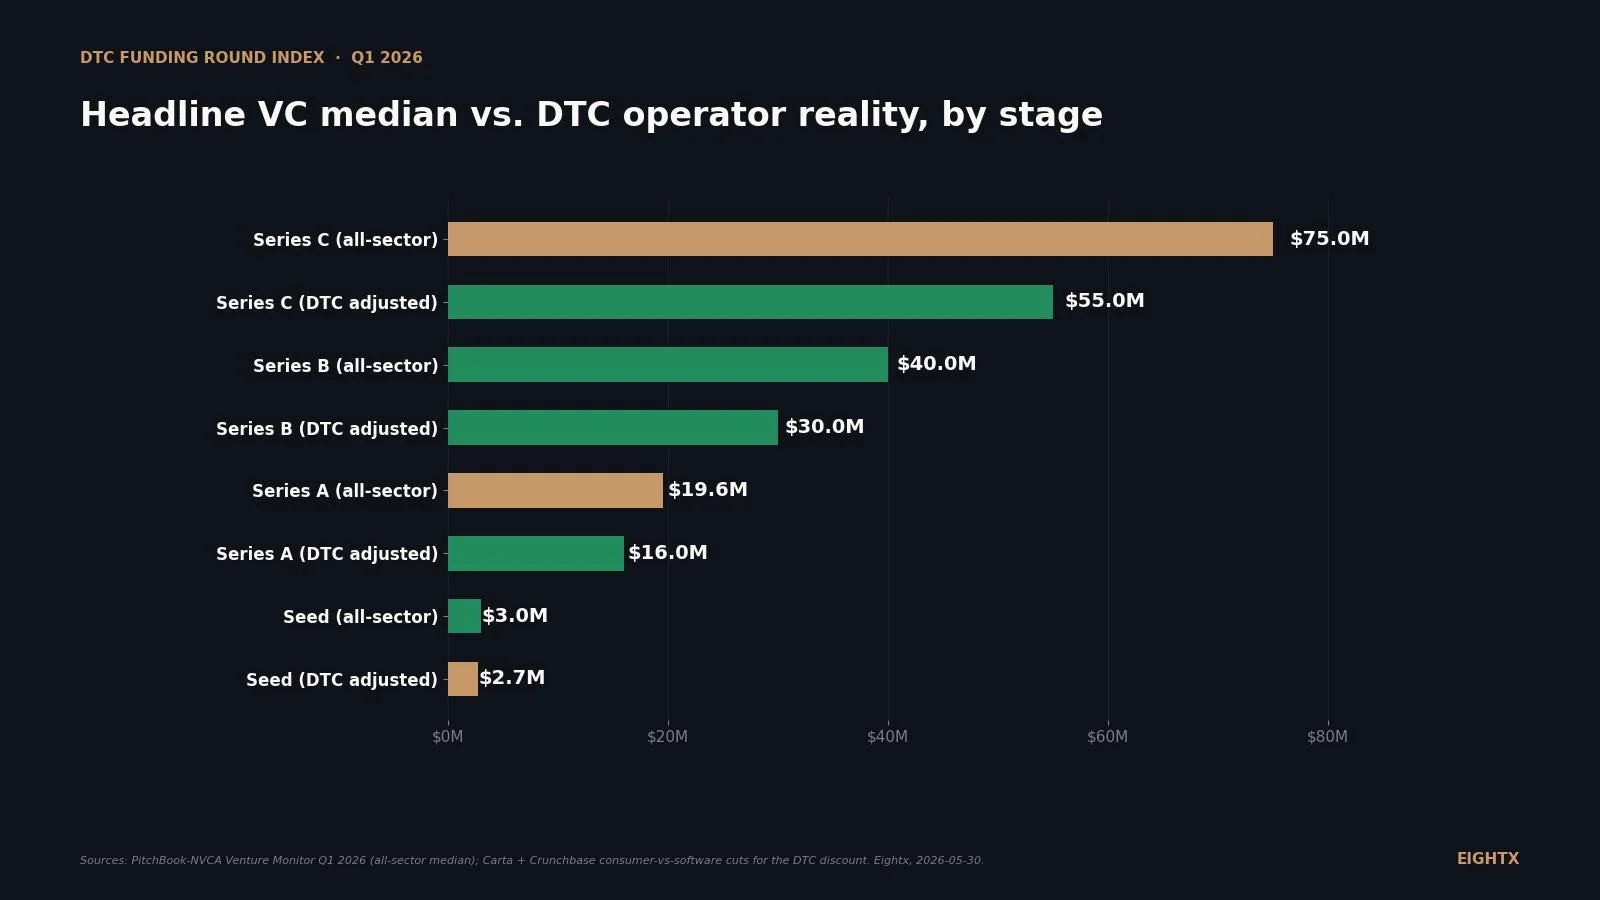
What DTC brands actually raise at pre-seed, seed, and Series A in 2026, why consumer rounds trail SaaS by 3-4x, and the revenue bar investors set at each stage.
The median US free shipping threshold hit $64 in 2025, from $45 for homeware to $140 for electronics. Category benchmarks plus the AOV-multiple rule for setting yours.
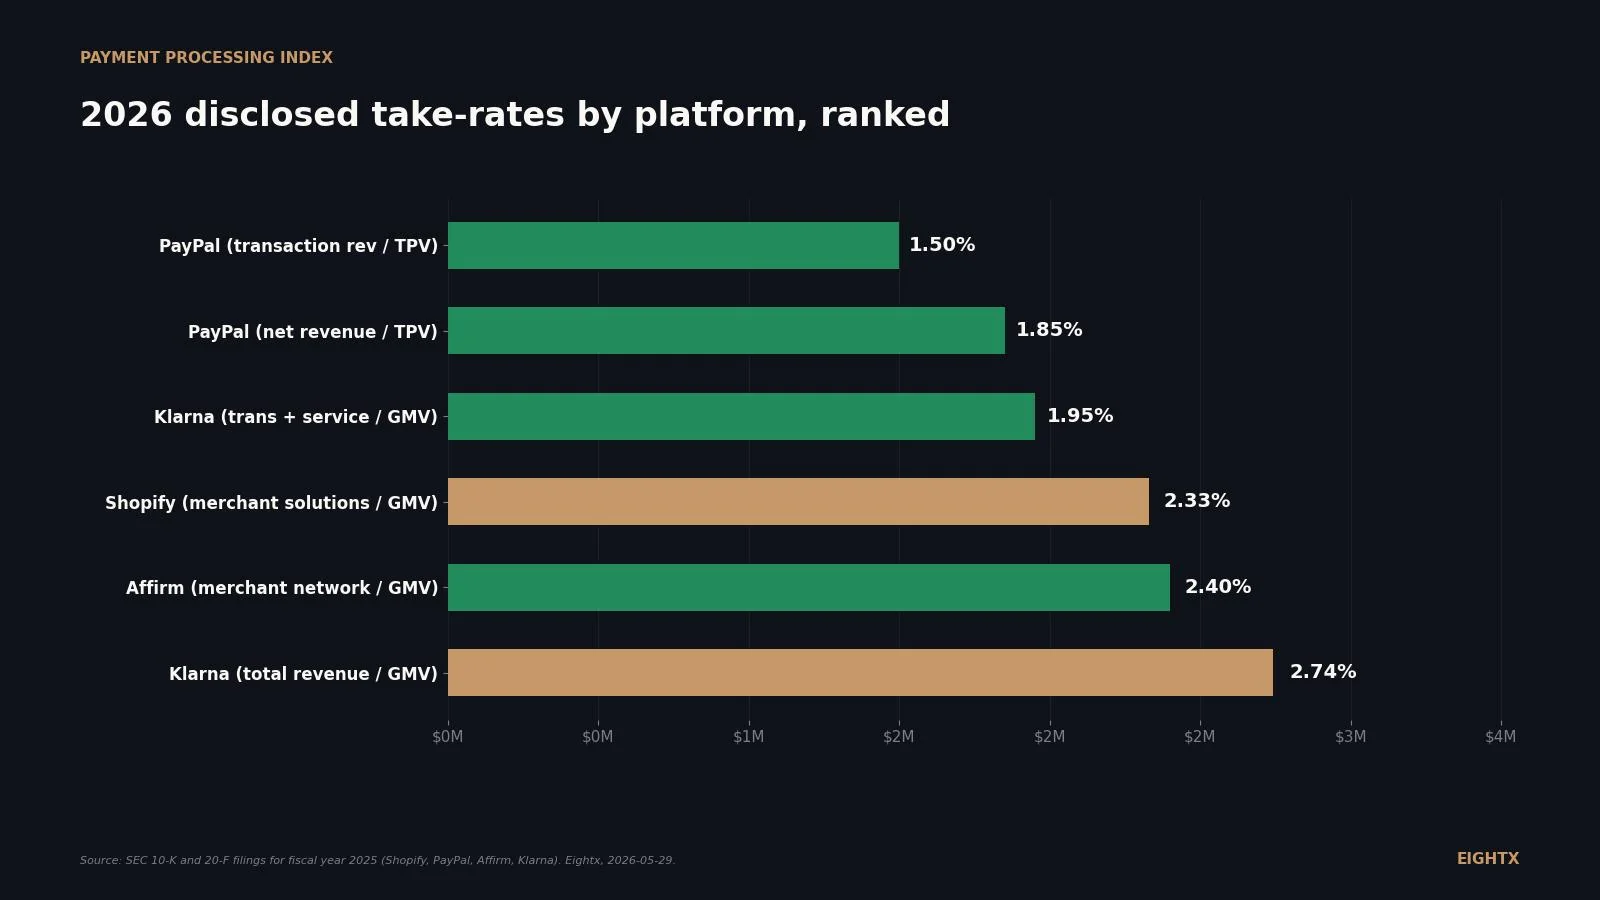
The headline is 2.9% plus 30 cents, but ecommerce brands actually pay 2.5% to 4.5% in processing fees. The 2026 benchmark and where to claw margin back.
TreeHouse Foods (THS) was taken private at $2.9B in Feb 2026. A CFO teardown of why 16% gross margins and $1.4B debt made the public equity story impossible.
Gildan acquired Hanesbrands ($4.4B EV, Dec 2025). CFO teardown of why the #1 US innerwear brand was worth more inside Gildan than as a standalone equity.
Energizer (ENR) holds #2 in US batteries with $2.95B FY2025 revenue and $3.2B net debt from its Rayovac and Armor All rollup. A CFO teardown of the delevering math.
Acushnet (GOLF): $2.56B revenue, 47.7% gross margin, and Pro V1 as the consumable moat. A CFO teardown of Titleist, FootJoy, and the risks the Street misses.
Carter's (NYSE: CRI) is the #1 US baby brand. A CFO teardown of operating margin collapse from 14.3% to 5.0%, a halved dividend, and three CEOs in 17 months.
What share of DTC revenue should come from returning customers? Benchmarks by vertical and brand stage, plus the 80% new-customer warning sign operators should watch.
Average days between orders by DTC vertical for 2026: ~30 days for supplements, 120 for apparel, 365+ for electronics. The interval that sets your win-back timing.
Purchase frequency benchmarks by DTC vertical: orders per customer per year and 12-month repeat rates for pet, supplements, beauty, apparel and home goods.
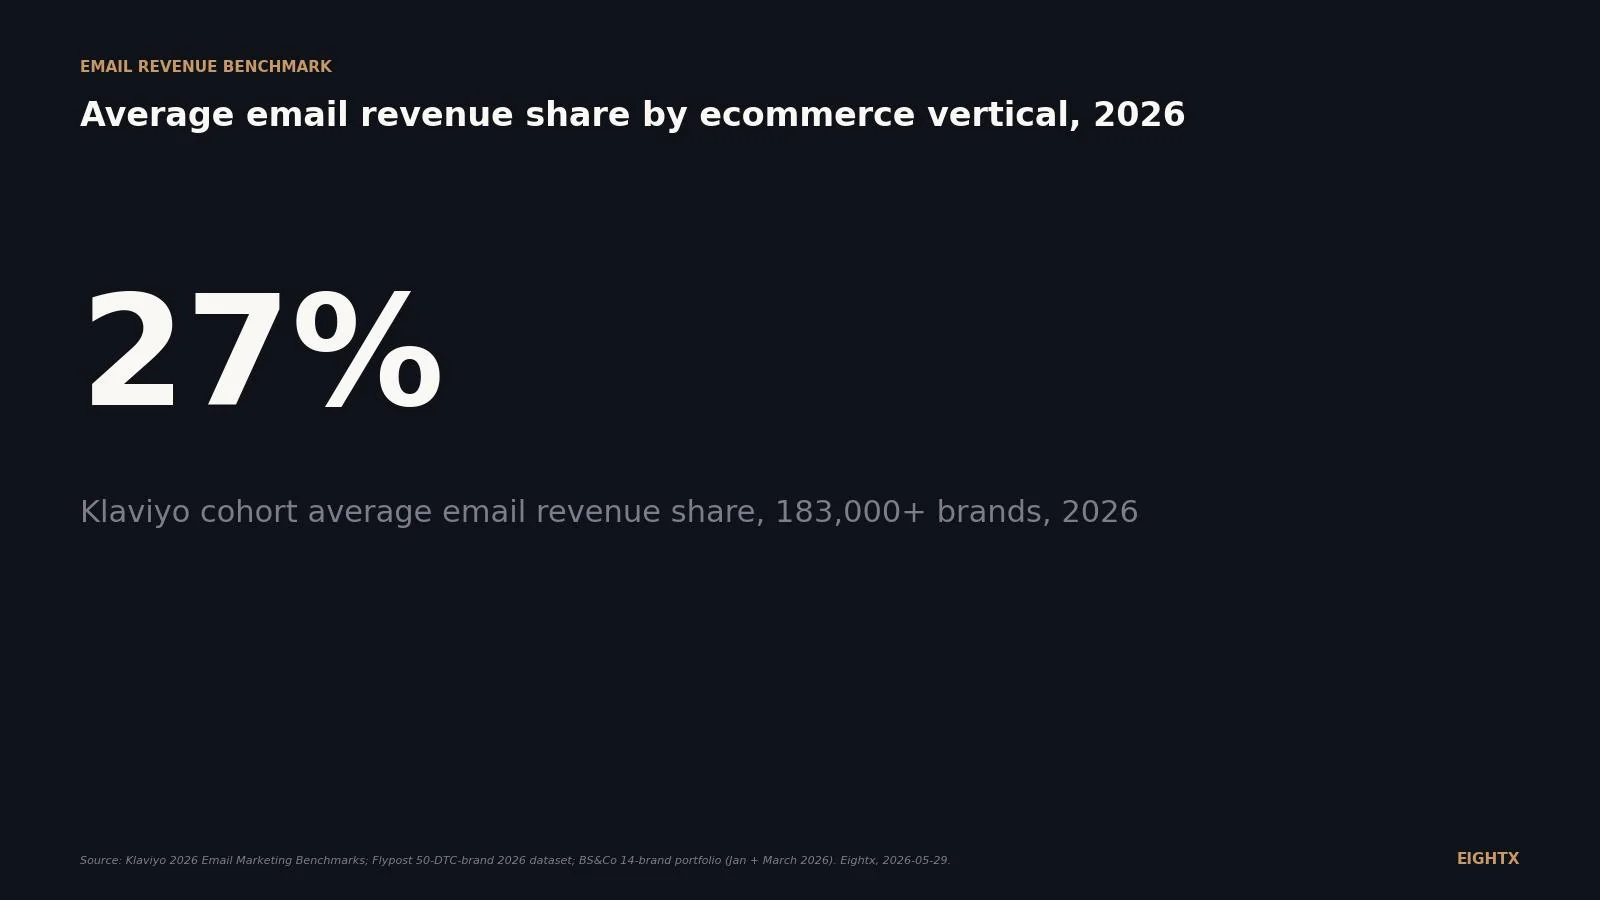
What share of DTC revenue should come from owned email and SMS? The healthy band is 20-40% (median ~28%), by vertical, list size, and program maturity, for 2026.
Creator and influencer spend benchmarks as a percentage of revenue, by DTC vertical. Why 2 to 3% is the mid-range, where beauty and supplements run higher, and how to cap it.
MER benchmarks by ecommerce vertical for 2026: what a healthy marketing efficiency ratio looks like in beauty, apparel, supplements, food, and home.
Automated Klaviyo flows drive about 41% of email revenue from just 5% of sends. Benchmarks for flow vs campaign split, revenue per recipient, and targets by stage.
Blended ROAS by ecommerce vertical: Home & Garden 6.70x, Apparel 4.50x, Beauty 2.82x, median 2.87x. Why your gross margin sets the floor, not the benchmark.
Average CAC by marketing channel in 2025: Meta about $53, Google about $62, TikTok about $46, email $8 to $15. How to read it against payback.
URBN posted record $6.17B revenue and 36% gross margins in FY2026. But the Urban Outfitters brand spent 3 years in comp decline. A CFO teardown.
Sally Beauty (SBH) holds $3.7B in revenue on price while transaction counts fall. A teardown of BSG's exclusivity moat, the pricing mask, and the store decline.
PetMeds (PETS) revenue fell 21% to $179M in FY2026. A teardown of the dividend suspension, a failed $36M acquisition, and a going-concern-adjacent cash crunch.
Olaplex peaked at $704M revenue in FY2022 and fell to $423M by FY2025 - a 40% decline. A CFO's teardown of what caused it and what the Henkel deal means.
Helen of Troy (HELE) took $885.9M in impairment charges in FY2026, wiping out a decade of goodwill. A CFO teardown of OXO, Hydro Flask, and a $786M debt wall.
Meta commands 61-72% of DTC ad spend. TikTok is just 2.3% at the median. See how your channel mix stacks up against $231M in tracked spend.
Funko (FNKO) peaked at $1.32B in FY2022, physically destroyed its own inventory, and has shed 31% of revenue since. A CFO teardown of the licensing trap.
Edgewell (NYSE: EPC) is the #2 in wet shave with $2.2B in revenue, a 2028 refinancing cliff, and goodwill at 7% headroom. A CFO-grade teardown.
Church & Dwight (CHD) posted $6.2B in FY2025 revenue and $1.2B operating cash flow - but wrote off $768M in acquisitions in 4 years. A CFO-grade teardown.
Boot Barn hit $2.25B revenue and a record $7.35 EPS in FY2026. A teardown of its exclusive brand moat, same-store sales cycle, and tariff exposure.
HydraFacial maker Beauty Health (SKIN) posted a 65.3% gross margin in FY2025 but device sales fell 57% from peak. A teardown of the razor/blade math.
AEO posted $5.55B in FY2025 revenue but a single Q1 inventory write-down erased a year of margin progress. A CFO-grade teardown of the brand duality.
Revolve (RVLV) hit $1.226B in FY2025 revenue, but operating margin is 6.1% - nearly half the FY2021 peak. A CFO teardown of the influencer flywheel.
Purple Innovation's FY2025 gross margin hit 40.2% - but the company posted a $51.4M net loss and its first-ever going-concern qualification. Here's why.
The Honest Company exited its own website in 2025. Now Amazon is 39% of revenue and Target is 28%. A CFO teardown of what that concentration actually means.
FIGS hit $631M revenue in FY2025 with a 66.5% gross margin - but that margin has fallen every year since the 2021 IPO. A CFO's teardown of the premium scrubs brand.
BellRing Brands hit $2.3B revenue in FY2025 on a 16% CAGR. A CFO's teardown of the margin cycle, the debt-funded buyback, and customer concentration risk.
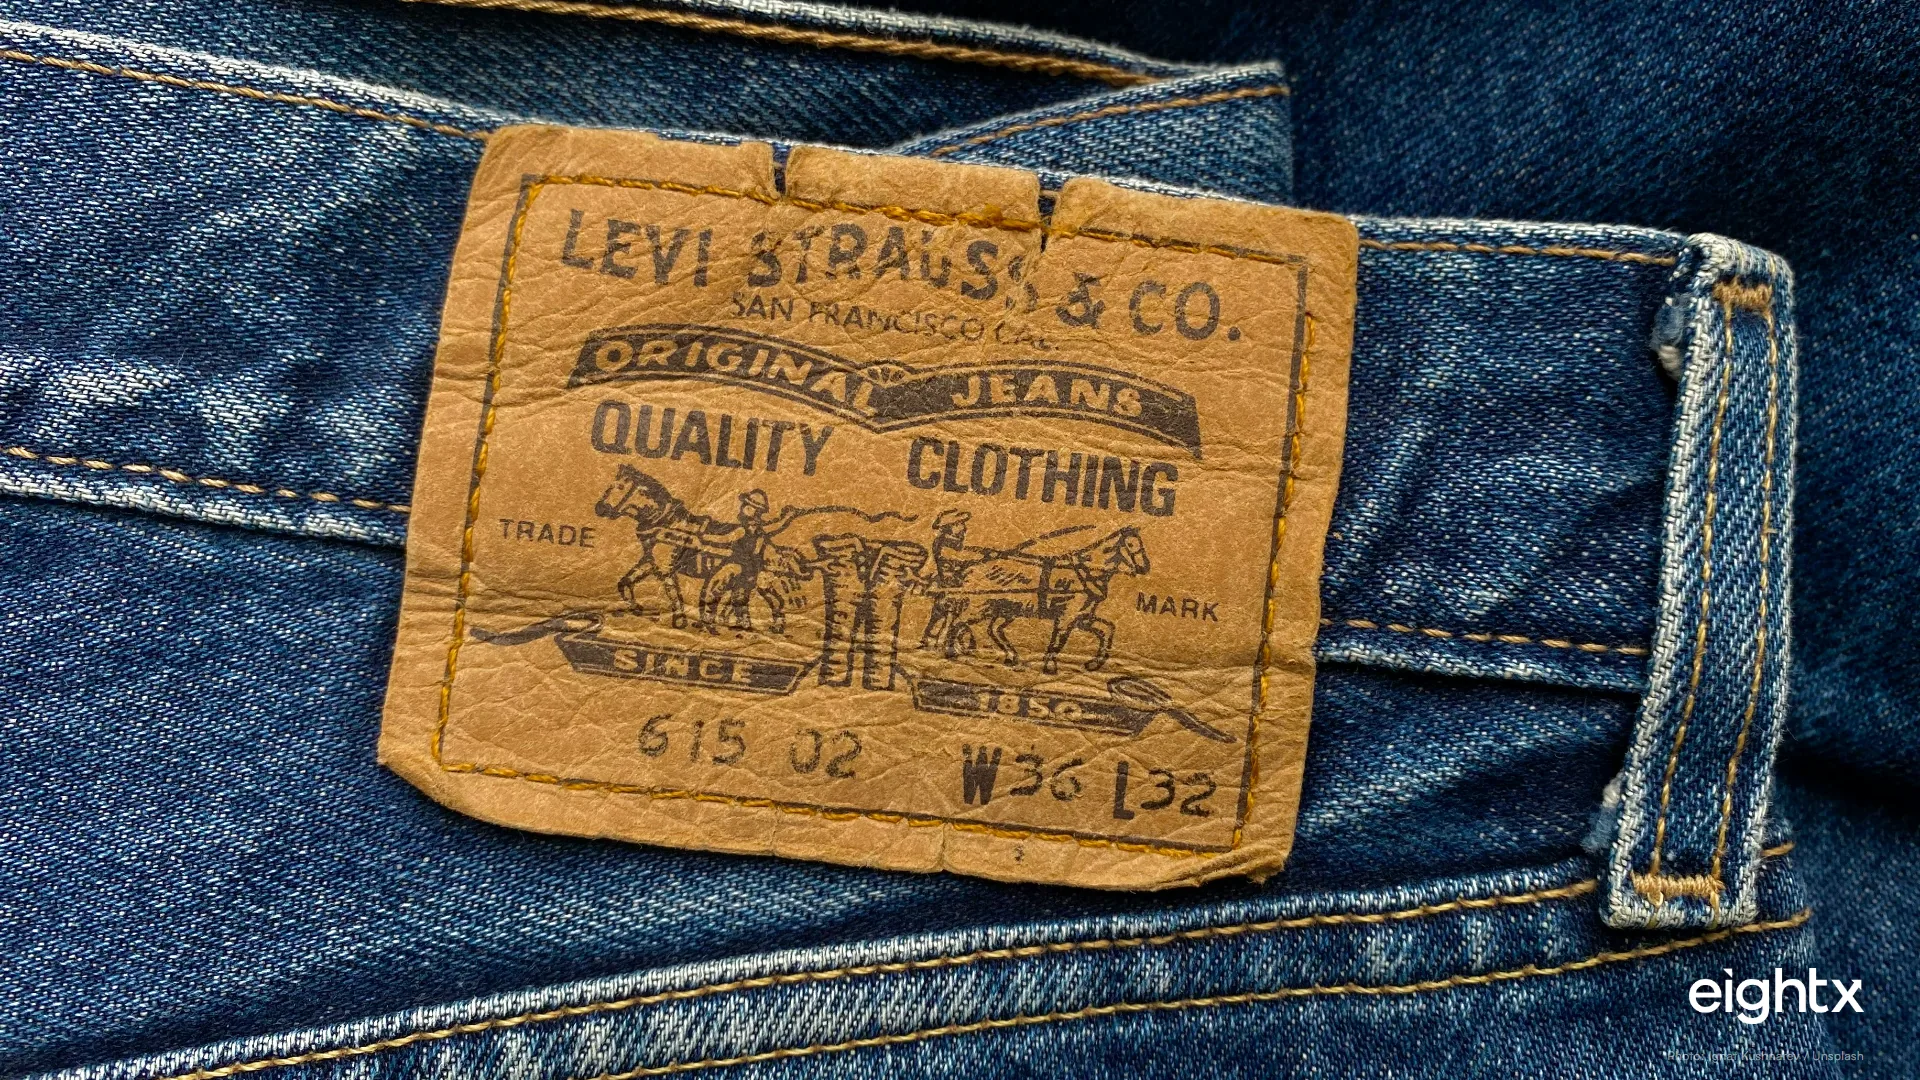
Levi Strauss hit a record 61.7% gross margin in FY2025 - driven by DTC mix shift. A CFO teardown of the strategy, the tariff threat, and what breaks first.
Etsy grew revenue +24% from FY2021 to FY2025 while GMS fell 12% from peak. A CFO teardown of the take-rate offset engine and what comes next.
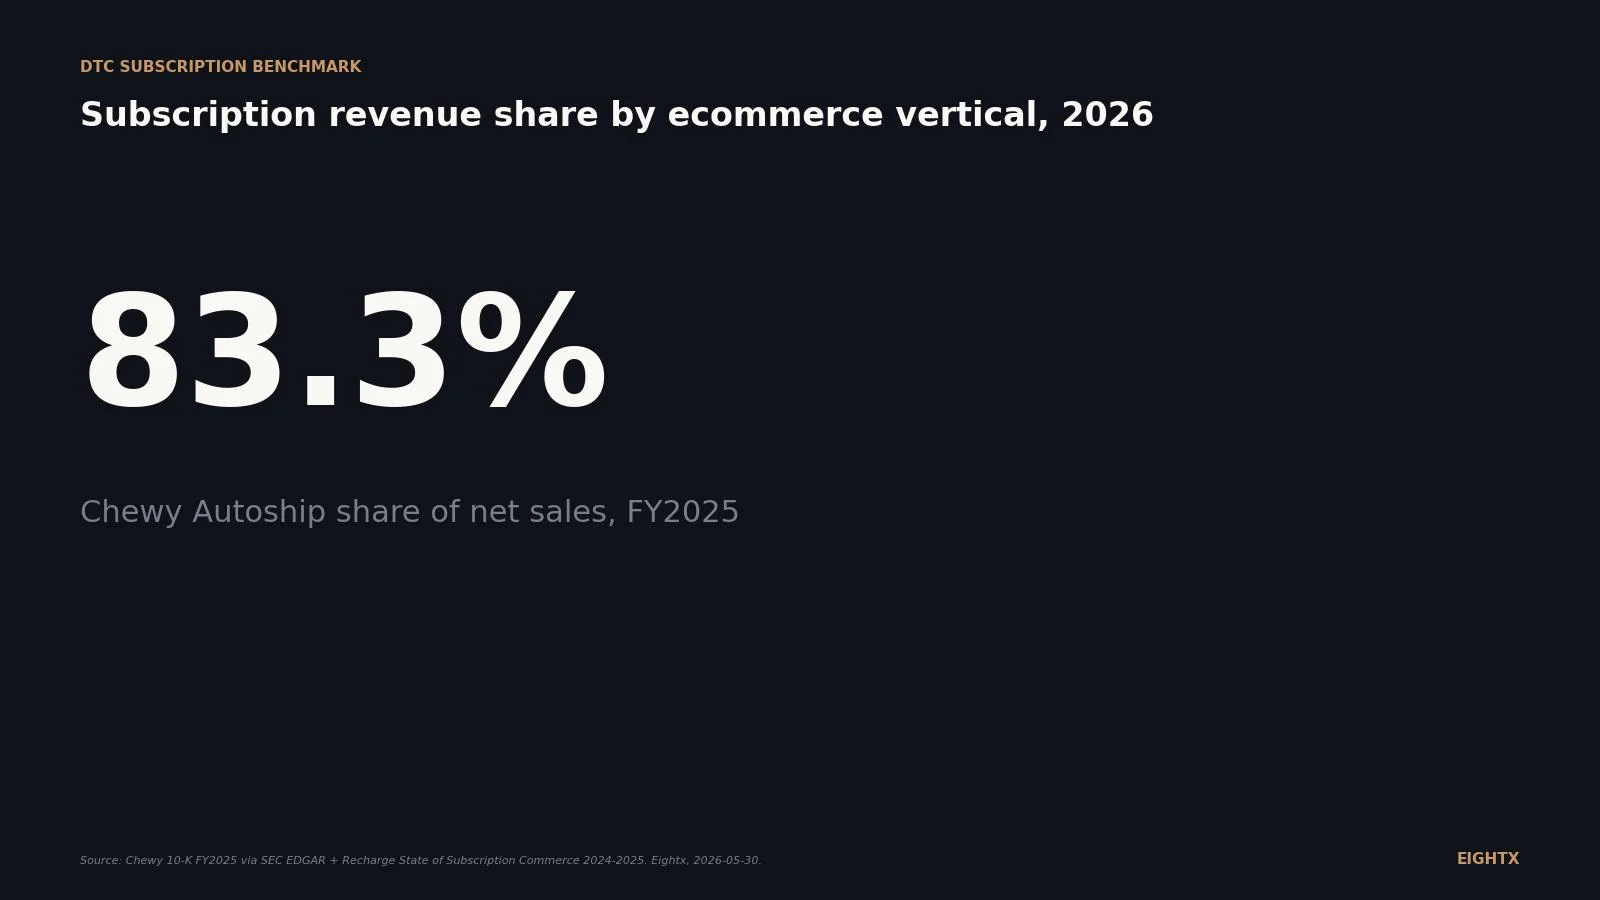
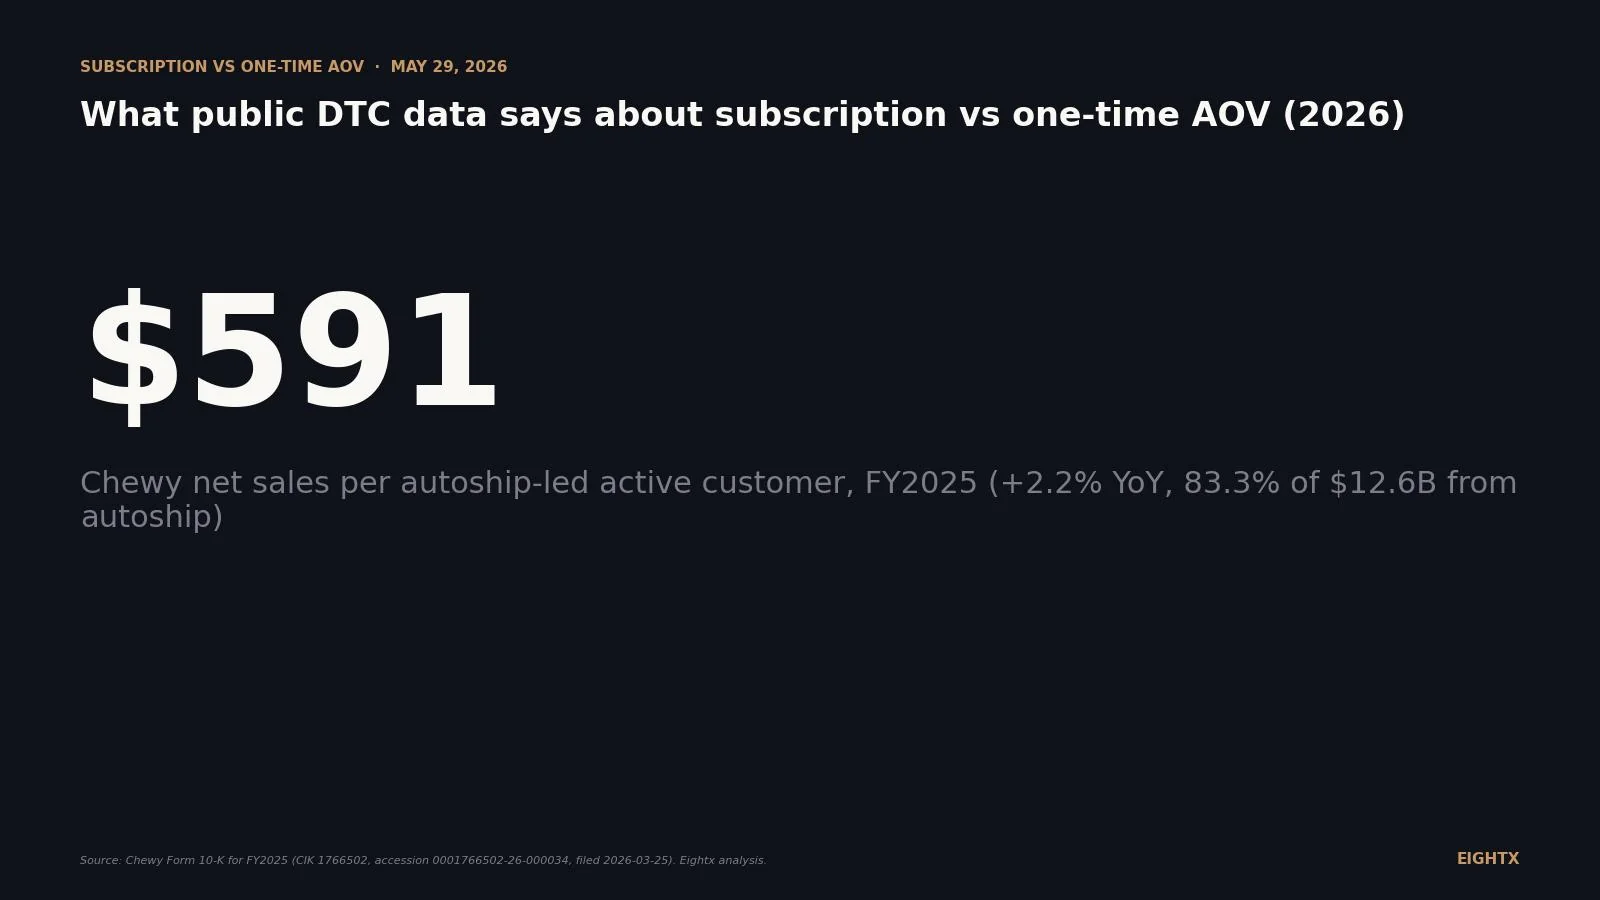
Chewy hit $12.6B revenue and $562M FCF in FY2025 on an 83% Autoship mix. A CFO's teardown of the subscription engine, the vet bet, and NSPAC deceleration.
BARK (NYSE: BARK) hit 68.4% DTC margin in FY2026 yet lost $39M on $394.8M revenue. A teardown of the order collapse, liquidity cliff, and profitability bet.
Kenvue (KVUE) posted its first organic revenue decline in FY2025. A teardown of Tylenol's regulatory risk, a fading skin segment, and the Kimberly-Clark sale.
Stitch Fix (SFIX) fell from $2.1B to $1.27B in four years. A CFO's teardown of the self-inflicted Freestyle pivot and whether Q3 FY2026 signals a real floor.
Monster Beverage hit $8.29B revenue and 55.8% gross margin in FY2025 after absorbing a 580bp cost shock and a US share scare. A CFO teardown of the moat.
Ulta Beauty hit a 16.1% operating margin peak in FY2022. Four years later it is 12.4%. A CFO's teardown of whether the compression is structural or cyclical.
Lululemon hit $11.1B revenue in FY2025 with zero debt, but Americas comps fell -3% and tariffs destroyed $275M of gross profit. A CFO's teardown of the squeeze.
Warby Parker hit $871.9M in FY2025 revenue with ARPC up 23% in three years - yet has never posted a full-year GAAP operating profit. A CFO's teardown of the DTC eyewear model.
e.l.f. Beauty hit $1.64B revenue in FY2026 at a 71% gross margin, but operating margin fell to 4.5% and growth turned debt-financed. A CFO's teardown.
YETI grew to $1.87B revenue at a 57% gross margin, but tariffs, a first-ever US Drinkware decline, and a China supply-chain pivot all arrived at once. A CFO's teardown.
Vital Farms hit $759M revenue and 37.6% gross margin in FY2025, then swung to a $2.3M operating loss in Q1 2026. A CFO's teardown of the pasture-raised moat.
Celsius hit $2.5B revenue in FY2025, but ~$1B was Alani Nu channel-fill and operating margin fell to 6%. A CFO's teardown of growth bought, not earned.
Hims & Hers hit $2.35B revenue and 73.8% gross margin in FY2025, then swung to a $92M net loss in Q1 2026. A CFO's teardown of the GLP-1 loophole and what survives it.
On June 10, 2026, Visa embedded its network in ChatGPT so AI agents can buy across 175M+ merchants. What agentic commerce means for DTC brands, attribution and margin.
Knix is launching KT by Knix in 350+ Target stores, its biggest wholesale deal yet, after passing $1B in DTC sales. What the DTC-to-wholesale pivot means for your margins.
Reddit opened its Shopify ad integration to all merchants in May 2026 as ad revenue hit $625M (+74% YoY). What the low-friction channel means for DTC ad budgets.
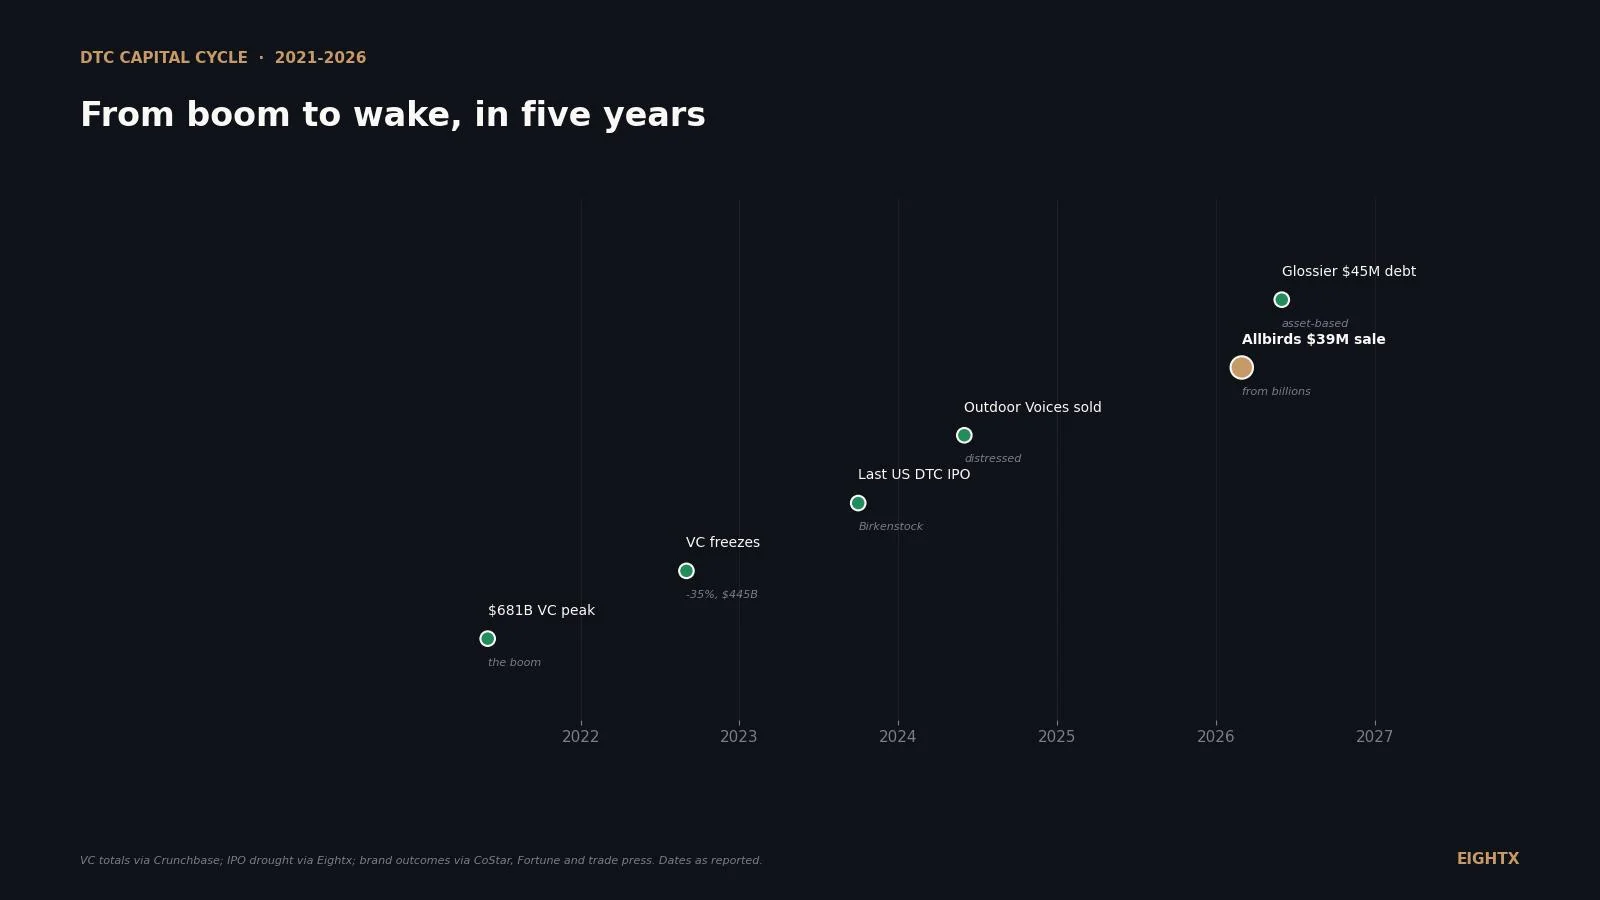
Two unrelated firms named Tiger bookend the DTC era: one funded the boom, one runs the wake. The arc from VC darling to asset-based debt to liquidation, and what it signals.
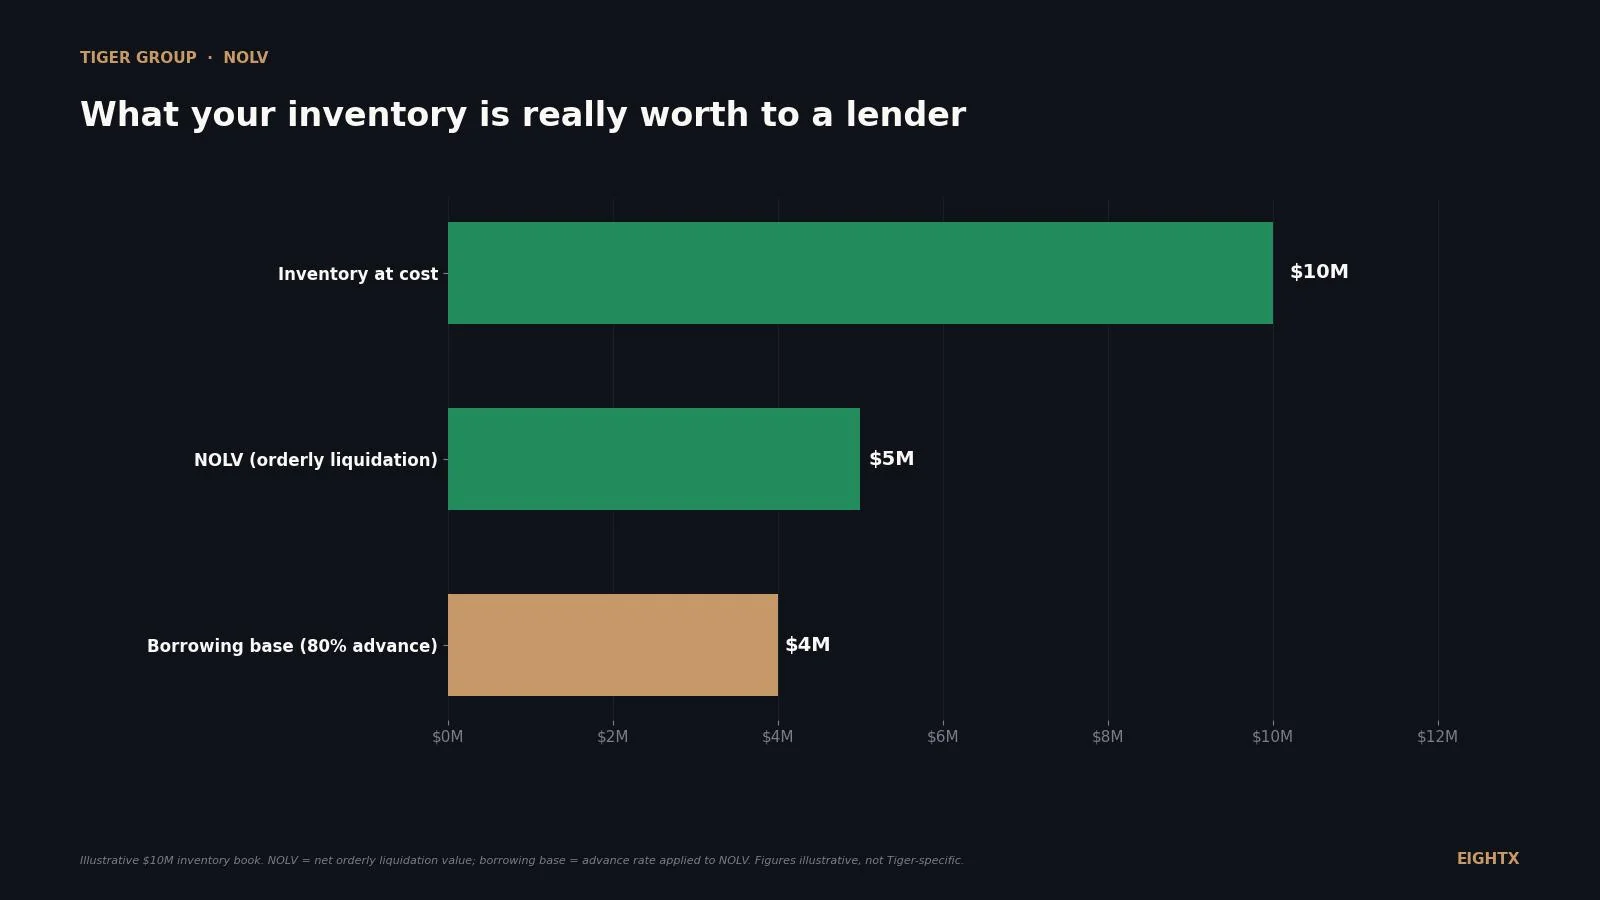
Tiger Group appraises, lends to (via Tiger Finance), and liquidates consumer brands. What the firm does, the number behind it all (NOLV), and what it means when they show up.
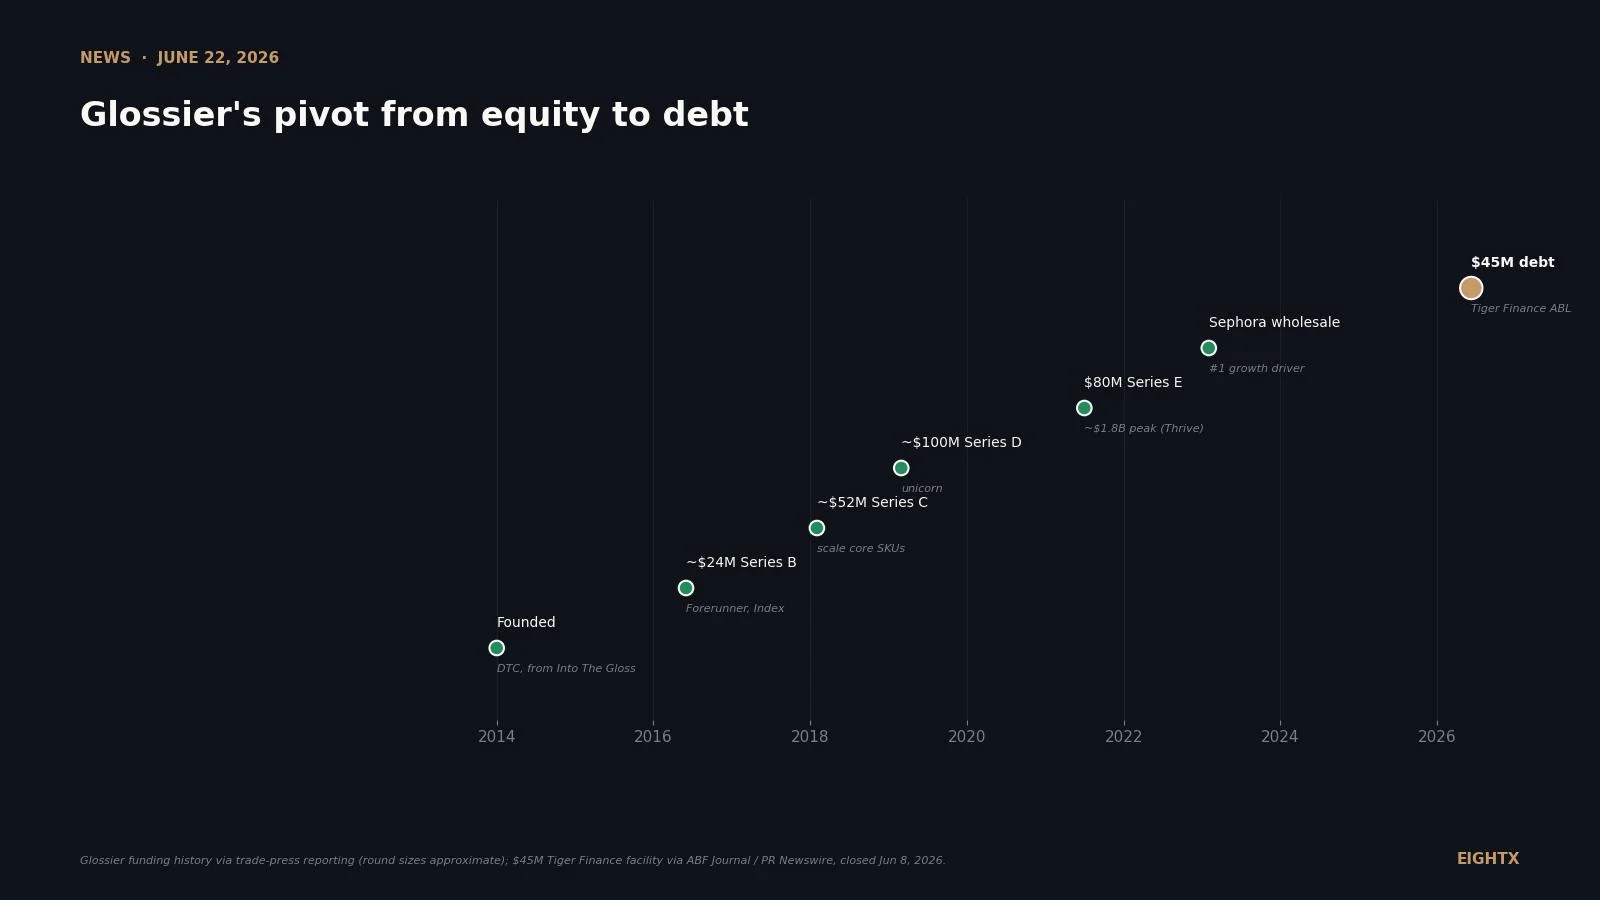
Glossier raised a $45M asset-based credit line from Tiger Finance in June 2026 instead of more equity. What the debt-over-dilution call means for DTC operators.
New Zealand publishes no national return rate. Here is the working per-order benchmark by category, how NZ compares to the US and UK, and what each return costs your margin.
NZ's online conversion rate sits at 1.5%, below the global average. The 2026 KPI benchmark for Kiwi DTC stores: conversion, AOV, CAC, margin and LTV:CAC in NZD.
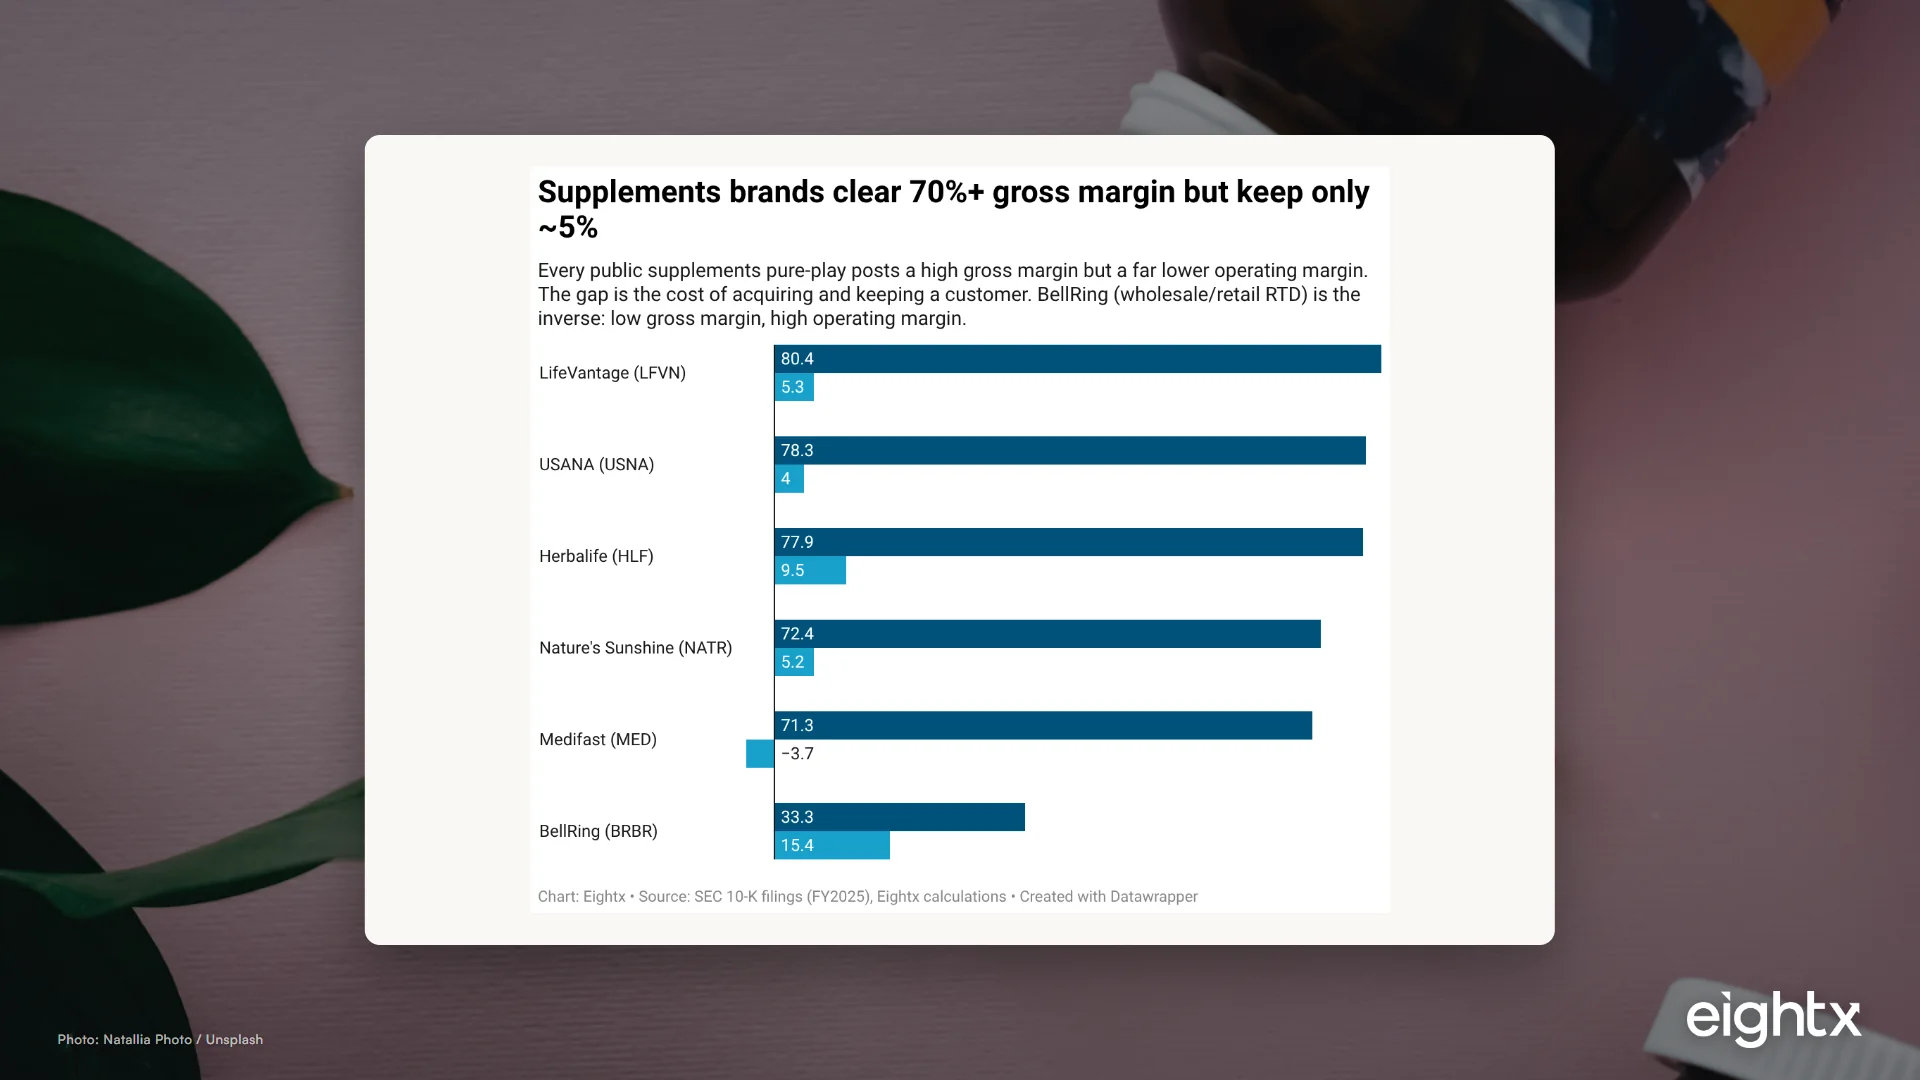
Supplements clear 75% gross margin but keep just 5% operating margin. A CFO's guide to the CAC, LTV:CAC, contribution margin and payback that decide profit.
Public supplements brands turn inventory just 2.2x-3.0x a year. The CFO playbook on days-on-hand, reorder points, MOQ, and the expiry cash trap for DTC supplement brands.
Public supplement brands clear 71-80% gross margin but keep ~5% operating margin. How to price for contribution margin and CAC payback, not a vanity GM number.
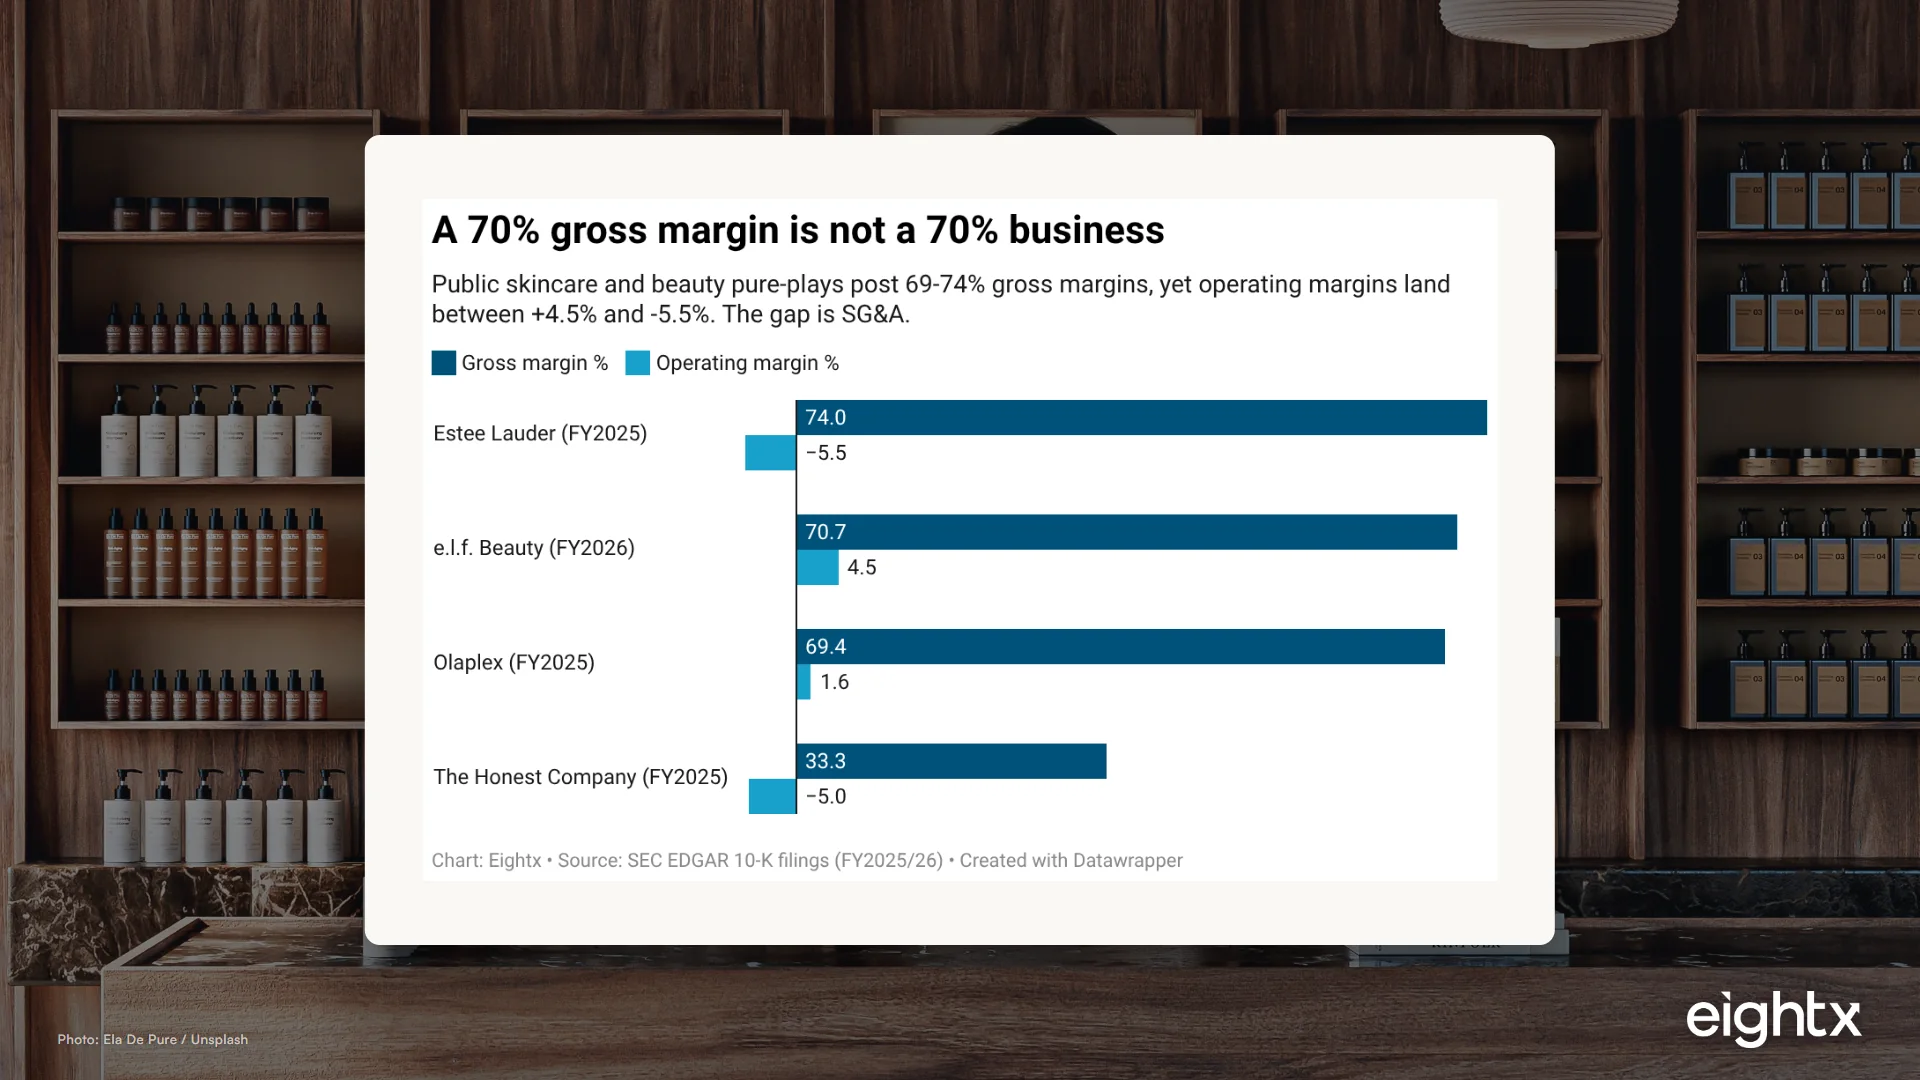
Skincare brands clear 65-74% gross margin but routinely earn low-single-digit operating margin. The CFO pricing playbook: floor, tiers, discounts and the LTV:CAC test.
How to price a pet brand across DTC, wholesale and MAP. Public pet gross margins run 29.8% to 61.3%, but the highest-margin name still loses money. CFO math.
Why a supplements brand can post a 75% gross margin and still run out of cash. The cash conversion cycle, deposits, lead times and MOQs, explained.
Skincare posts 69-74% gross margins yet ties up 126-213 days of inventory. A fractional CFO's guide to the cash conversion cycle that decides if margin becomes cash.
A 7-step method to forecast ecommerce cash flow with a worked example. Model when cash lands (Shopify T+2 to T+5, Amazon settlement) and catch the trough early.
A worked cash flow forecast example for ecommerce: build a rolling 13-week direct model and map channel payout lag and inventory timing to find your cash trough.
Public skincare brands sit on 126 to 213 days of inventory. Here is how to set days-on-hand targets, safety stock, and reorder points to free trapped cash.
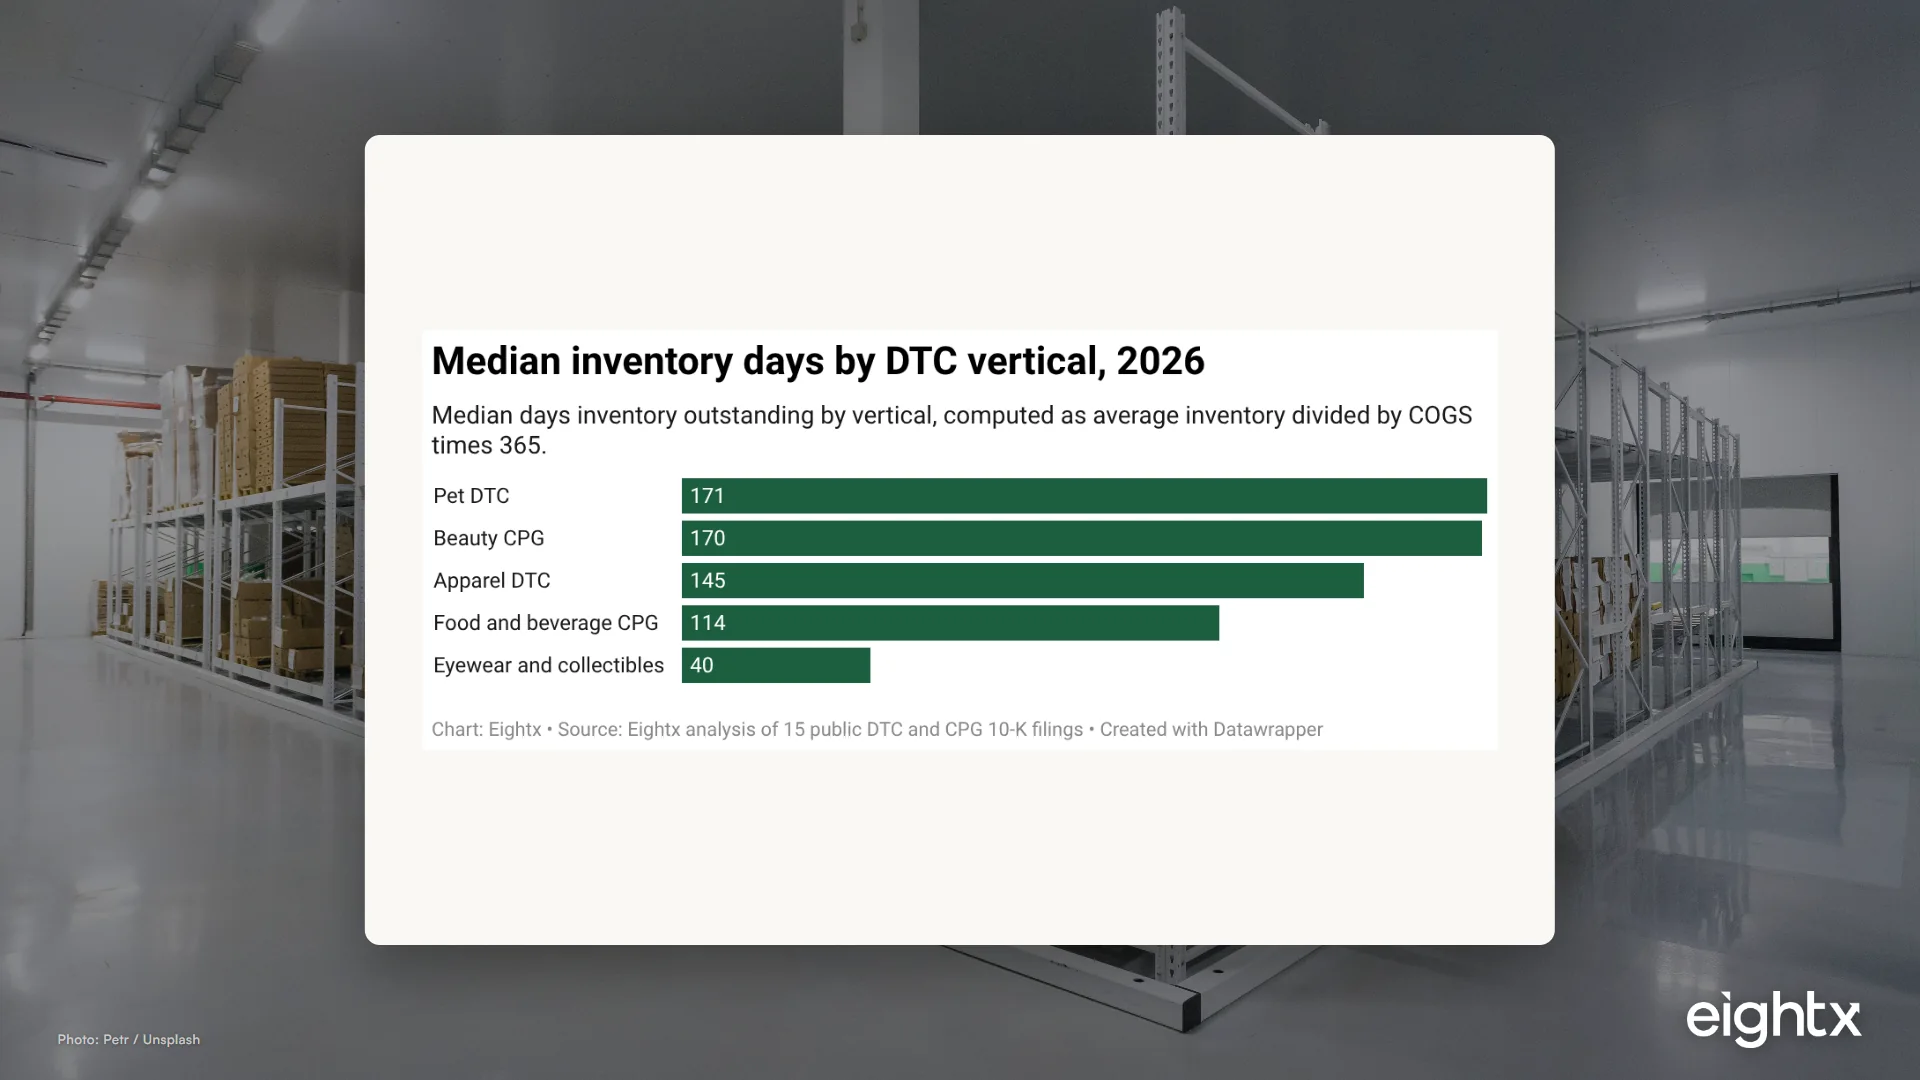
The median pet brand carries 171 days of inventory, the slackest of any DTC vertical. Here is the turns target, the autoship lesson, and the shelf-life trap.
Jewelry inventory runs 75 to 186 days across the public comps. Build an open-to-buy budget, set days-of-inventory targets, and stop freezing cash in your vault.
Home goods brands turn inventory just 2.5 to 3.3x a year. Here is how to plan turns, safety stock, open-to-buy, and the 2026 tariff layer so you do not run out of cash.
Footwear turns inventory just 4-5x a year, ties up 20-35% of COGS, and runs 4-9 month lead times. The size-run math that decides a DTC shoe brand's cash flow.
Food turns inventory 4.5x to 20x a year (18 to 82 days) while beauty sits near 170. How to size perishable inventory to shelf life, safety stock, and cash.
Sonos cut inventory 49% and still wrote down $33.3M. The 2026 CFO playbook for electronics inventory: 3.5x turns, the obsolescence clock, safety stock, and tariffs.
Green coffee nearly doubled in 18 months and lead time runs 4-8+ weeks. The CFO math for safety stock, reorder points and how much coffee inventory to fund.
Beverage brands turn inventory 3.9x to 9.5x a year. The operator guide to turns, days of cover, safety stock and the co-packer MOQ that traps your cash.
Public beauty brands turn inventory ~2.1-3.4x a year (168+ days). Here's the per-SKU days-on-hand system that gets a private beauty brand to 45-70 days.
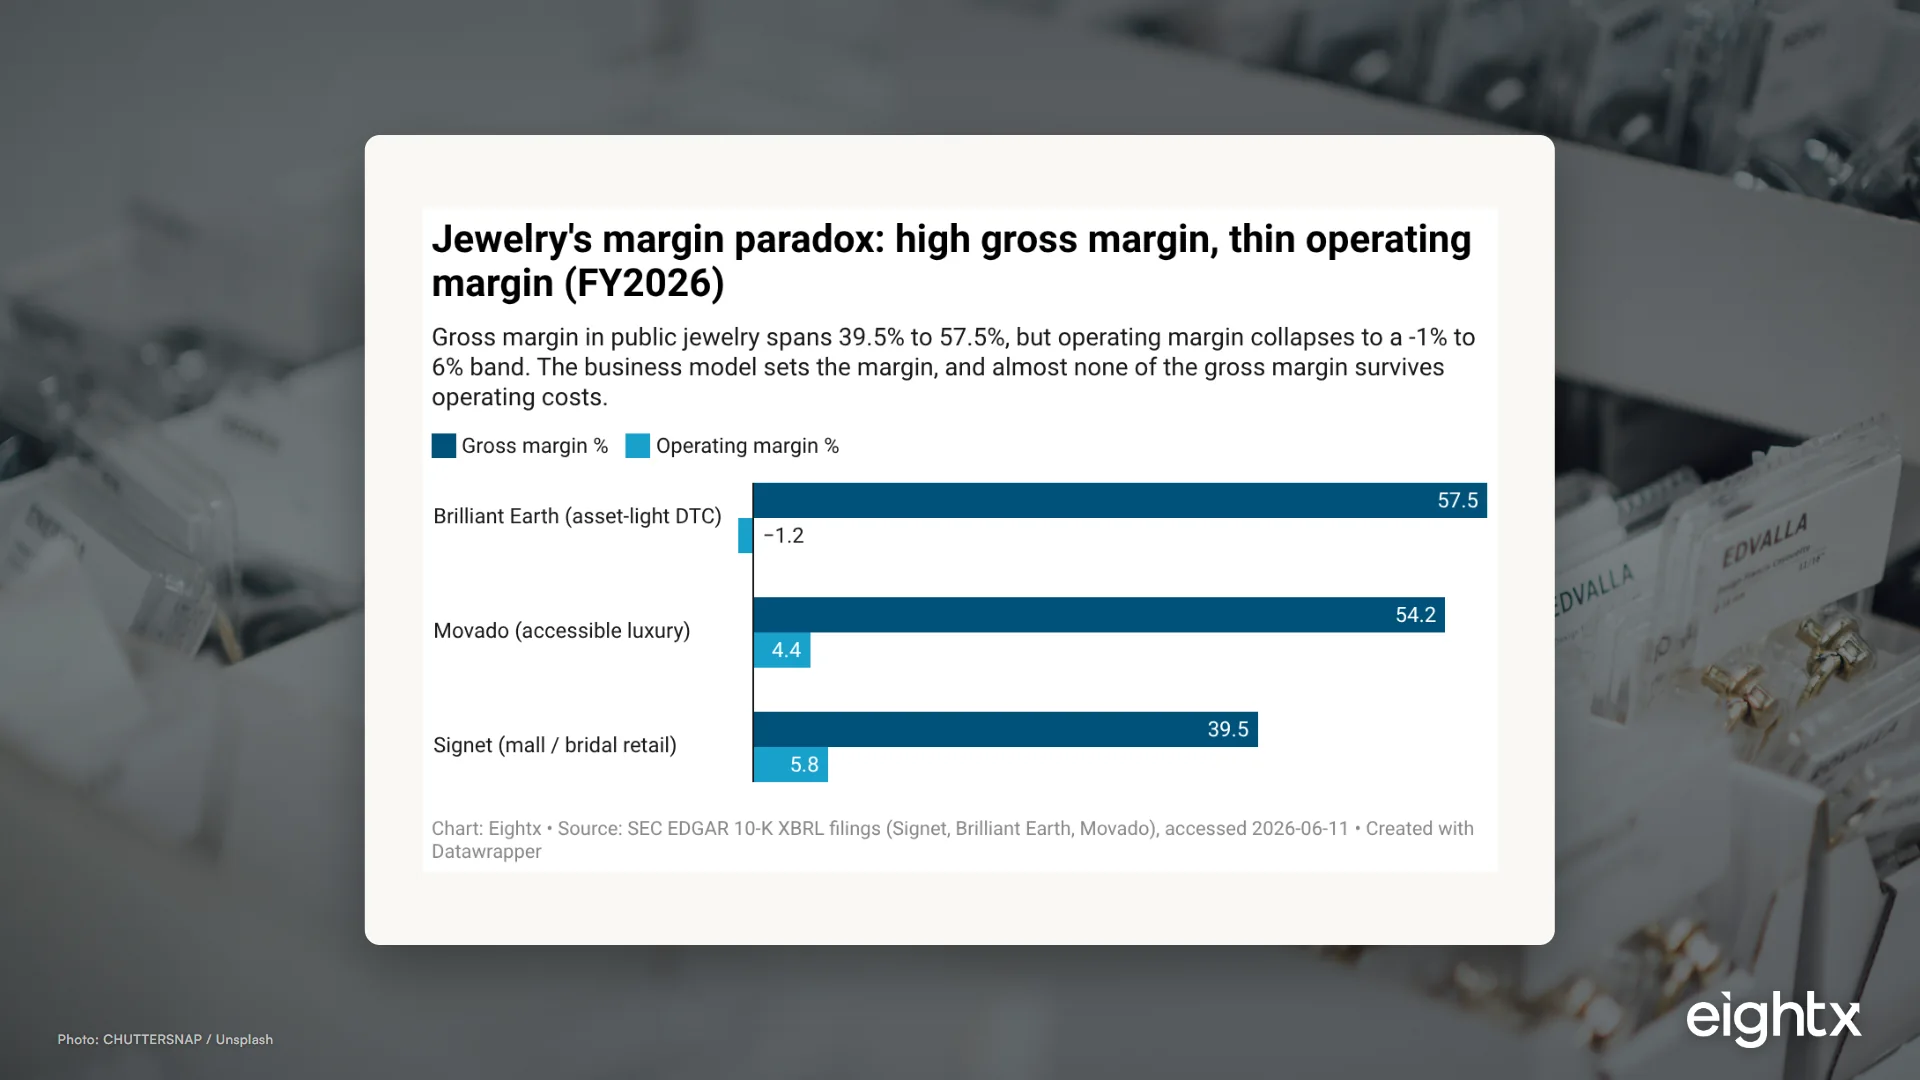
Public jewelry comps earn 39.5% to 57.5% gross margin but barely 6% operating margin. With gold up 54%, here's how to price jewelry to the margin you actually keep.
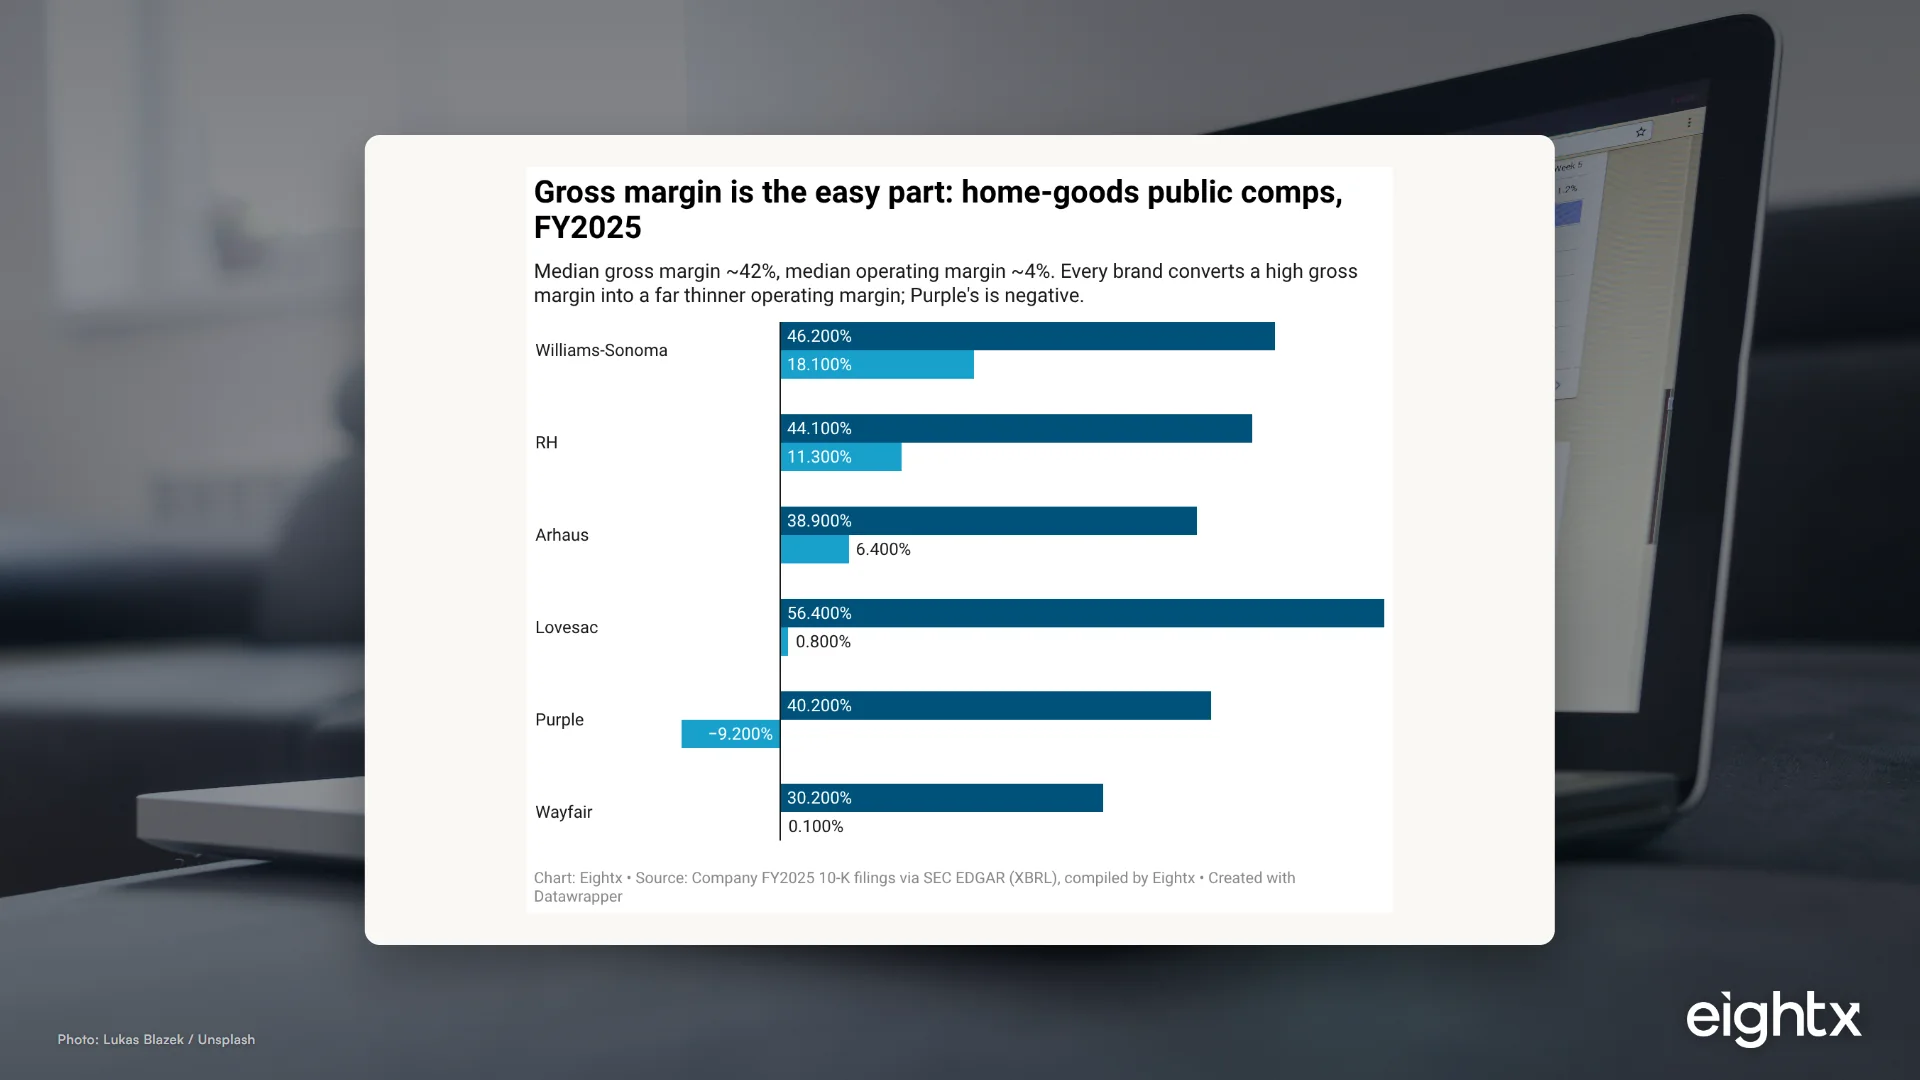
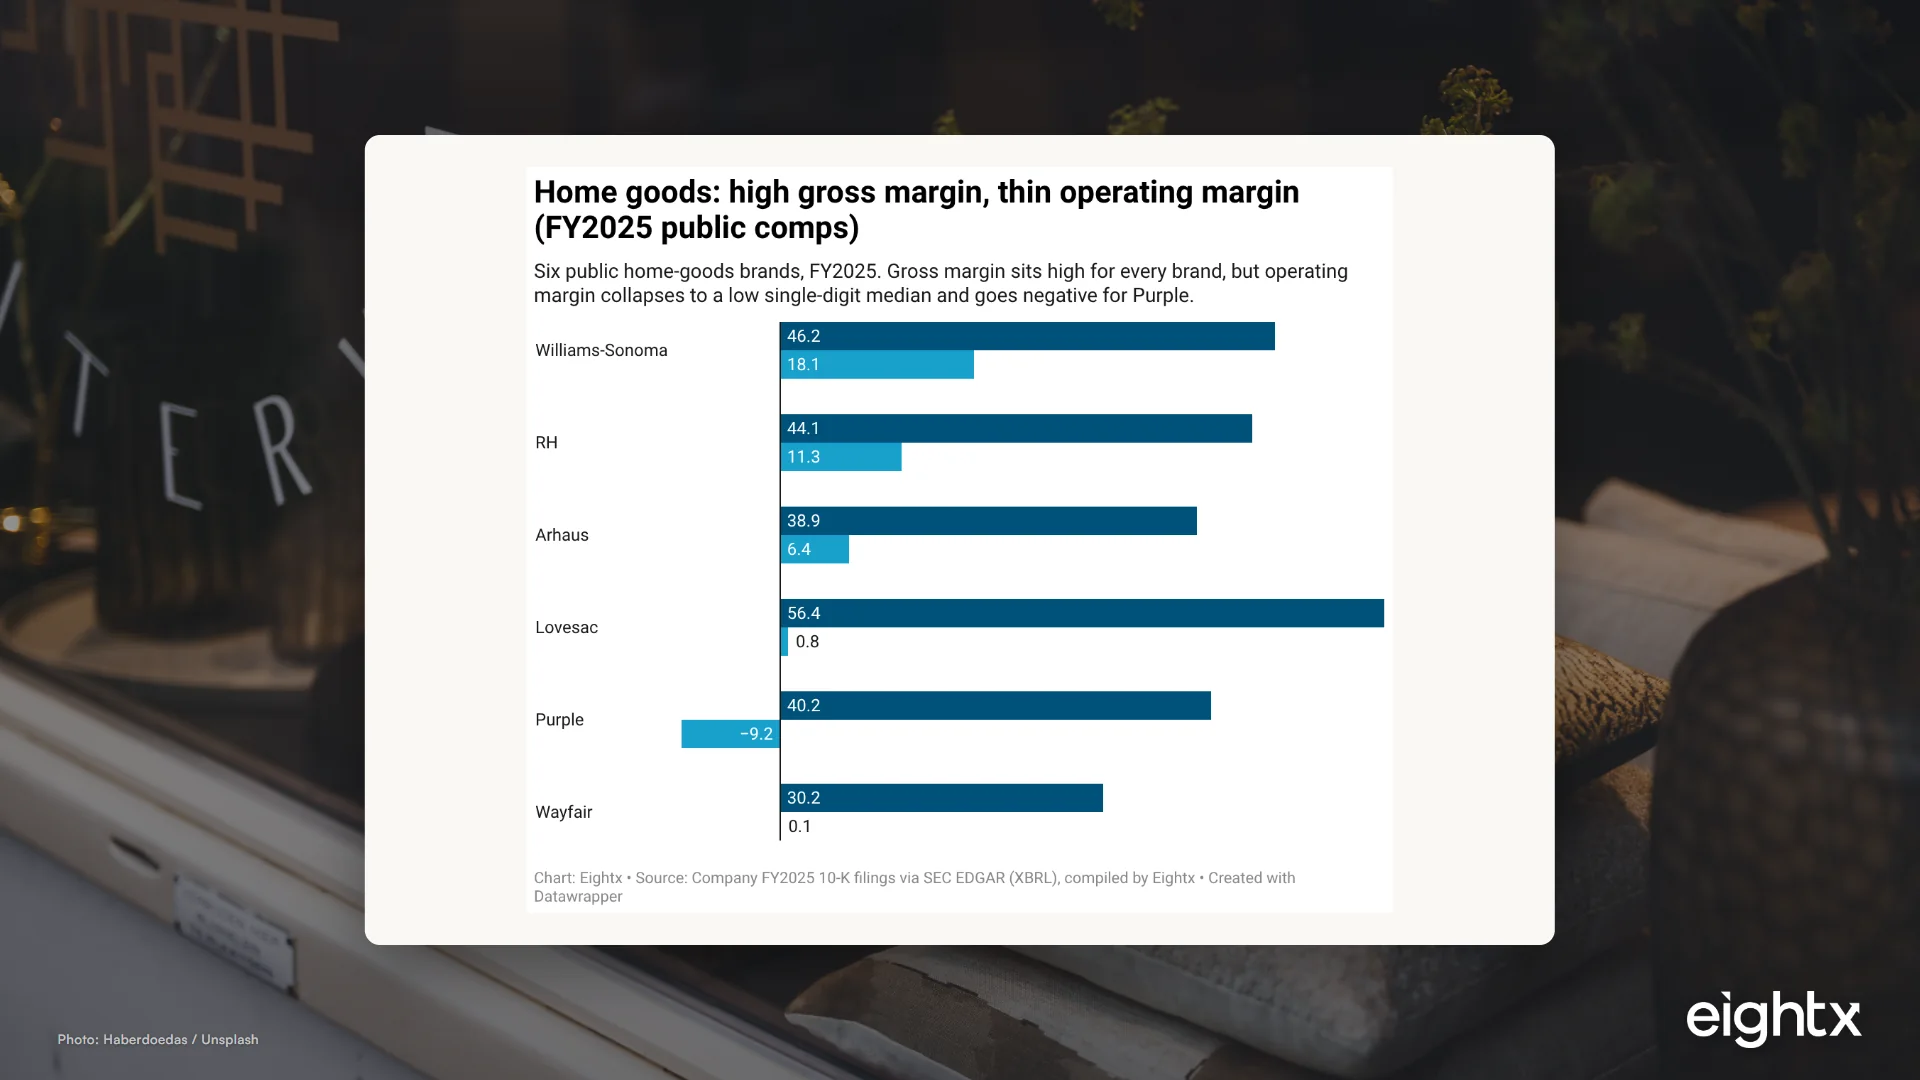
Home-goods gross margin runs ~42% but operating margin medians ~3.6%. Why keystone breaks on freight and a 22.7% return rate, and the price-floor formula.
Why keystone pricing underprices DTC shoes in 2026: the landed-cost-multiple ladder, wholesale math, MAP, tariffs, and a markdown cadence that defends margin.
Pet brands have margin but no cash. The public comps show why: a 29.8% gross margin throws off $562M of free cash flow when 83.3% of revenue is recurring autoship.
A jewelry brand can post 50%+ margins, sell out its holiday assortment, and still hit a cash wall in March. The CFO playbook for the seasonality and inventory trap.
Home goods brands tie up cash for 80-110 days. Williams-Sonoma runs a 56-day cash cycle, Arhaus 90, Wayfair -49. Here's how to measure and shrink yours.
Why a profitable shoe brand still runs out of cash. The footwear cash conversion cycle runs 43-98 days at public comps. The CFO playbook to close the gap.
Why food brands run dry while still profitable. The cash conversion cycle for public food brands runs 14 to 71 days; the DTC food median is about 86.
Ecommerce CAC is up 40-60% since 2023. Reduce it without cutting ad spend by working four levers: conversion, AOV, repeat rate, and channel mix. With the math.
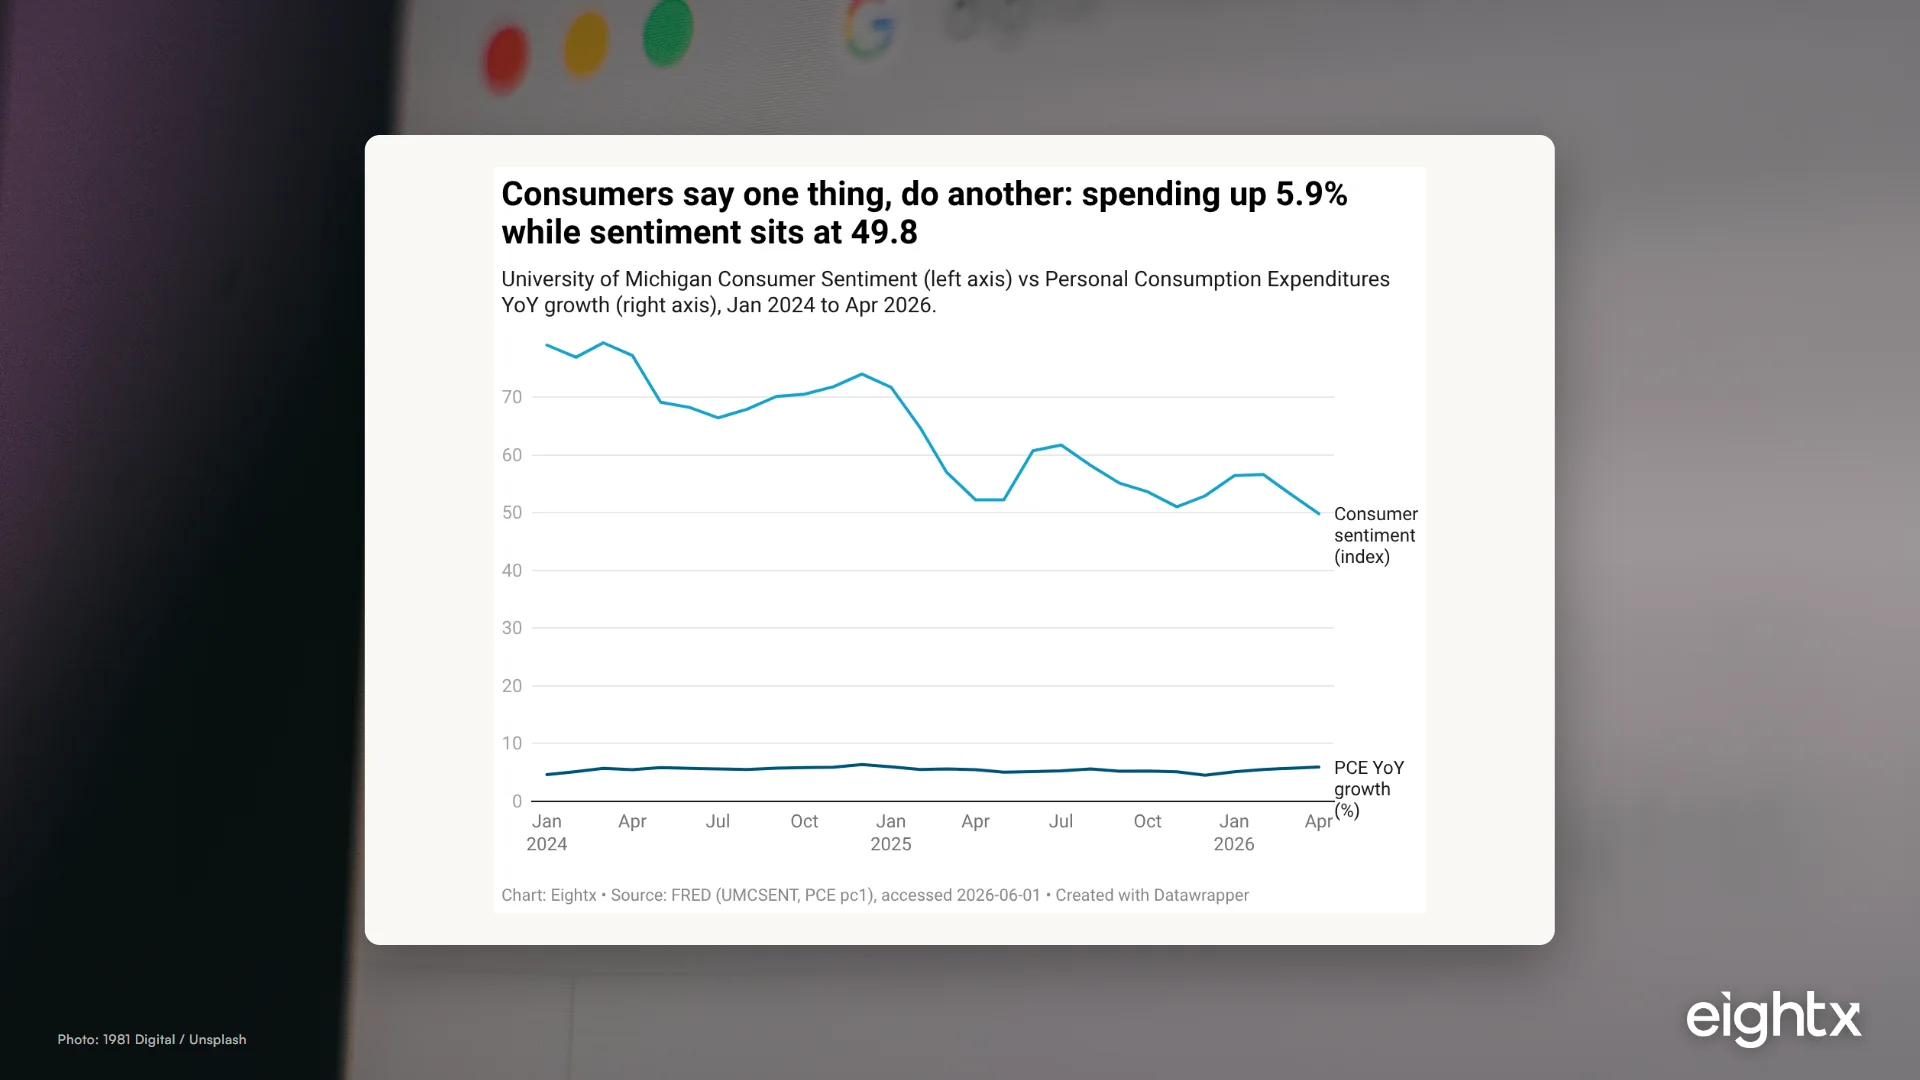
Consumer sentiment is at 49.8 and prime is 6.75%. The 13-week cash forecast and four working-capital levers that free cash when ecommerce sales slow.
Lower your ecommerce COGS by attacking the right component first. Vertical gross-margin benchmarks, a supplier-negotiation playbook, and a 0-36 month roadmap.
Food gross margin runs 21-38%, the thinnest in DTC. Price backward from the shelf and run different prices per channel without conflict.
Electronics brands run 15-25 points below beauty on margin and a ~$76 CAC. The CFO playbook for value pricing, MAP, tariffs and bundles to protect margin.
Price your coffee brand off a 45-55% fully-loaded margin floor, set the DTC vs wholesale gap, and decide how much of the 2026 green-coffee spike to pass through.
Beverage brands carry three prices, not one: DTC at 55-70% margin, wholesale at 25-40%. How to engineer a price backward from net margin, with FY2025 public comps.
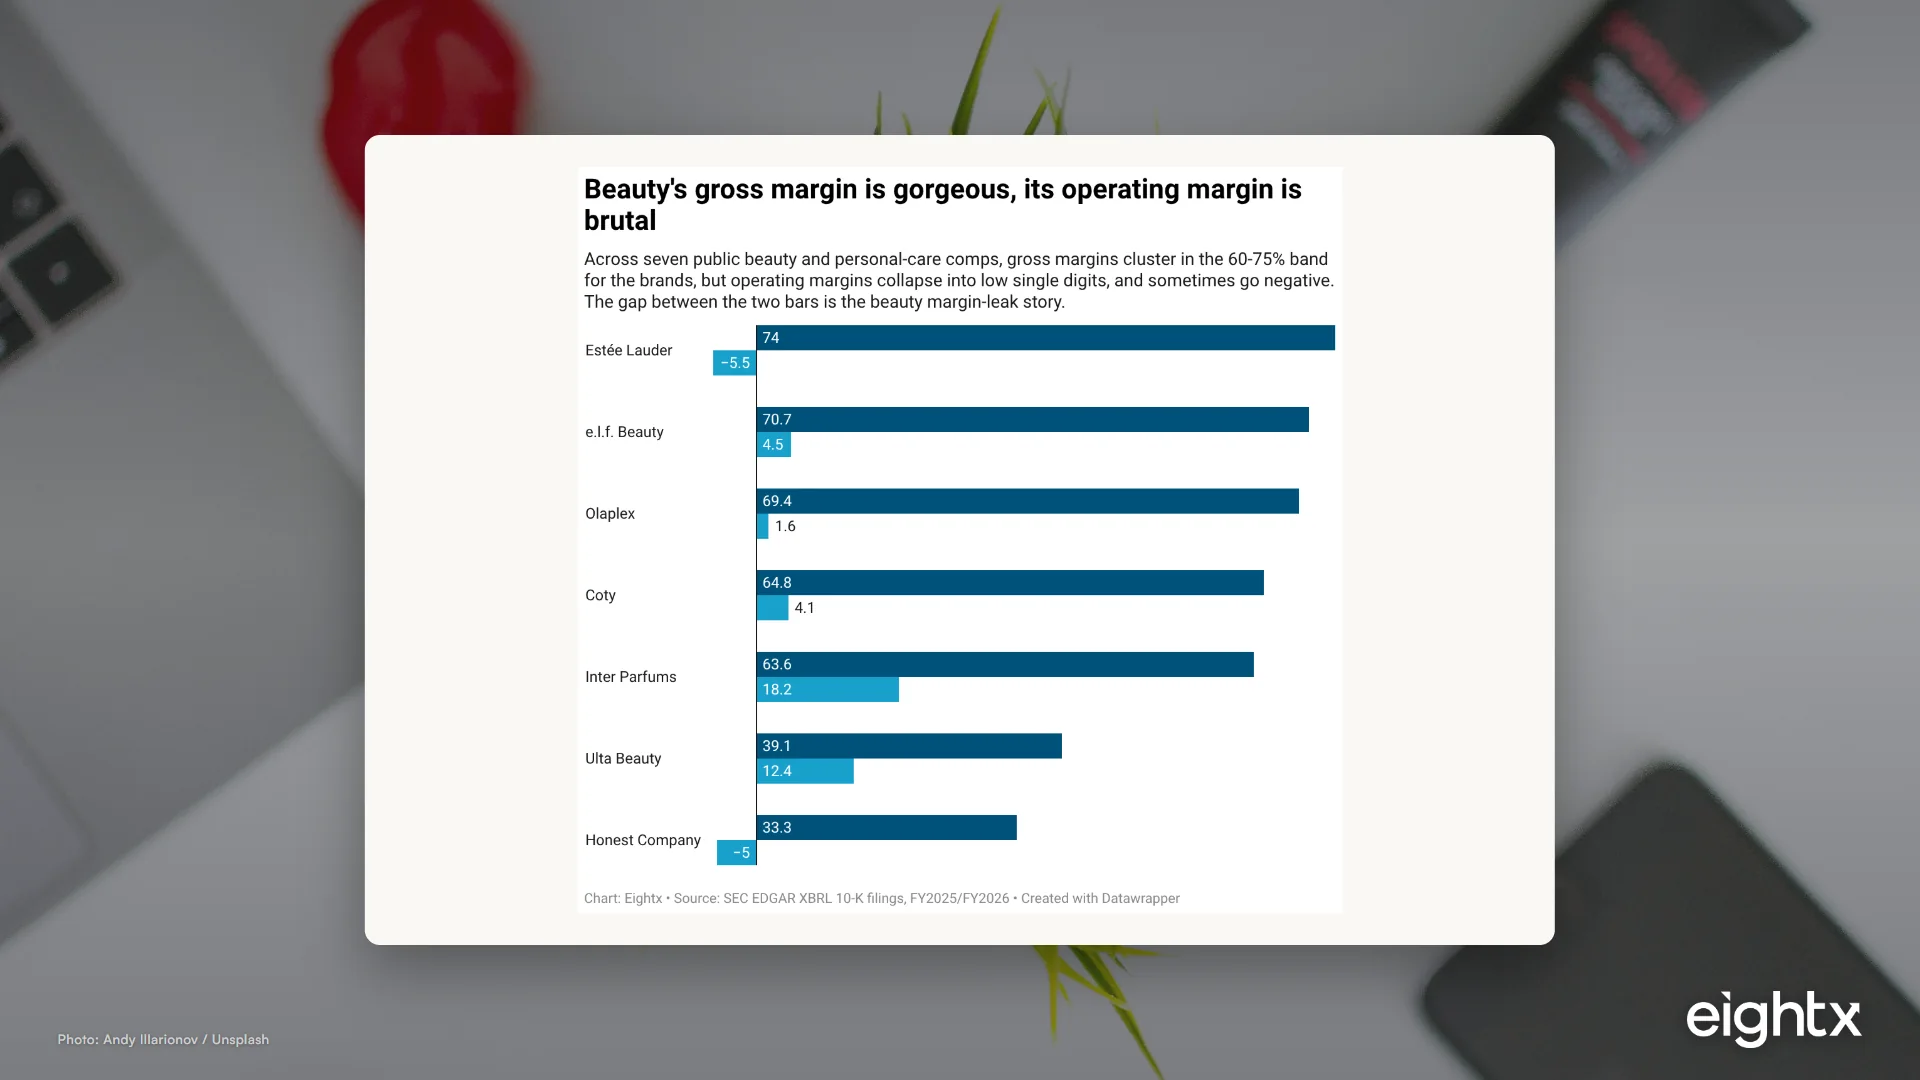
Public skincare brands post 69-74% gross margins yet swing from -5.5% to +4.5% operating. Here is the per-order waterfall, CAC payback math, and benchmark bands.
Pet has DTC's cheapest CAC (~$23) and a healthy 45-60% gross margin. Here's why heavy shipping and subscription mix, not margin, decide your pet brand's profit.
Public jewelry comps post 39.5% to 57.5% gross margin but under 6% operating margin. The unit economics a CFO underwrites for a DTC jewelry brand in 2026, line by line.
Home goods gross margin runs 30-56% but median operating margin is ~4%. The contribution-margin waterfall (CM1 to CM3), CAC payback, and LTV:CAC, with 2026 benchmarks.
On Holding (On Running) did CHF 3.01B at a 62.8% gross margin in FY2025. We read the 20-F like a CFO diligencing it: margin, marketing, inventory, cash.
Oatly's gross margin fell to 11% in 2022, then clawed back to 32% by 2025 while shareholder equity dropped 98% to $20M. A CFO teardown of the 20-F.
Lovesac hit a record $697.1M in FY2026 net sales, but operating income collapsed to $5.4M as tariffs and freight ate 210 bps of gross margin.
Prime Day 2026 is June 23-26. A CFO's guide to running it as a margin and cash-flow event: the real cost of a deal, the DD+7 cash trap, and the numbers to watch.
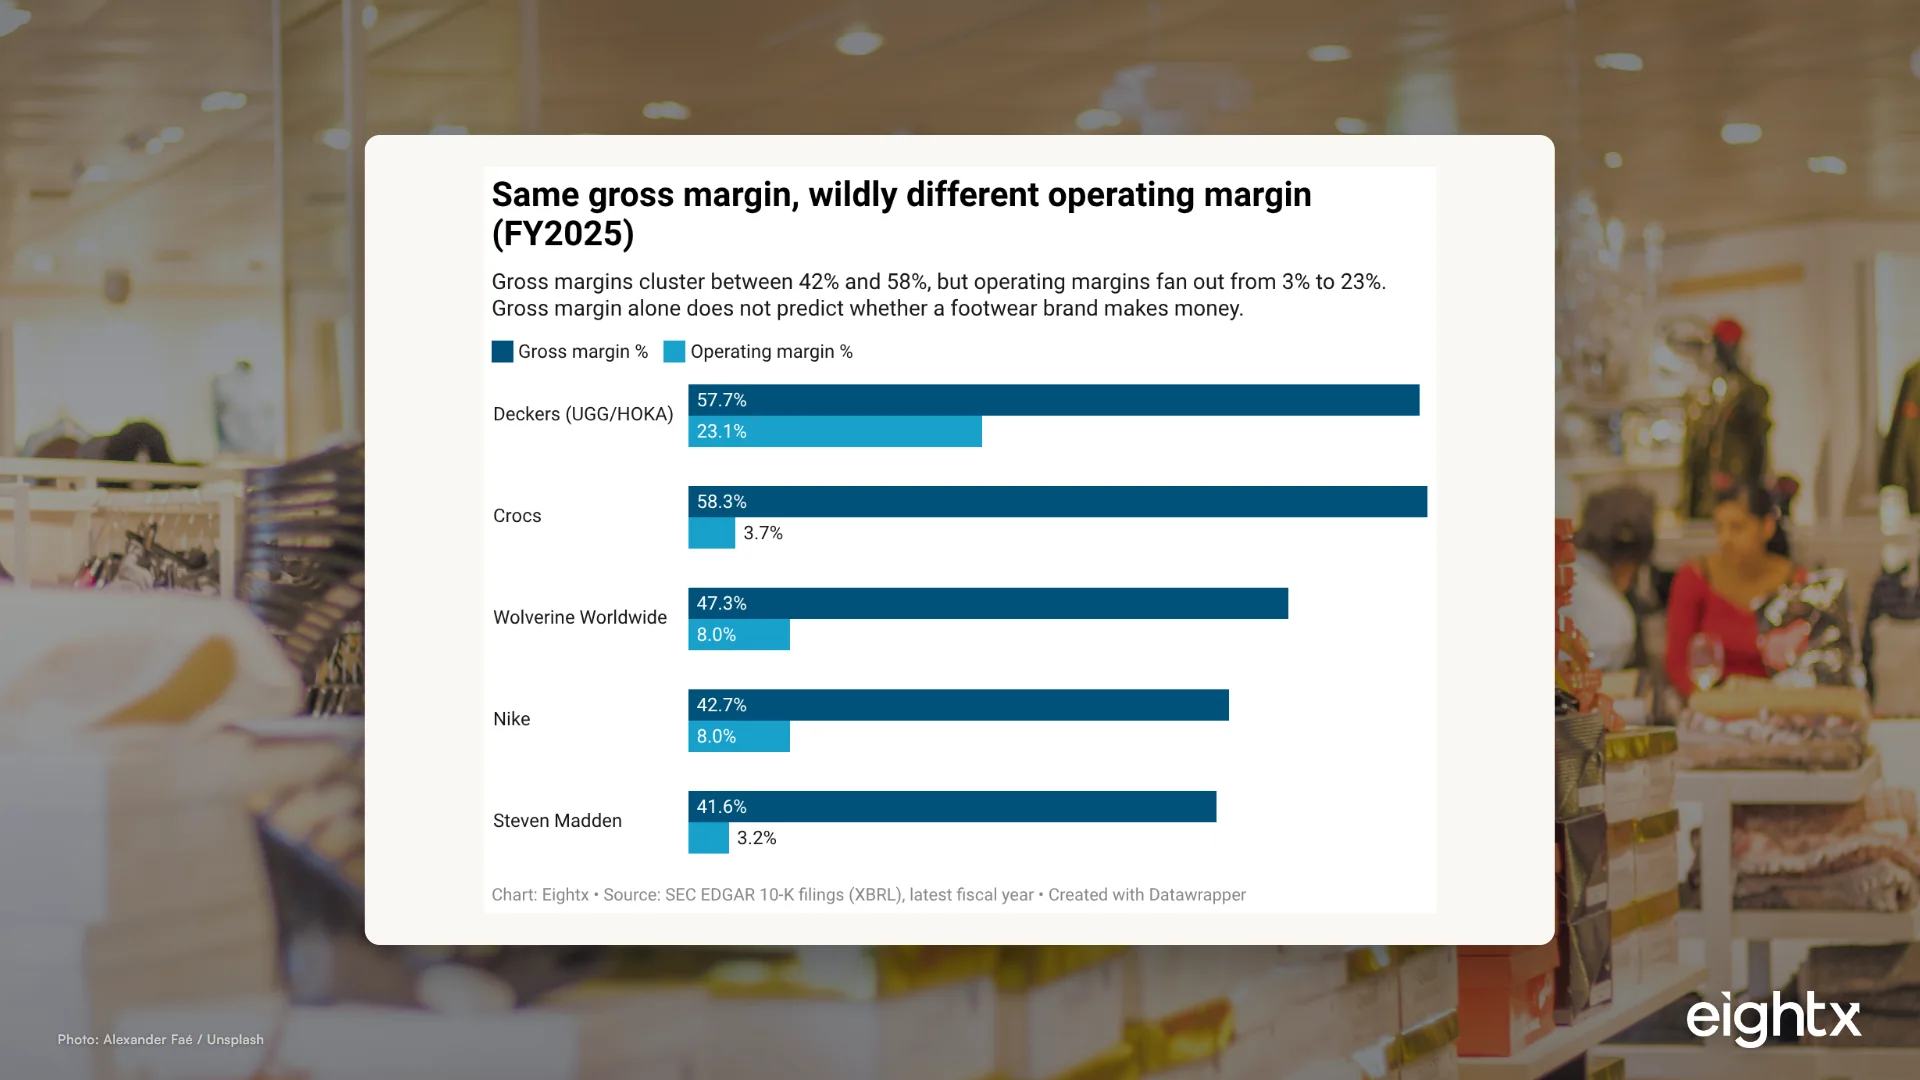
Two shoe brands at a 58% gross margin posted operating margins 6x apart. Why footwear unit economics live below the gross-margin line, and how to model yours per order.
Food is the lowest-margin DTC vertical. Why your gross margin looks fine but the first order loses money, plus 2026 contribution-margin and CAC-payback bands.
Consumer electronics brands win below the gross-margin line: a $260 order at 35% margin throws off $67 of contribution against a $76 CAC. With real SEC comps.
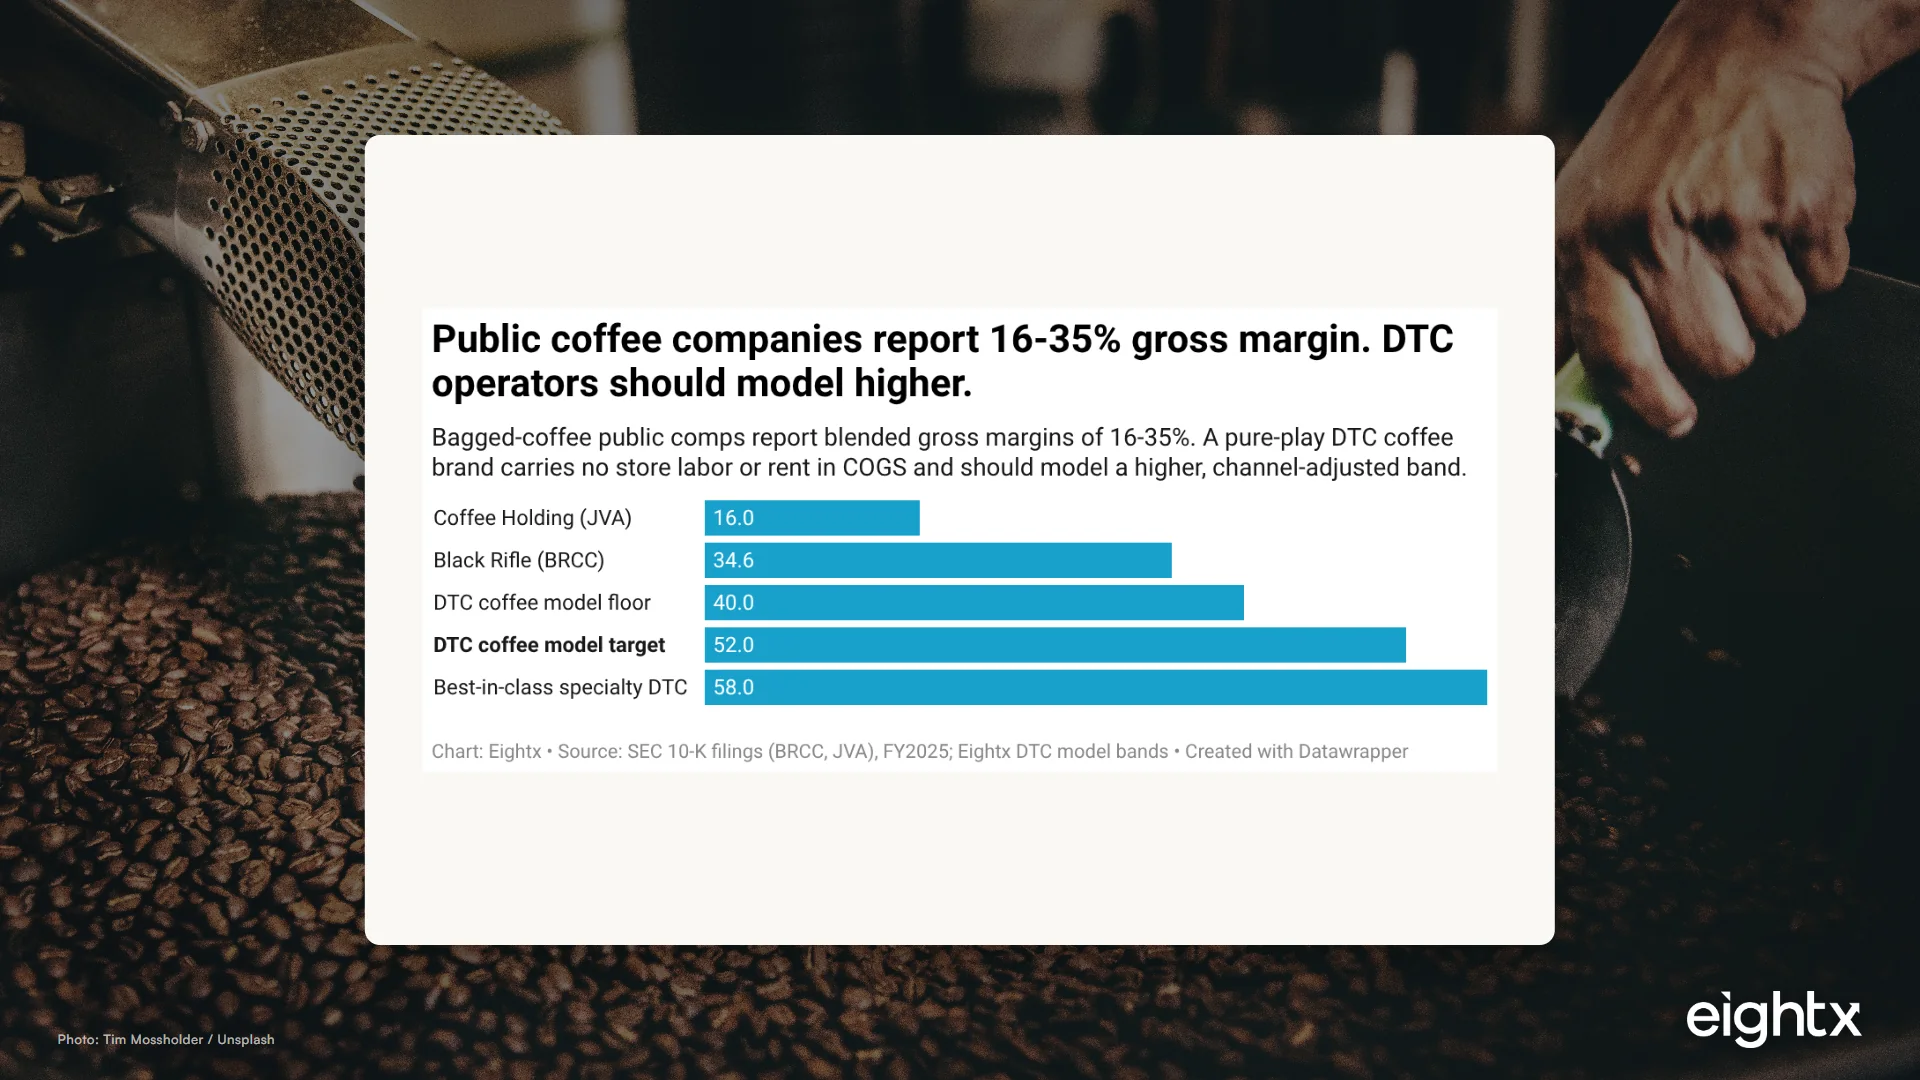
Coffee carries a healthy 45-55% gross margin but a thin ~22% contribution margin after ads. The cohort math that decides whether your DTC coffee brand scales.
Beauty brands carry the highest gross margins in consumer (median ~69%) but a 4.1% operating margin. The CFO walk-down from CM1 to CM3, with 2026 benchmarks.
121,343 active German Shopify stores, Klarna on ~49% of them, and fashion returns near 50%. The operator read on selling DTC in Europe's biggest market in 2026.
Online is only ~13.4% of German retail despite €88.8B in 2024 turnover. The penetration, category, marketplace, and returns read for operators eyeing Germany.
Germany is the highest-return ecommerce market on earth: about 1 in 5 online orders comes back and fashion tops 50%. Here is the benchmark by category and the margin math.
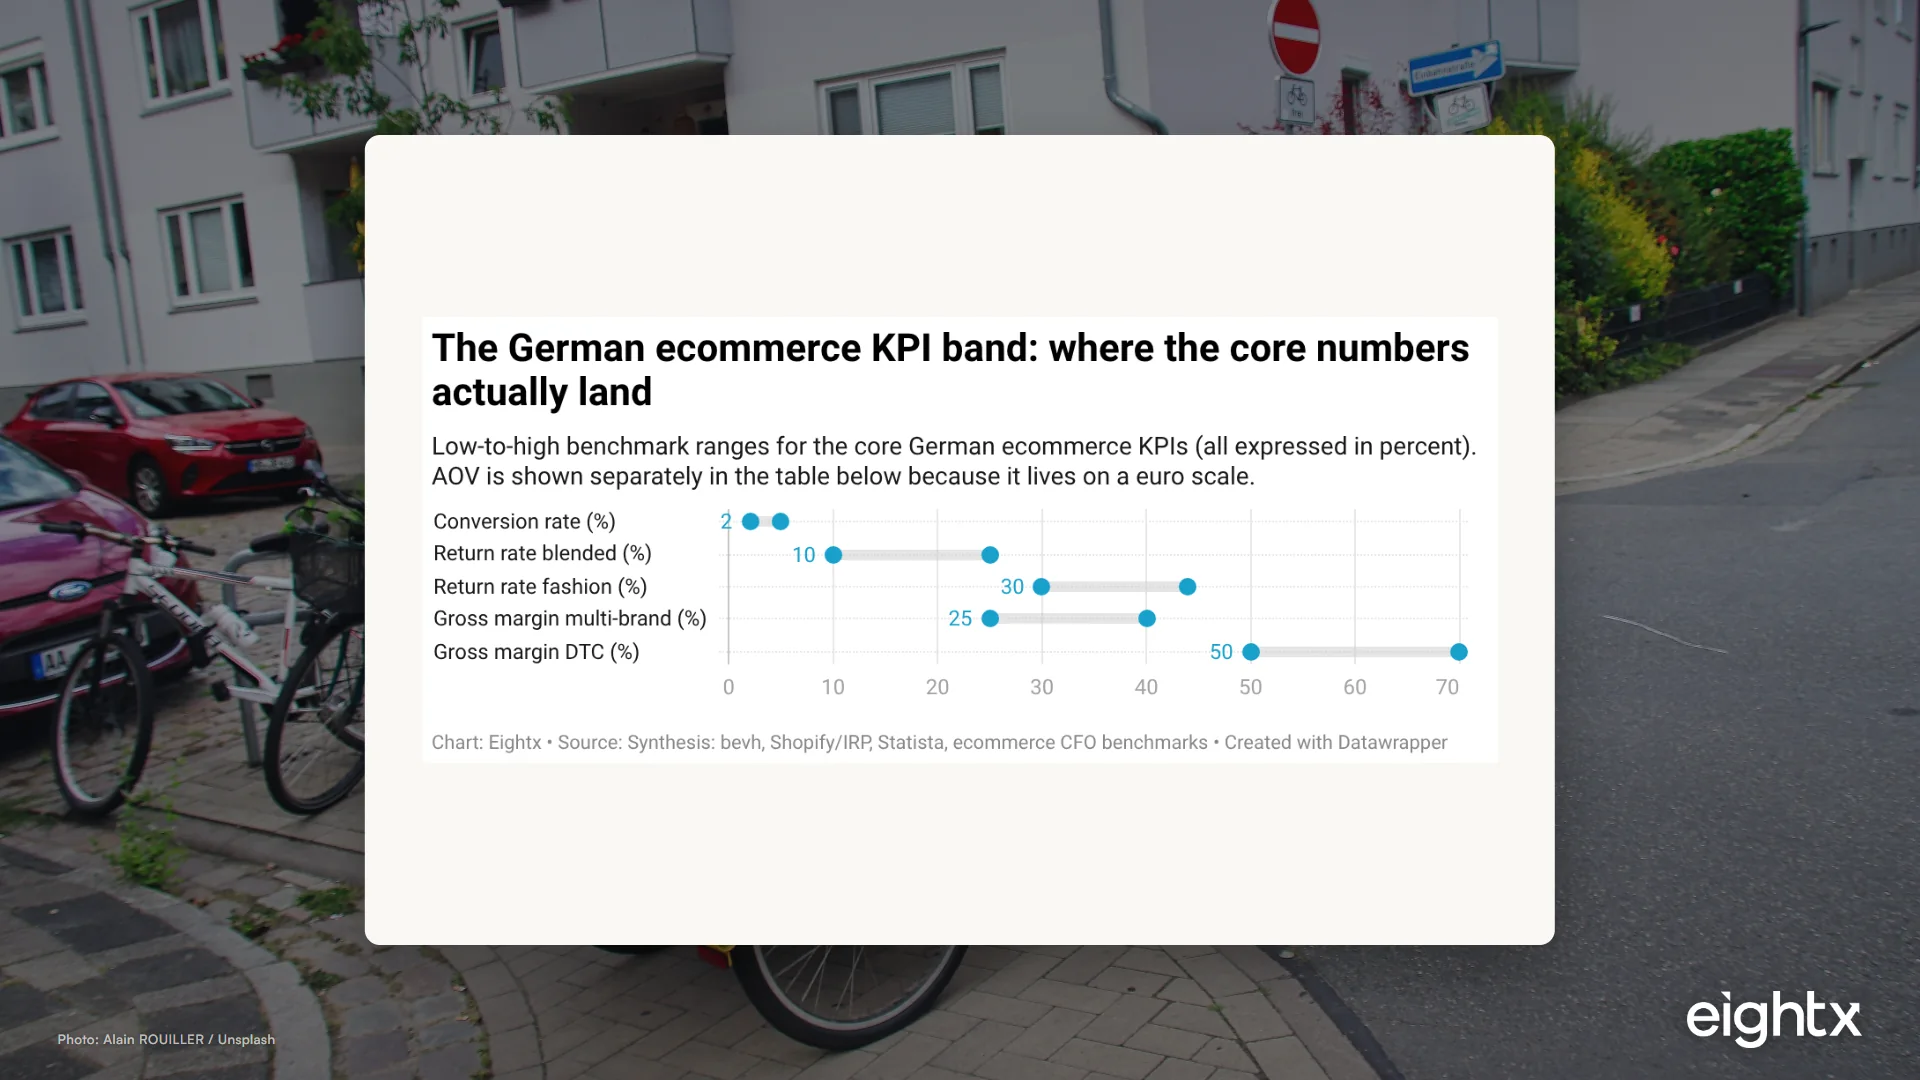
Germany ecommerce benchmarks 2026: EUR 83.1B market, ~2% conversion, EUR 70-140 AOV, 30-44% fashion returns. Where your DTC numbers should land, and why a US P&L breaks.
The 2026 EU Shopify map: Germany and France each carry ~120k live stores, and a single EU-wide €10,000 VAT line gates your cross-border expansion.
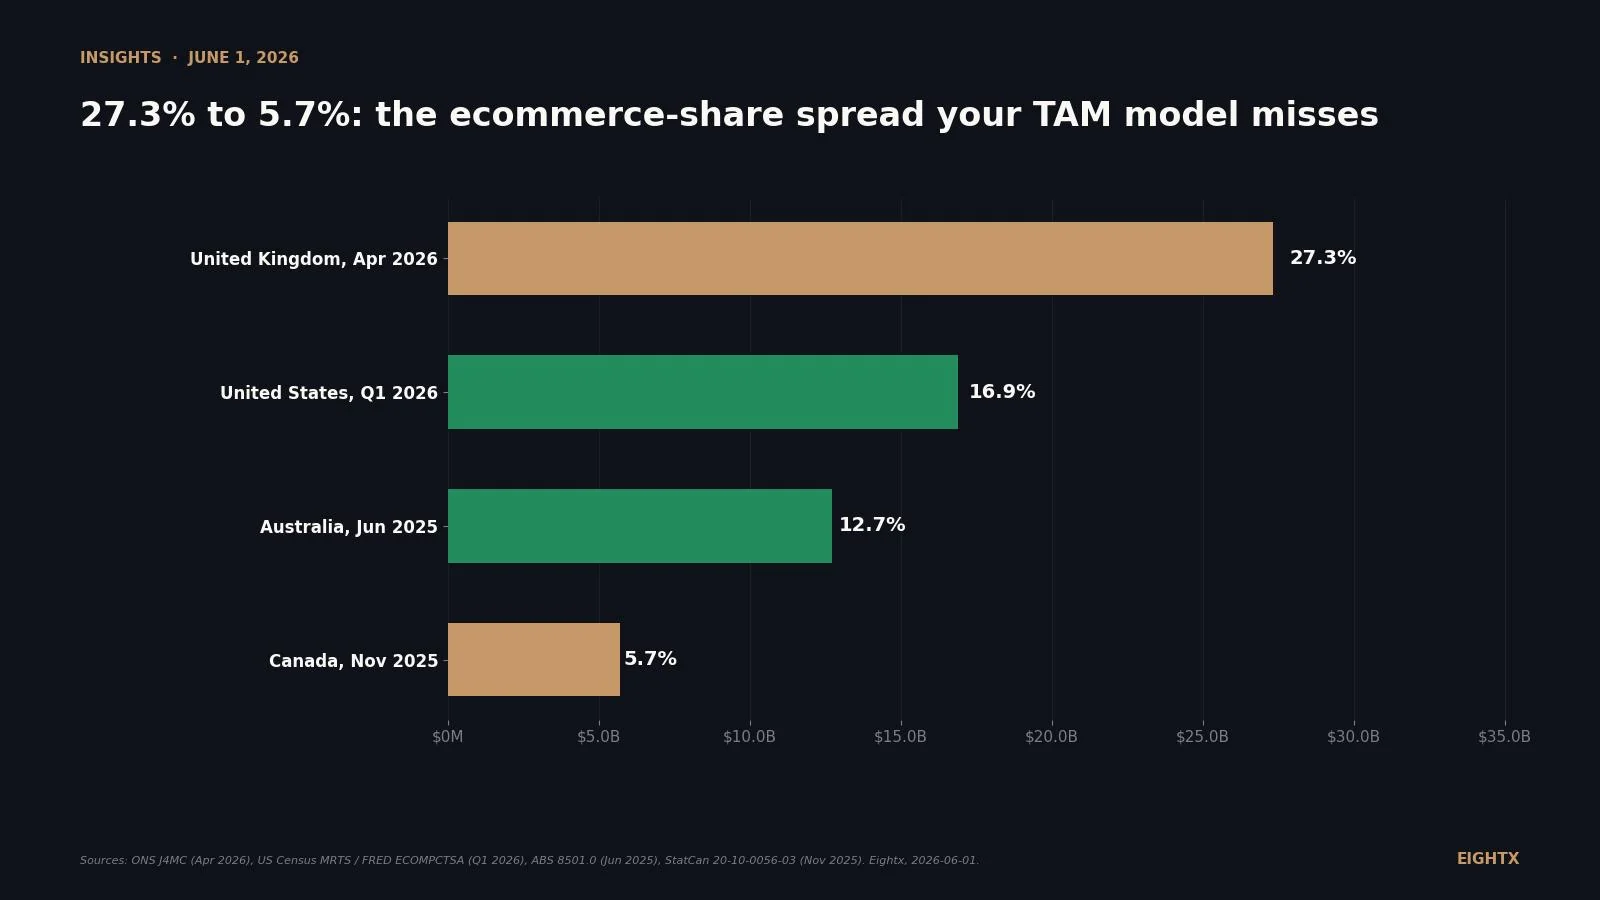
Online is ~16% of Europe-5 retail (Forrester), not the 19.5% Eurostat figure everyone quotes. The penetration trap, France-first market map, charted, for operators.
Laird Superfood tripled gross margin to 41% going asset-light, never hit operating profit, and ended up 72%-owned by a PE firm. The operator read on the filings.
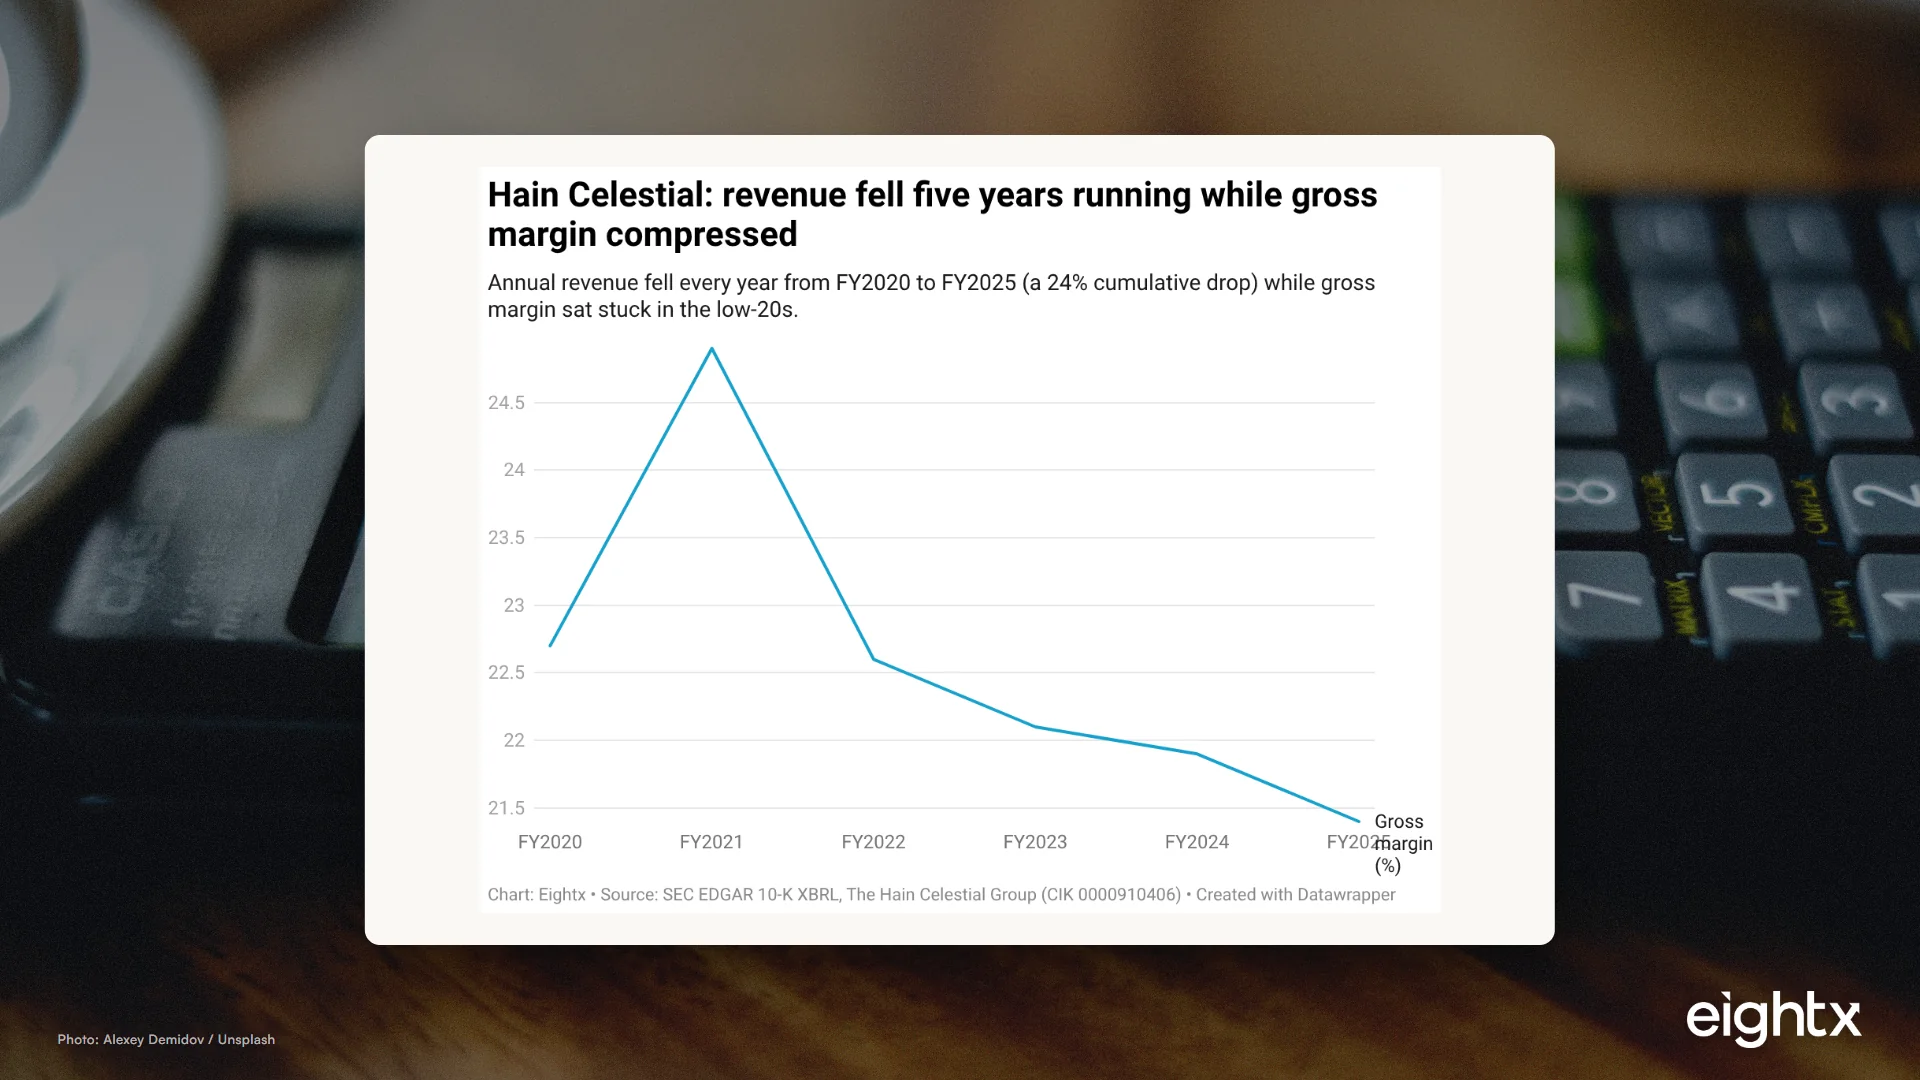
Hain Celestial's 10-K read like a CFO would diligence it: five straight years of falling revenue, a $429M goodwill write-off, and equity cut roughly 80%.
Grove cut ad spend 91% and pushed gross margin to 53.7%, but revenue fell 55% and cash is at $7.2M. A CFO reads GROV's 10-K the way you should read your own.
Freshpet hit $1.10B net sales, 40.8% gross margin, and its first positive free cash flow in 2025. A CFO reads the 10-K the way you'd diligence it.
Edible Brands is replatforming to Shopify to capture exploding AI traffic. We model the financial impact, and it is not a revenue story. It is a CAC story worth ~9 margin points.
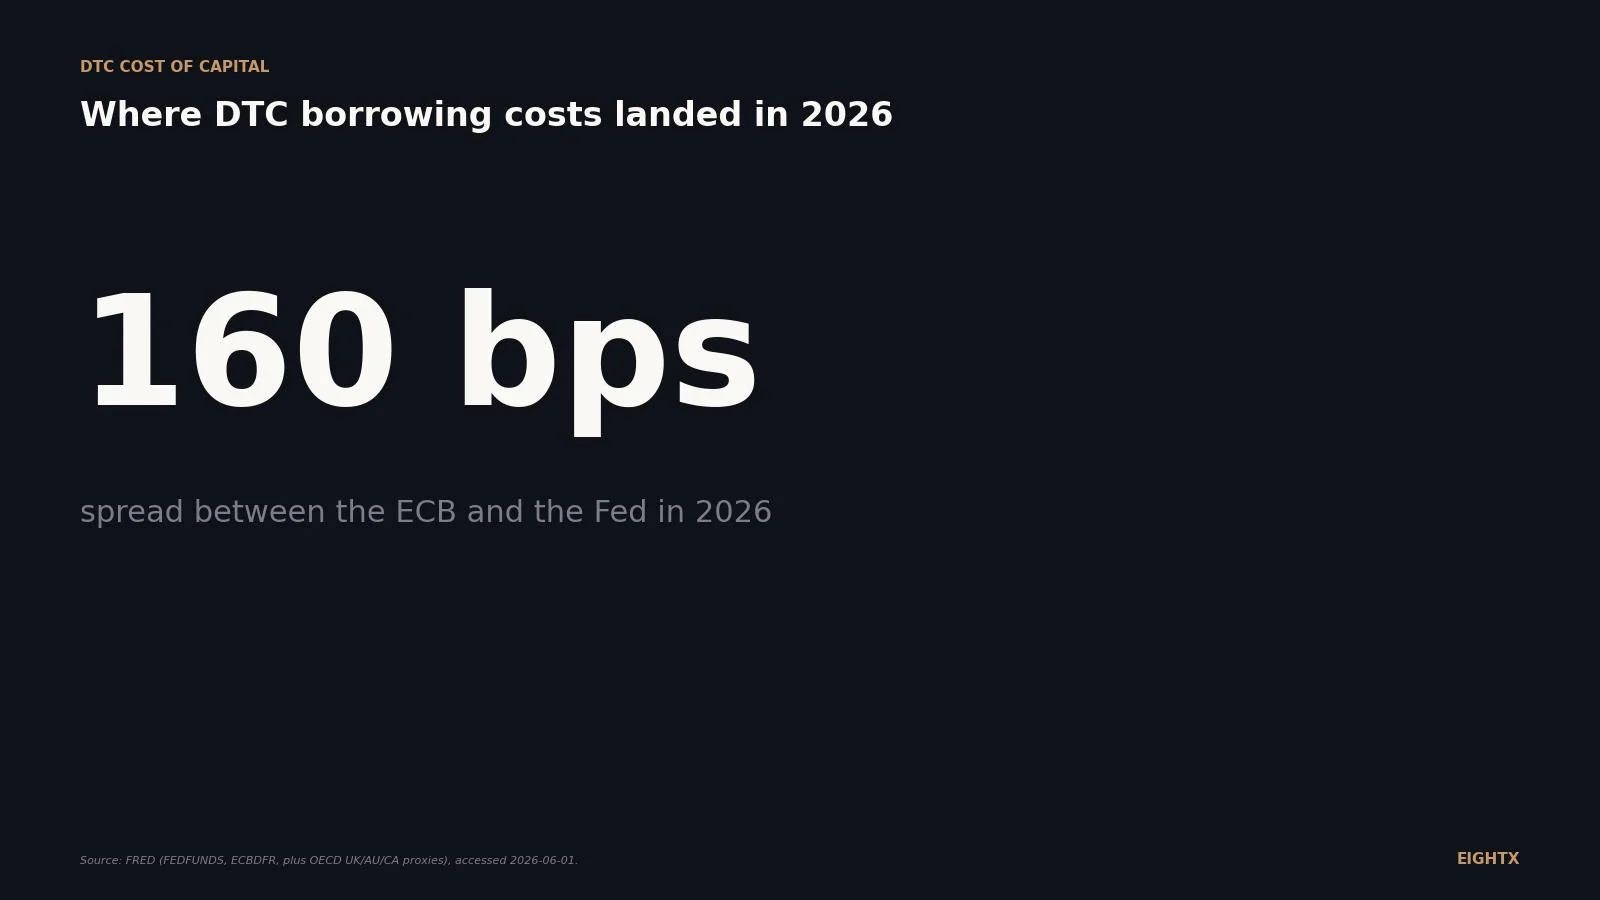
At Warsh's first meeting the Fed held at 3.50-3.75% but flipped hawkish, with members now projecting hikes. What rising rates do to your cost of capital and Wayflyer-style debt.
Europe has the world's highest online return rates: ~18-22% of EU orders, ~30% fashion, Germany near the top. Here's the real cost per return and the margin math.
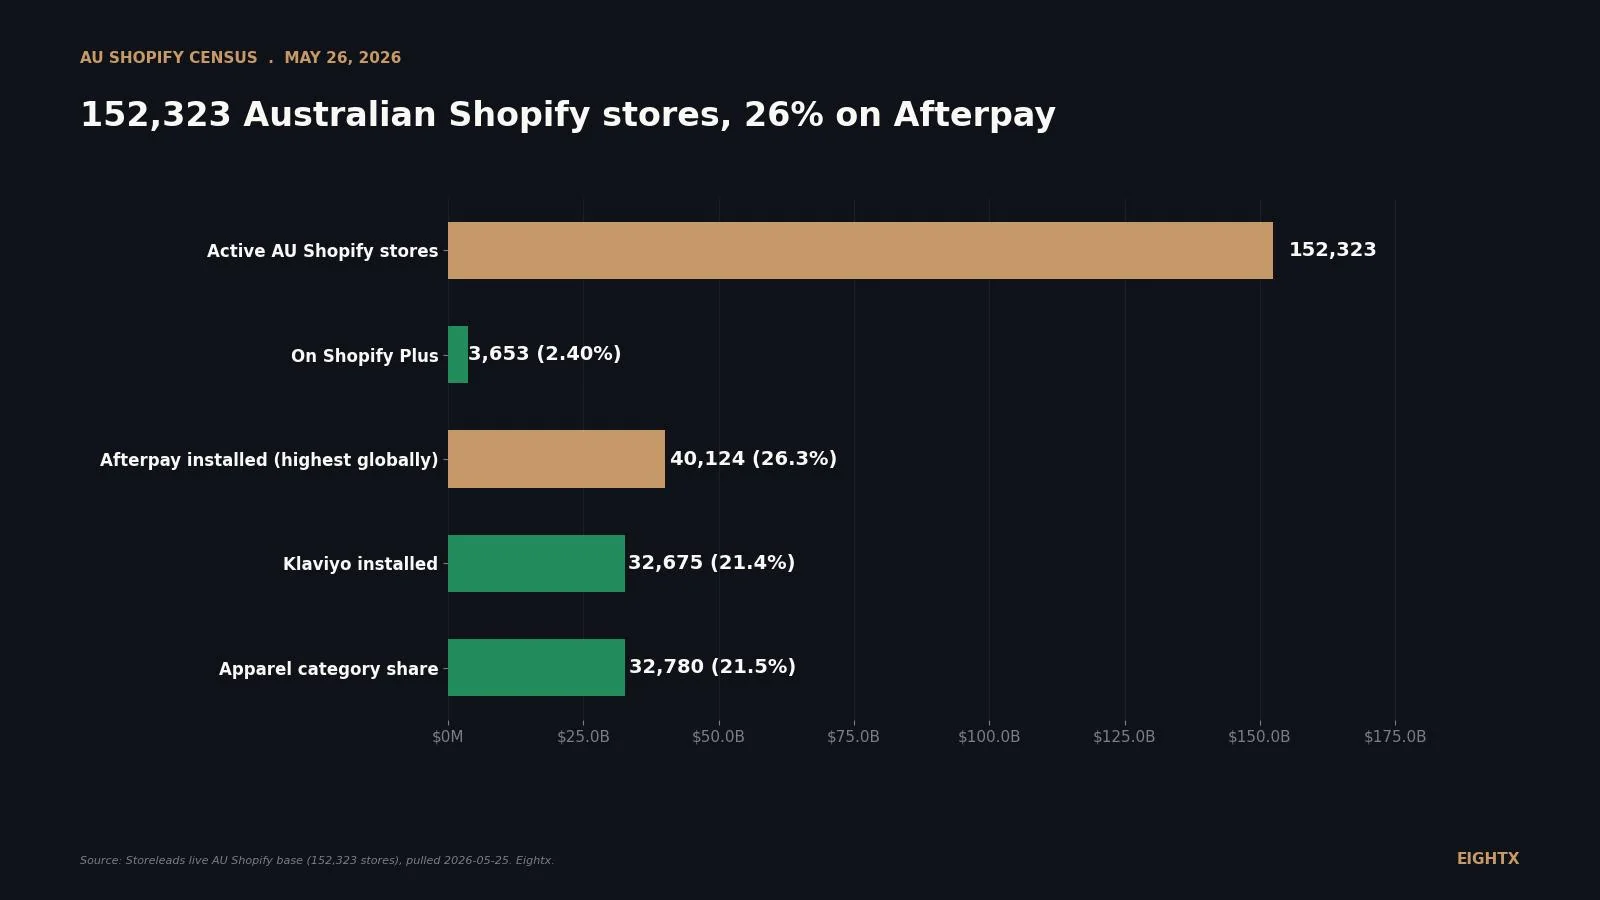
About 153,000 live Shopify stores, an $82.6B online market growing double digits, and a cost-of-living-squeezed consumer. The 2026 Australian Shopify benchmark, charted.
NetSuite's base license is $999-$5,000/mo, but that's a third of the real bill. The honest first-year DTC total cost of ownership, by tier and add-on.
Loop Returns lists Essential at $155/mo and Advanced at $340/mo, but the real DTC cost adds per-return usage, an annual contract, and onboarding.
We priced 8 payroll platforms for a 10-person DTC brand. Gusto, OnPay, Rippling, Deel, QuickBooks and more, ranked best-for-X with real 2026 pricing and G2 ratings.
Which cash flow tools actually sync to Shopify, model your inventory buys, and why most $1-10M DTC brands need a pair, not one tool. Ranked for 2026.
The working capital peg quietly moves six figures in an ecommerce sale. How the peg is set, why inventory-heavy DTC brands get hurt, and a worked true-up example.
When to sell your ecommerce brand: timing drives the multiple. Sell into growth, not after it stalls, with 2 to 3 clean years and before burnout sets in.
The US imports $18B of wine and spirits a year. France and Italy are 70% of wine; Mexico is 47% of spirits. Where the 2026 tariff exposure actually sits, by origin.
The US imported $7B of watches in 2024 and Switzerland supplied 88% of it (HS 9101/9102). What that concentration means for your landed-cost and tariff exposure.
US HS 9506 sporting-goods imports hit $7.0B in 2025 and China dropped below 50% of the category for the first time. The origin mix and the by-origin tariff math, charted.
US pet food (HS 230910) is Thailand and Canada at 0% duty; accessories (HS 4201) are China-led and pay the tariff. The 2026 pet import-origin map.
Wayfair did $12.46B in FY2025 revenue and still lost $313M. A teardown of its 30% gross margin, 11.4% ad spend, negative equity, and asset-light cash trick.
Warby Parker's first profitable year (2025) didn't come from gross margin. It came from SG&A leverage. A CFO-grade teardown of the 10-K for DTC operators.
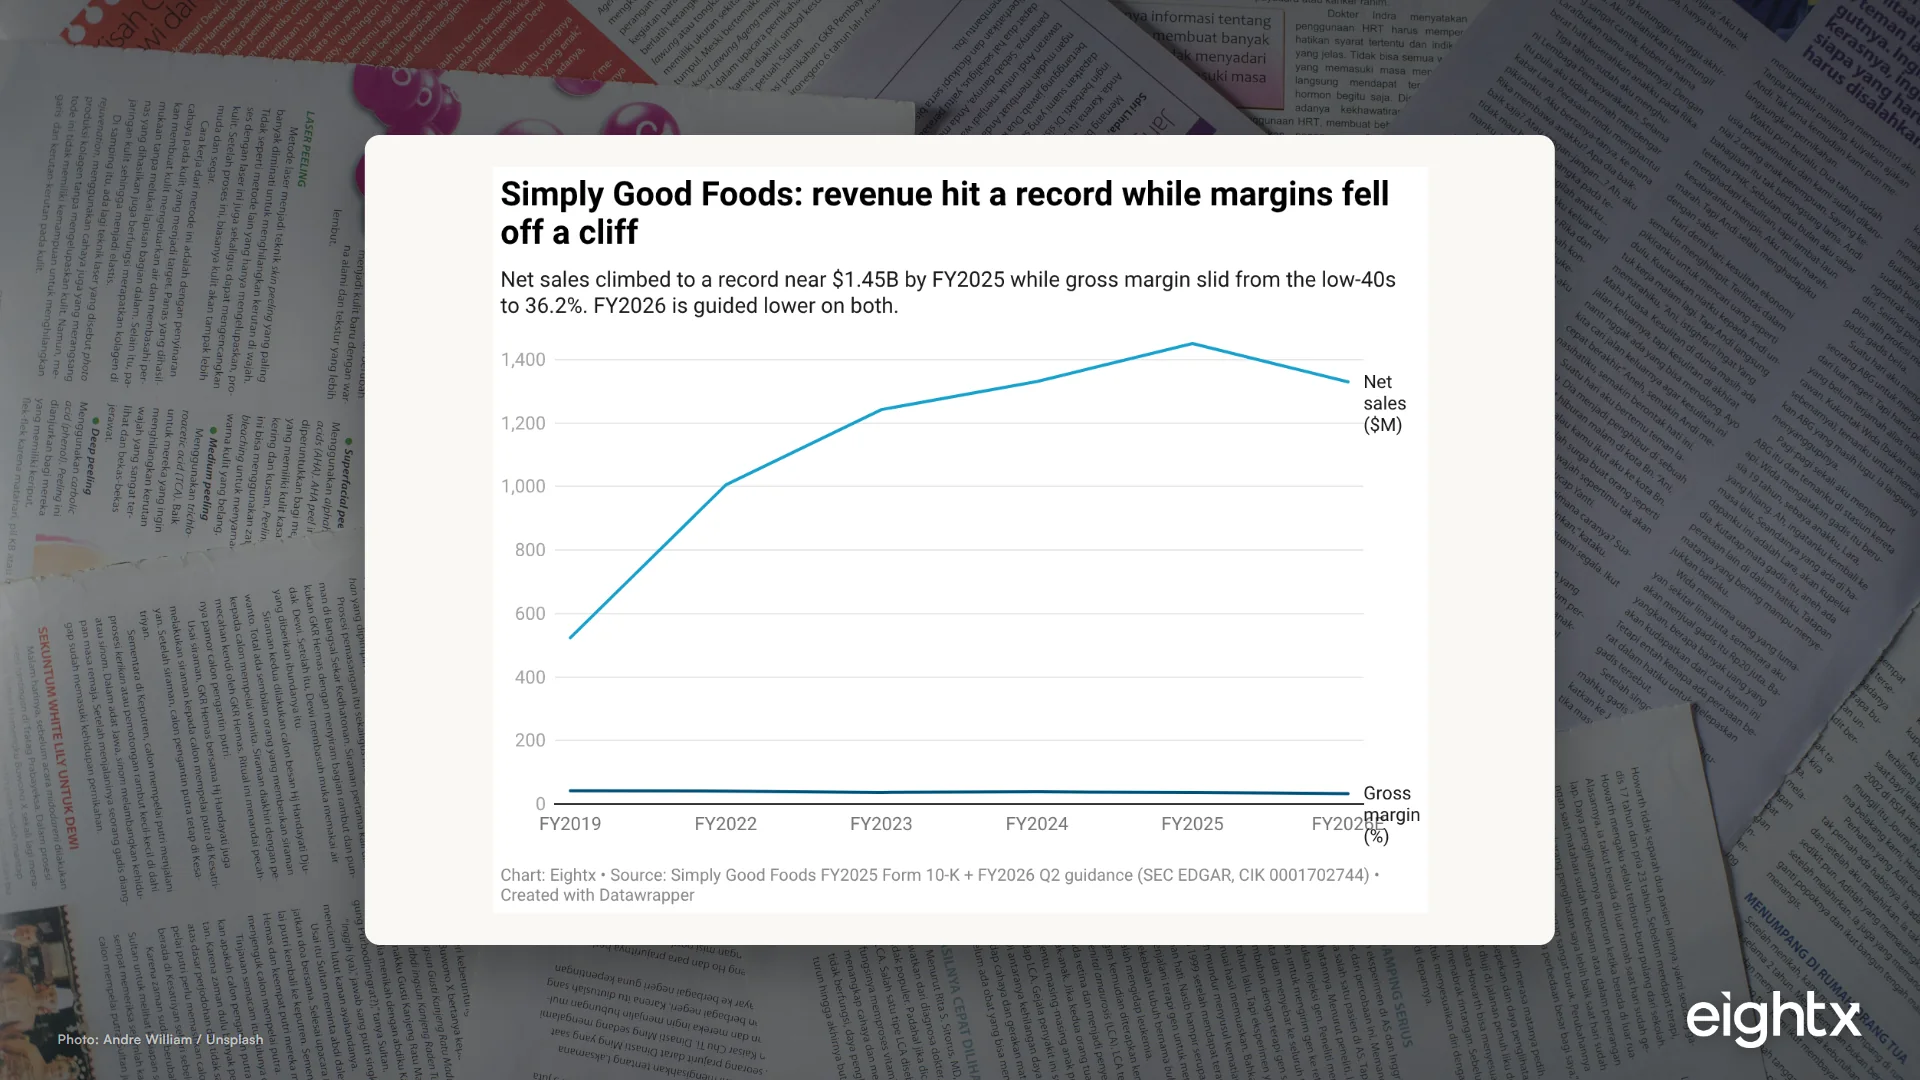
Simply Good Foods (SMPL) hit record $1.45B revenue in FY2025 while net income fell 26% and gross margin dropped 220 bps. A CFO-grade read of the 10-K and the OWYN write-down.
Rent the Runway reported its first GAAP profit in FY2025 on a $57.5M operating loss. A teardown of the 10-K, the debt-for-equity recap, and the cash treadmill.
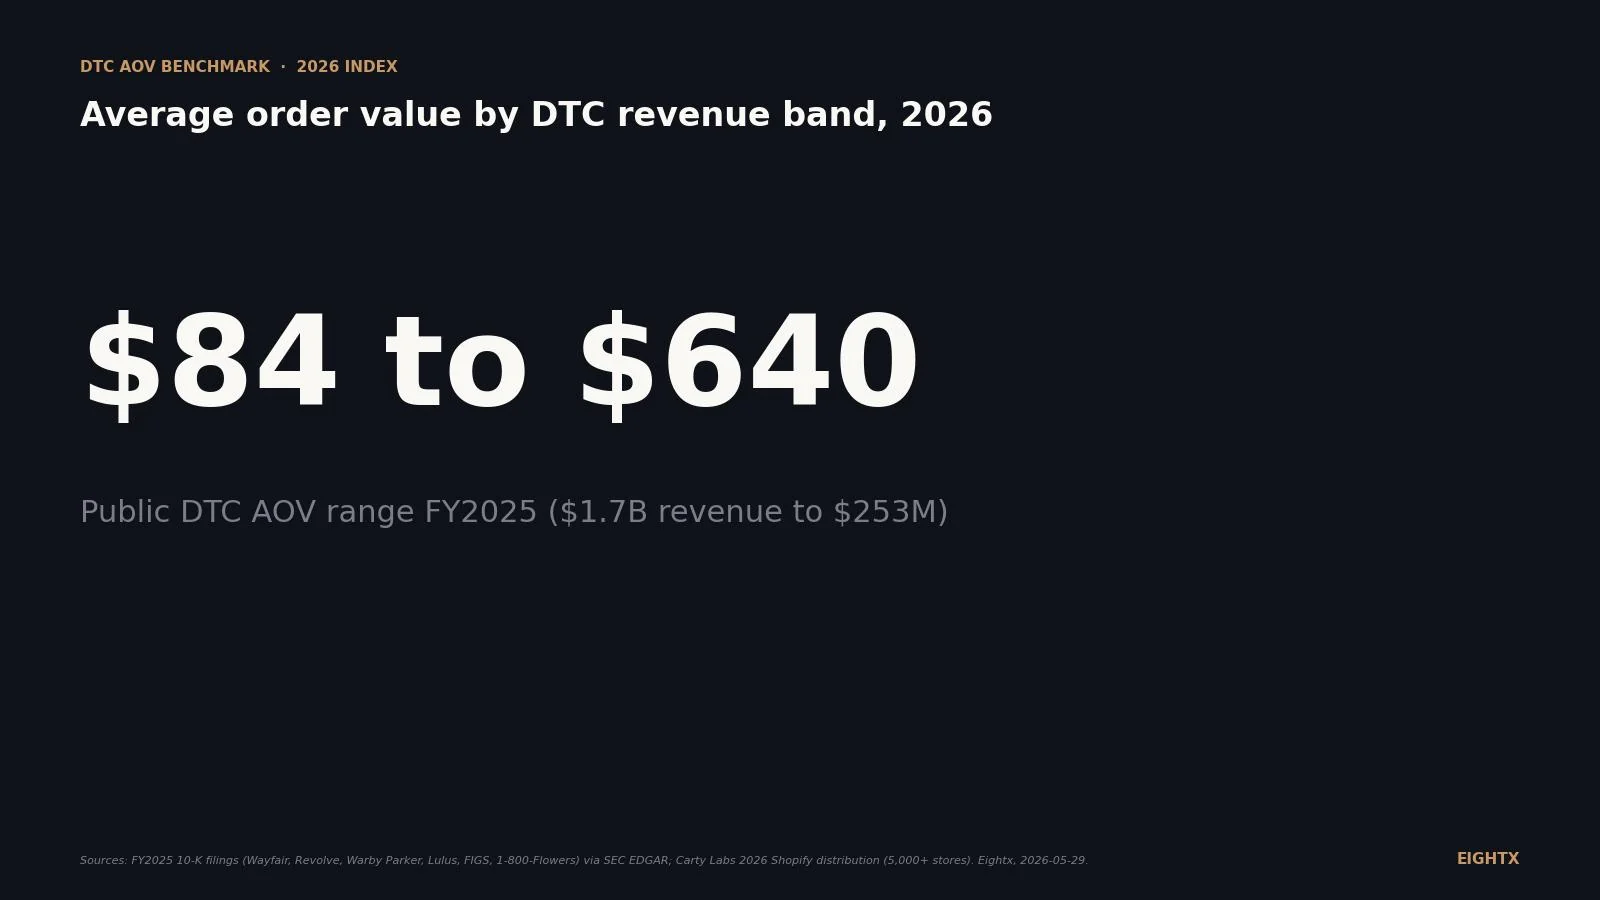
UK ecommerce average order value was £122.02 in March 2026, down 3.6% YoY (IRP Commerce). The 2026 AOV benchmark by vertical, in GBP, with the operator playbook.
28,547 live Shopify stores, a NZ$6.1B online-goods market, OCR at 2.25%. What the New Zealand DTC landscape actually looks like in 2026, by the numbers.
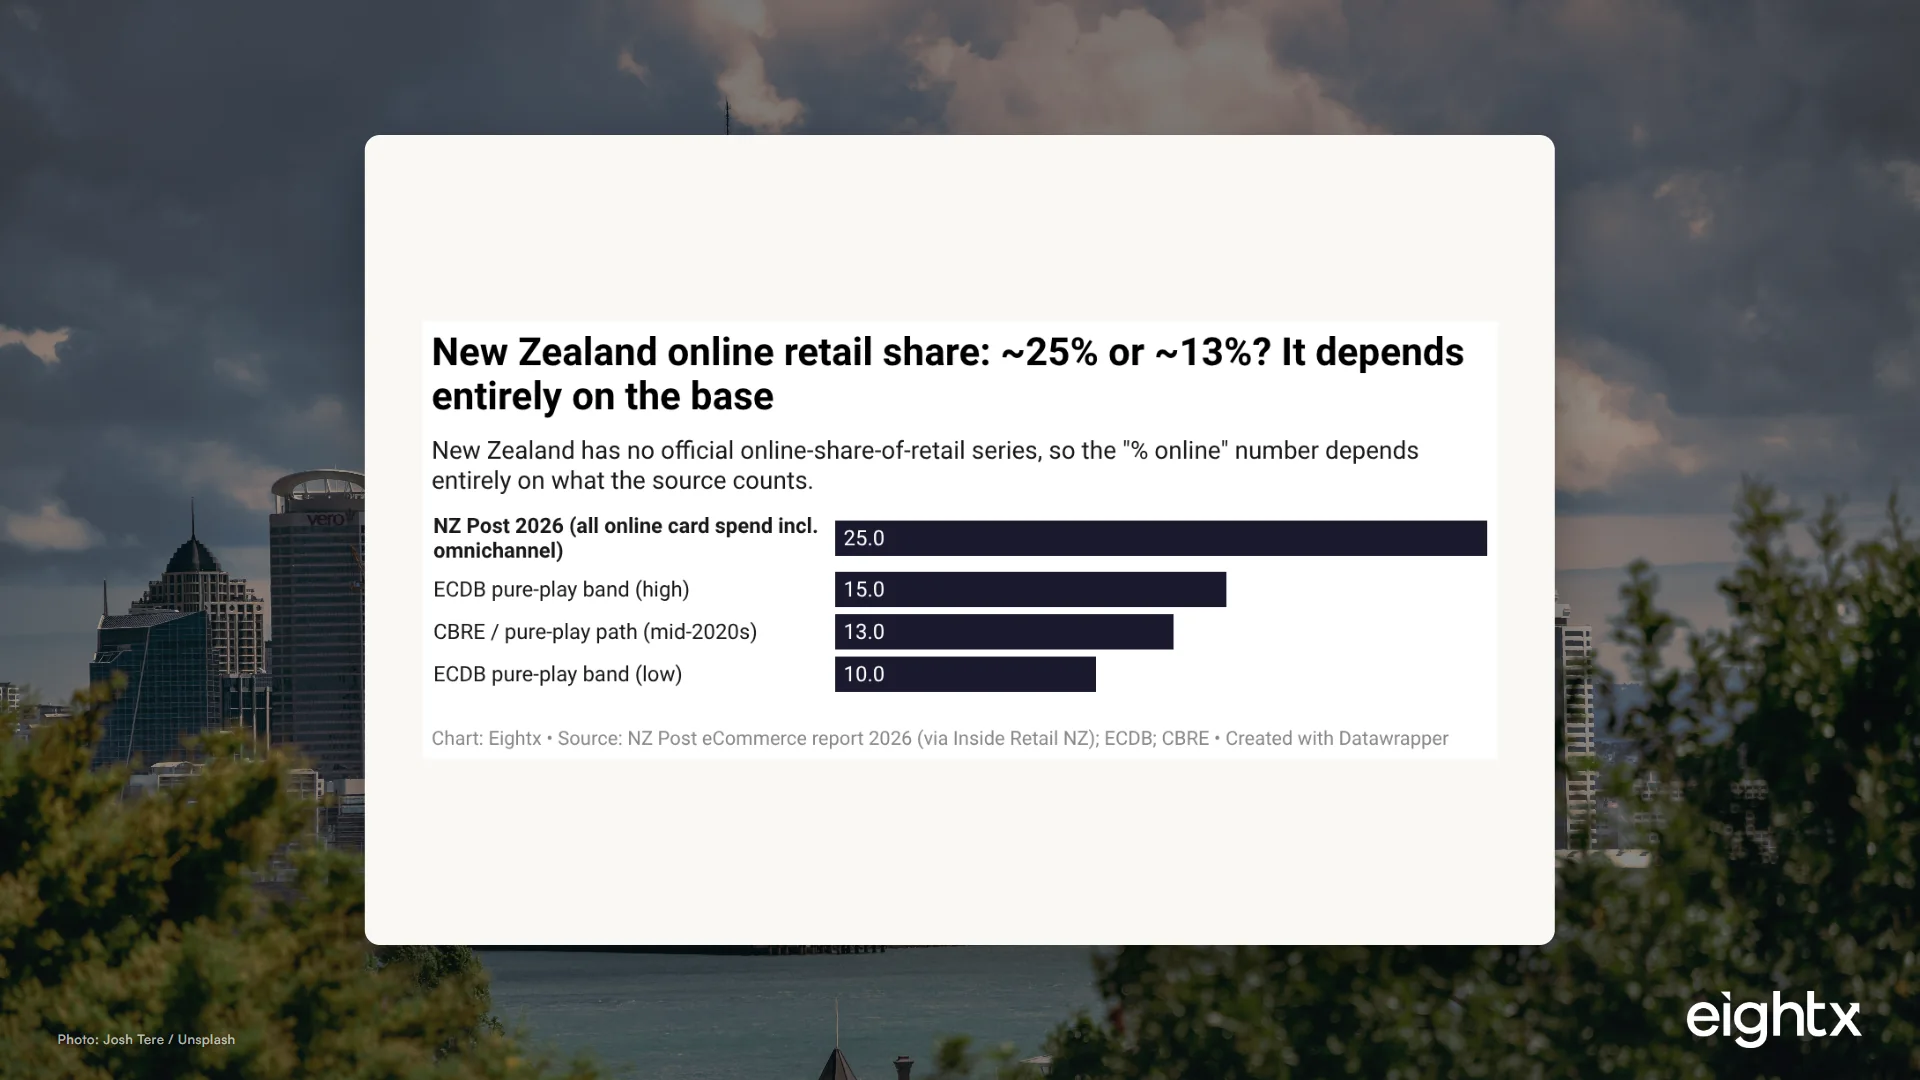
NZ Post says almost one in four retail dollars is online (~25%). Pure-play estimates say ~13%. Stats NZ publishes neither. Which base matches your revenue?
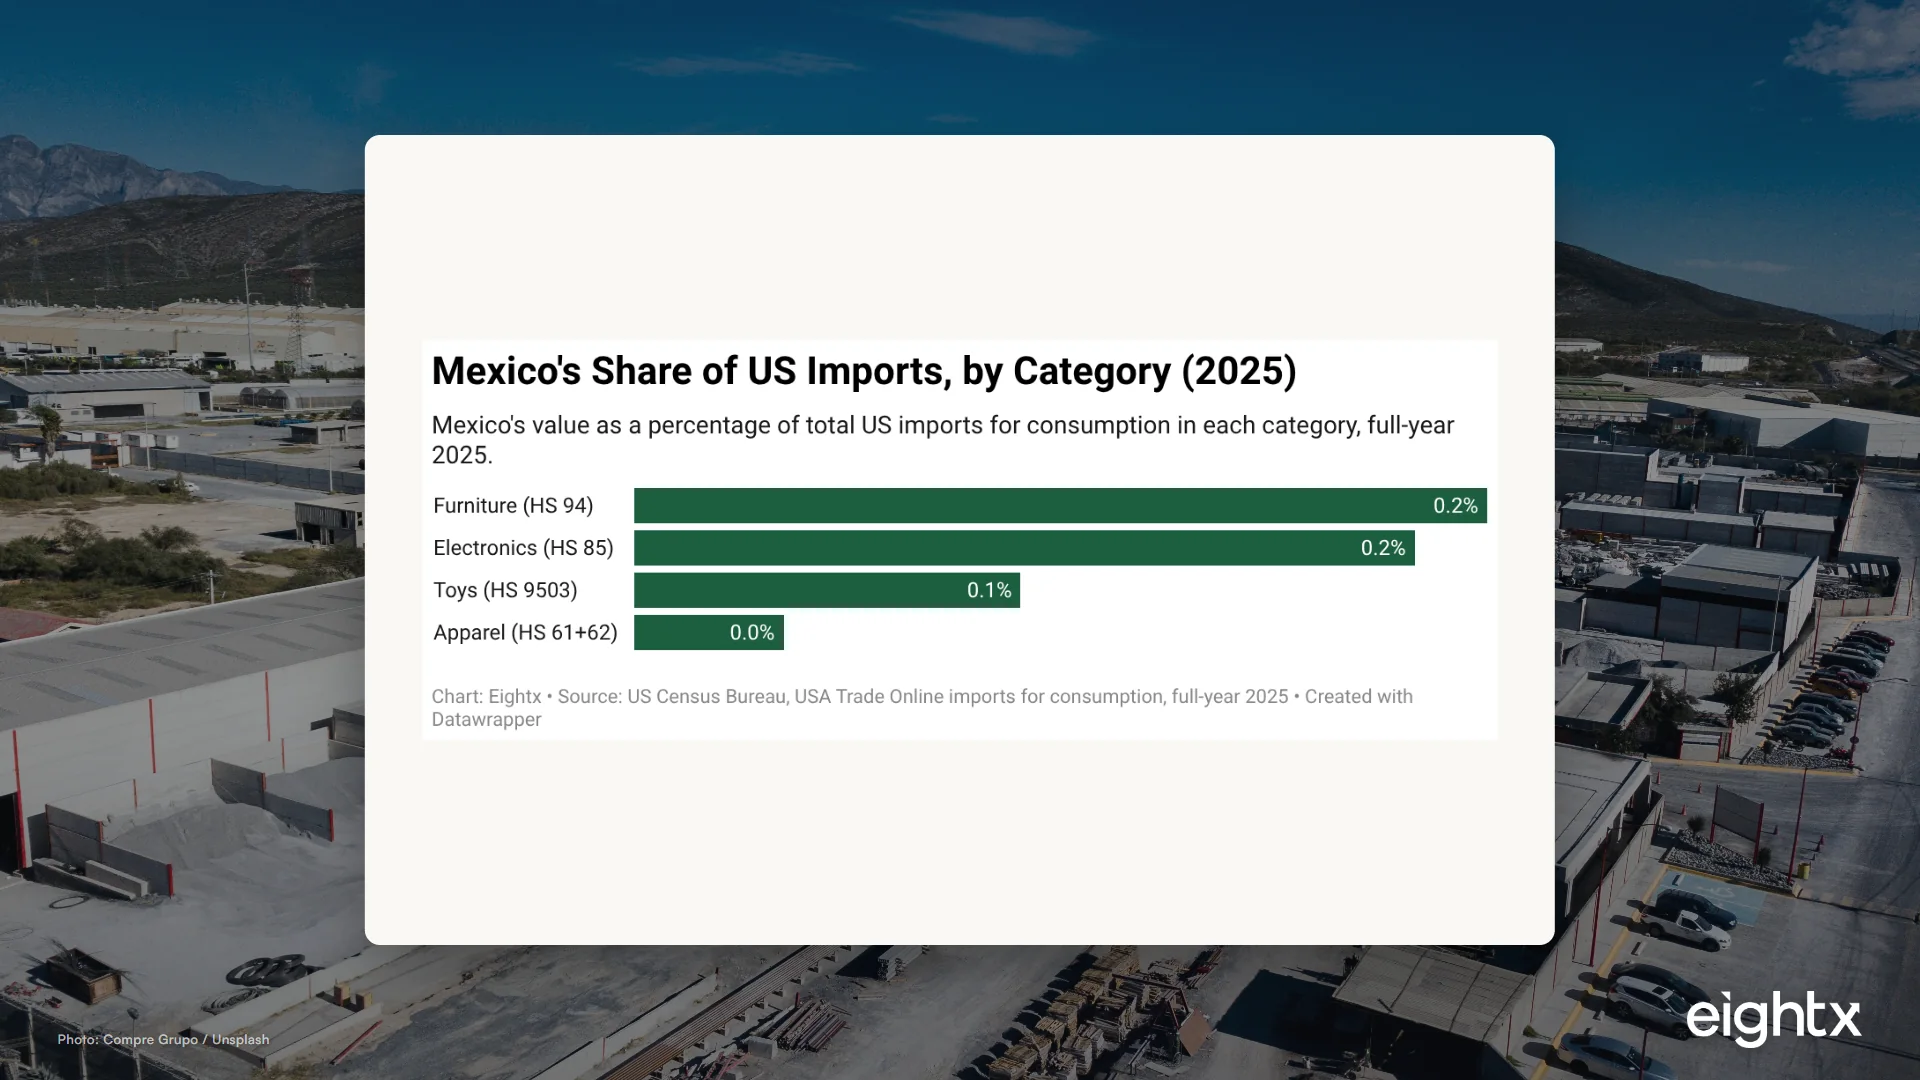
Is nearshoring real? US Census 2025 data shows Mexico holds 18 to 20 percent of US furniture and electronics imports, but under 4 percent in apparel.
US lighting imports (HS 9405) hit $9.17B in 2024. China fell to 36.7% as Vietnam, Cambodia, and Mexico took share. See the 2026 tariff stack by origin.
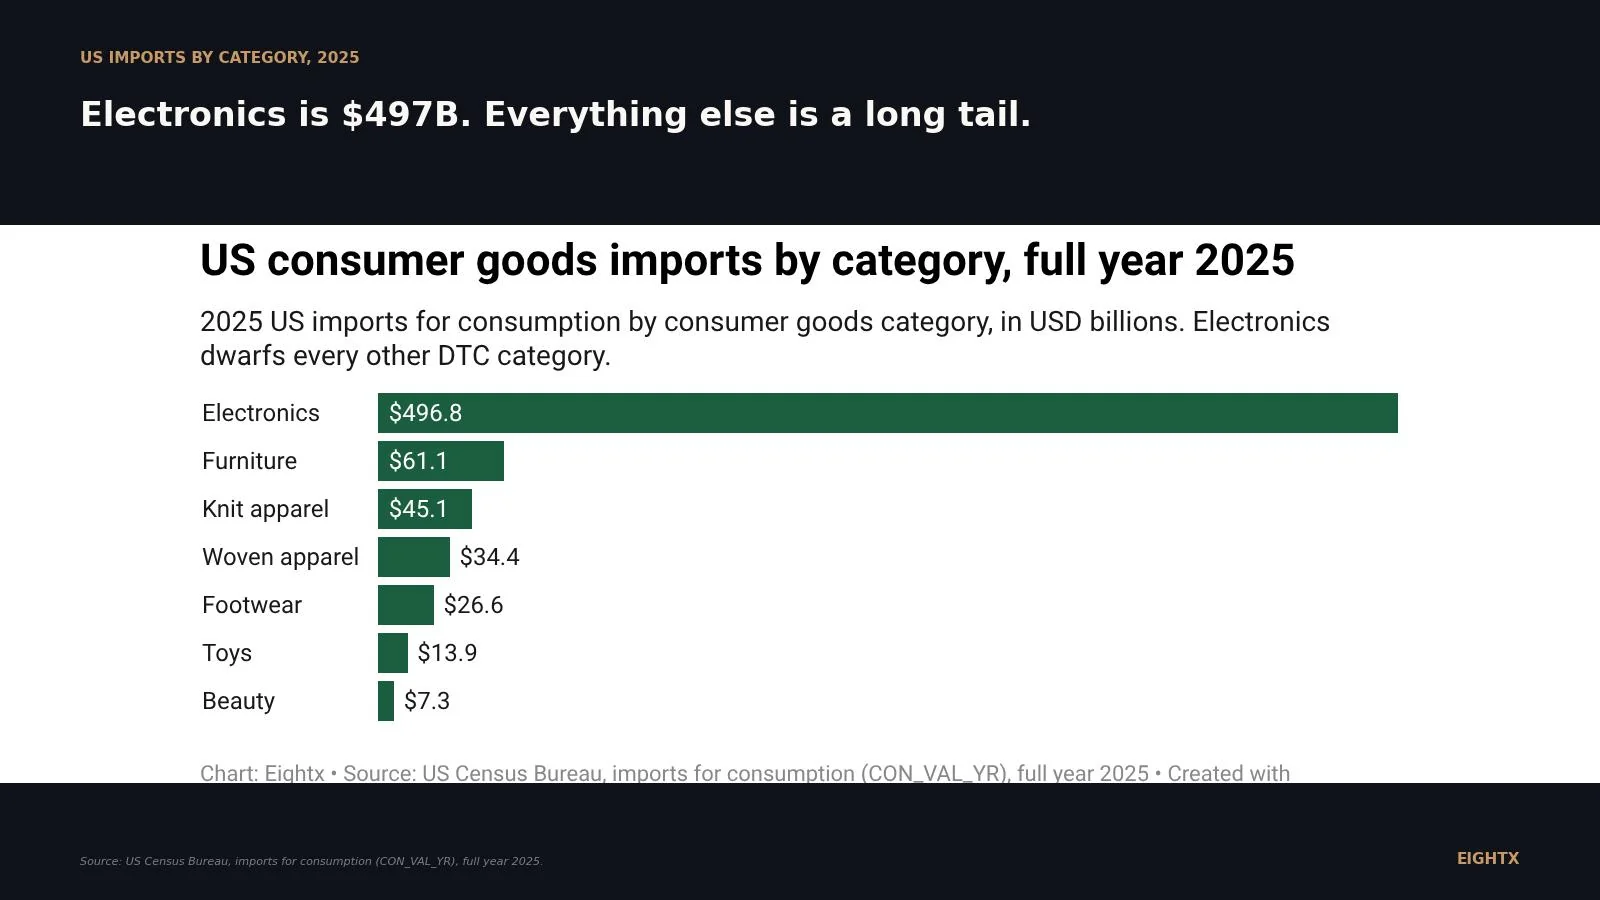
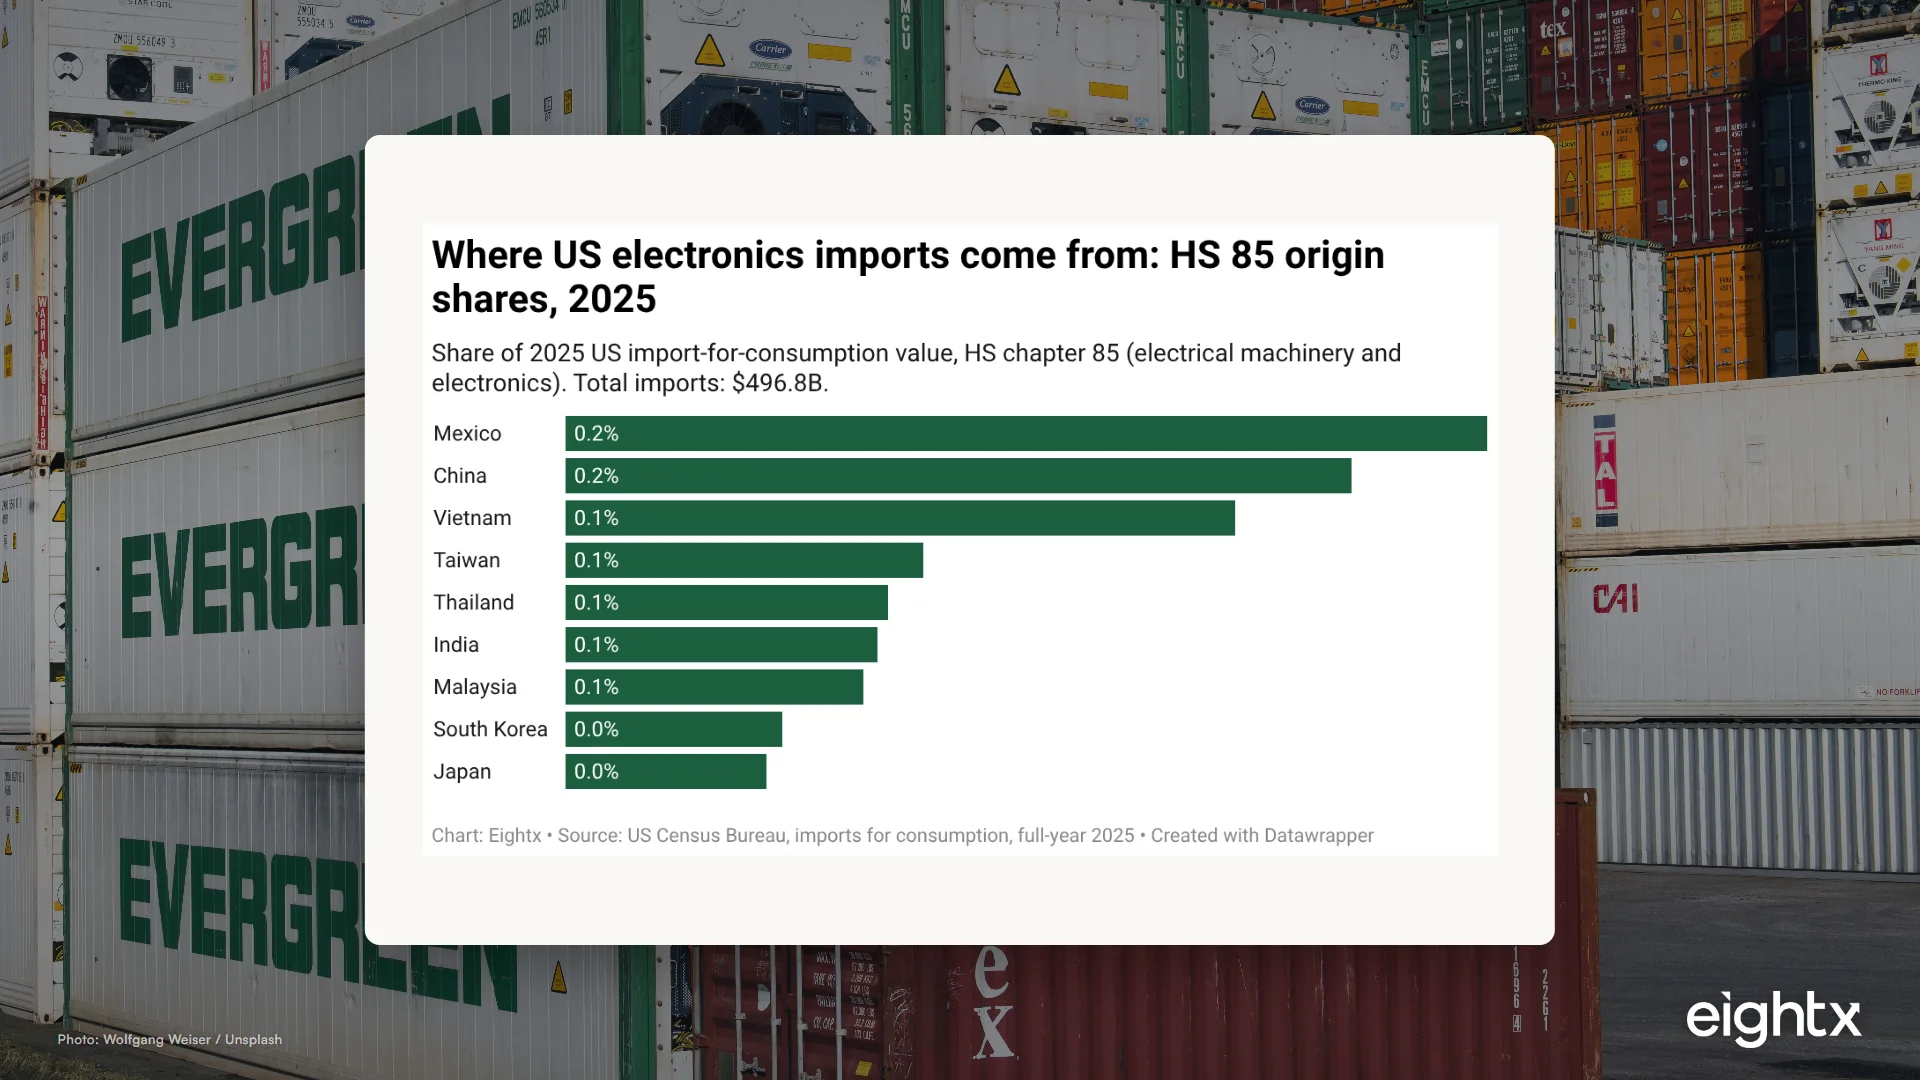
Census 2025 data ranks the biggest US consumer-goods import flows by value. Electronics dwarfs the rest at $497B. Here is what category scale means for DTC sourcing.
The six cash flow KPIs a DTC CEO should review every Monday, each with a formula and a threshold that triggers action before the bank balance forces it.
Venture debt for DTC brands explained: how it extends runway with less dilution, the true cost of rate plus warrants plus fees, when it fits, and when it is dangerous.
Utz Brands earned just $0.8M on $1.44B of FY2025 sales, and its gross margin didn't collapse, it got reclassified. Here's what the 10-K actually shows.
Under Armour posted a $496M FY2026 loss but ~$50M adjusted net income. We read the 10-K like a CFO: margins, marketing cuts, inventory, cash, and channel mix.
An operator-grade teardown of Traeger's 10-K: revenue down to $559.5M, gross margin back to 39.2%, a $74.7M goodwill wipe, and a $403M term loan on $20.5M of cash flow.
ThredUp's FY2025 10-K read like a CFO: $310.8M revenue (+20%), 79.4% gross margin, $13.5M adjusted EBITDA, and a $20.2M GAAP loss carrying $19M of stock comp.
An operator-grade teardown of Stitch Fix's 10-K: revenue fell ~40% to $1.27B, yet SG&A was cut ~$470M and free cash flow turned positive.
Solo Brands revenue fell 39% from its 2022 peak and the company wrote off $358M of goodwill. The CFO read on what the Solo Stove 10-K actually shows.
A CFO's ranking of the best accounting software for Shopify in 2026: QuickBooks, Xero, Finaloop, A2X and Zoho, with real pricing, ratings, and a best-for on each.
The best accounting software for Amazon sellers is not one tool. It is a ledger plus a settlement connector. A CFO's opinionated 2026 ranking, best-for-X.
Shopify lifted its share buyback to US$5 billion in June 2026 on $476M free cash flow. What the capital-return signal means for merchants.
New Fed and Kearney data complicate the K-shaped economy. The middle class didn't melt, it moved, changing how DTC brands should price in 2026.
A transparent tariff exposure index ranking DTC verticals by import reliance, China share, and 2026 effective duty. Toys score 100, beauty just 5.
One DTC price becomes four margins across Amazon, Sephora, Ulta and wholesale. The CFO's channel-and-margin pricing playbook for beauty brands, with real 2026 data.
Apparel pricing is a margin decision, not a markup one. The 2026 playbook: price by channel, net of returns, and through the tariff squeeze.
The median cash conversion cycle across public electronics comps is ~78 days (SEC 10-Ks). Here is the operator math on why profitable electronics brands run out of cash.
Coffee is a cash-flow trap disguised as a margin business. The cash conversion cycle math behind why a profitable coffee brand still runs out of cash, with public-comp data.
Beverage brands go broke while profitable because cash lags 60-90+ days. The cash conversion cycle, net terms, seasonality, and the levers that close the gap.
Beauty has the fattest gross margin in consumer (~69%) and the emptiest bank account. Here is the cash conversion cycle math, the Q4 trap, and how to fund the gap.
An operator's teardown of Estée Lauder's FY2025 10-K: a 74% gross margin, a $785M operating loss, SG&A at 66% of sales, and $1.29B of brand impairments.
Deckers does $5.47B at 57.7% gross and 23.1% operating margin. We read the FY2026 10-K the way a CFO would diligence your DTC brand, and pull the benchmarks.
Black Rifle Coffee did $398M in FY2025 and ended the year with $4.3M cash. A CFO reads the 10-K: 660 bps of margin loss, a flat top line, and a wholesale pivot.
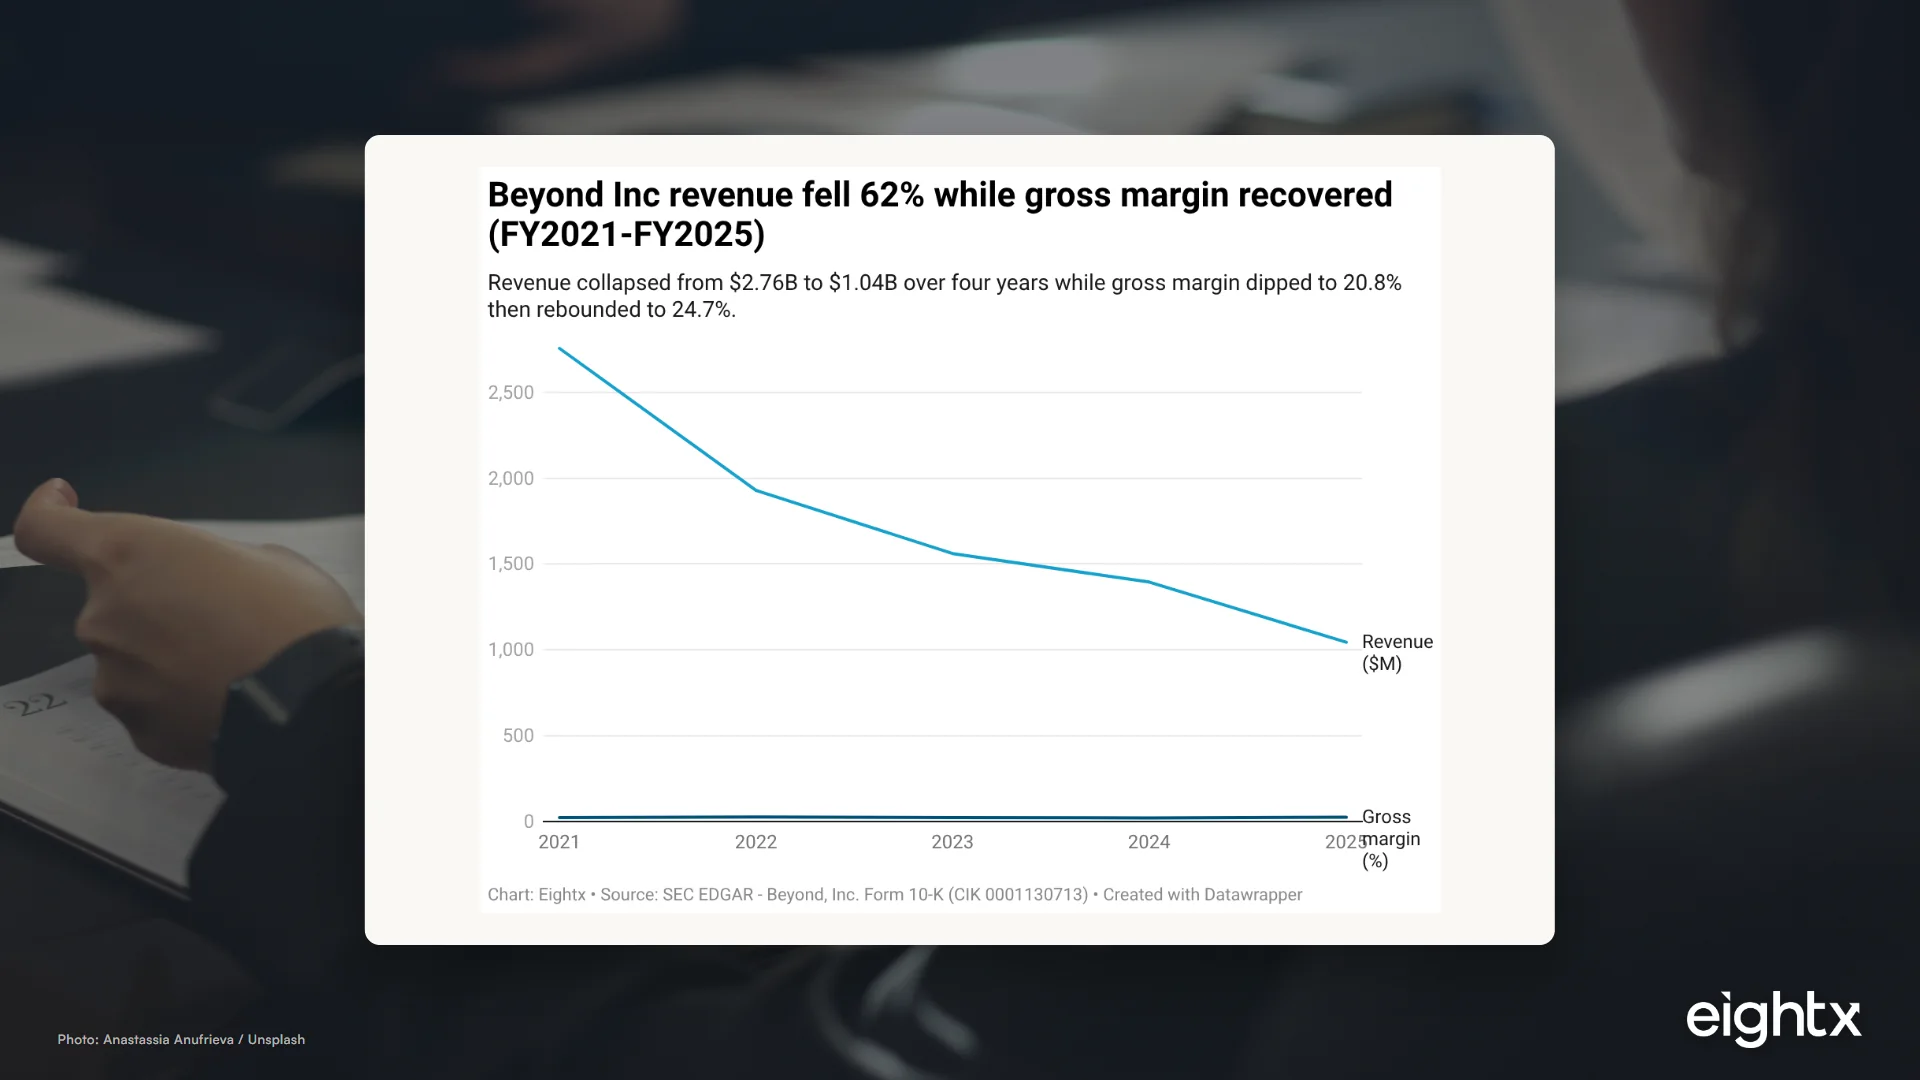
Beyond Inc (BYON) shrank revenue 62% in four years, then snapped gross margin back to 24.7%. An operator's teardown of the 10-K, cash flow, and dilution.
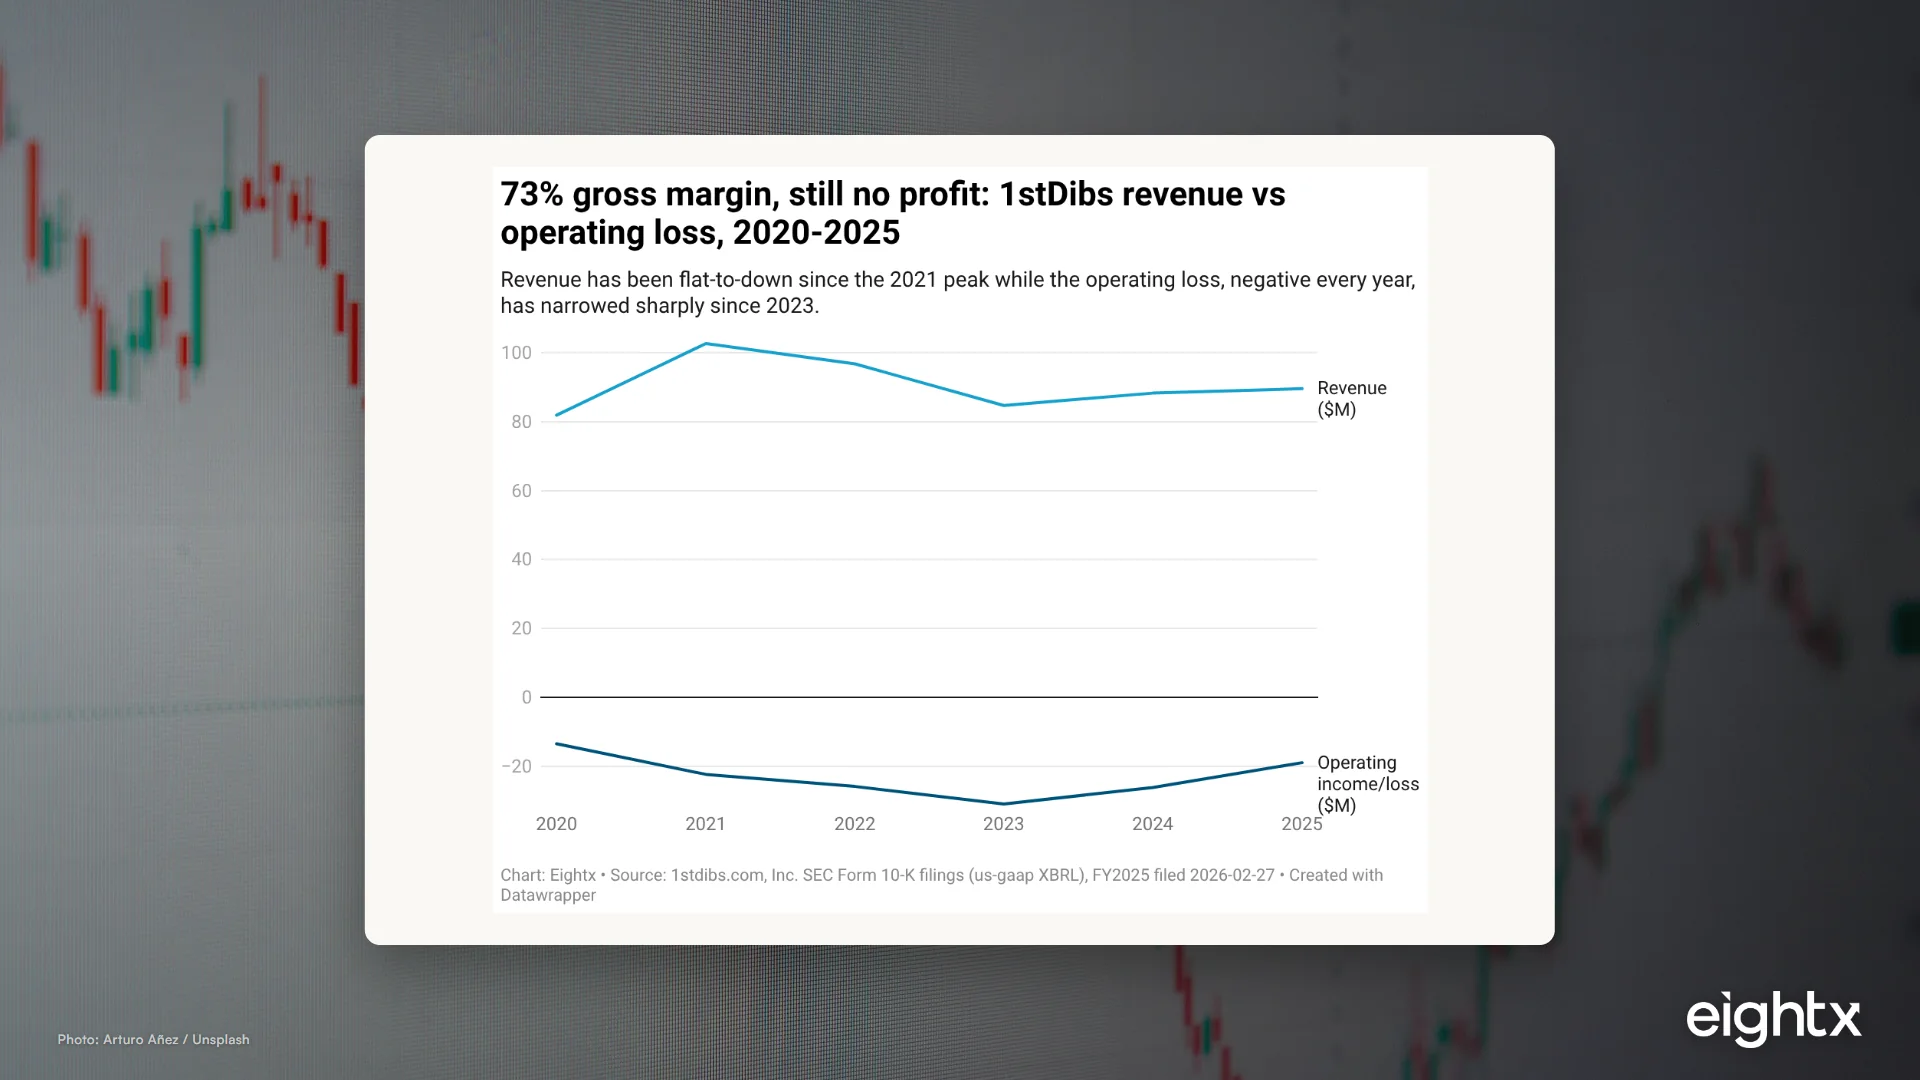
A CFO-grade teardown of 1stDibs (NASDAQ: DIBS). FY2025 revenue $89.6M, 73% gross margin, fifth straight operating loss. Where 73 points of margin actually go.
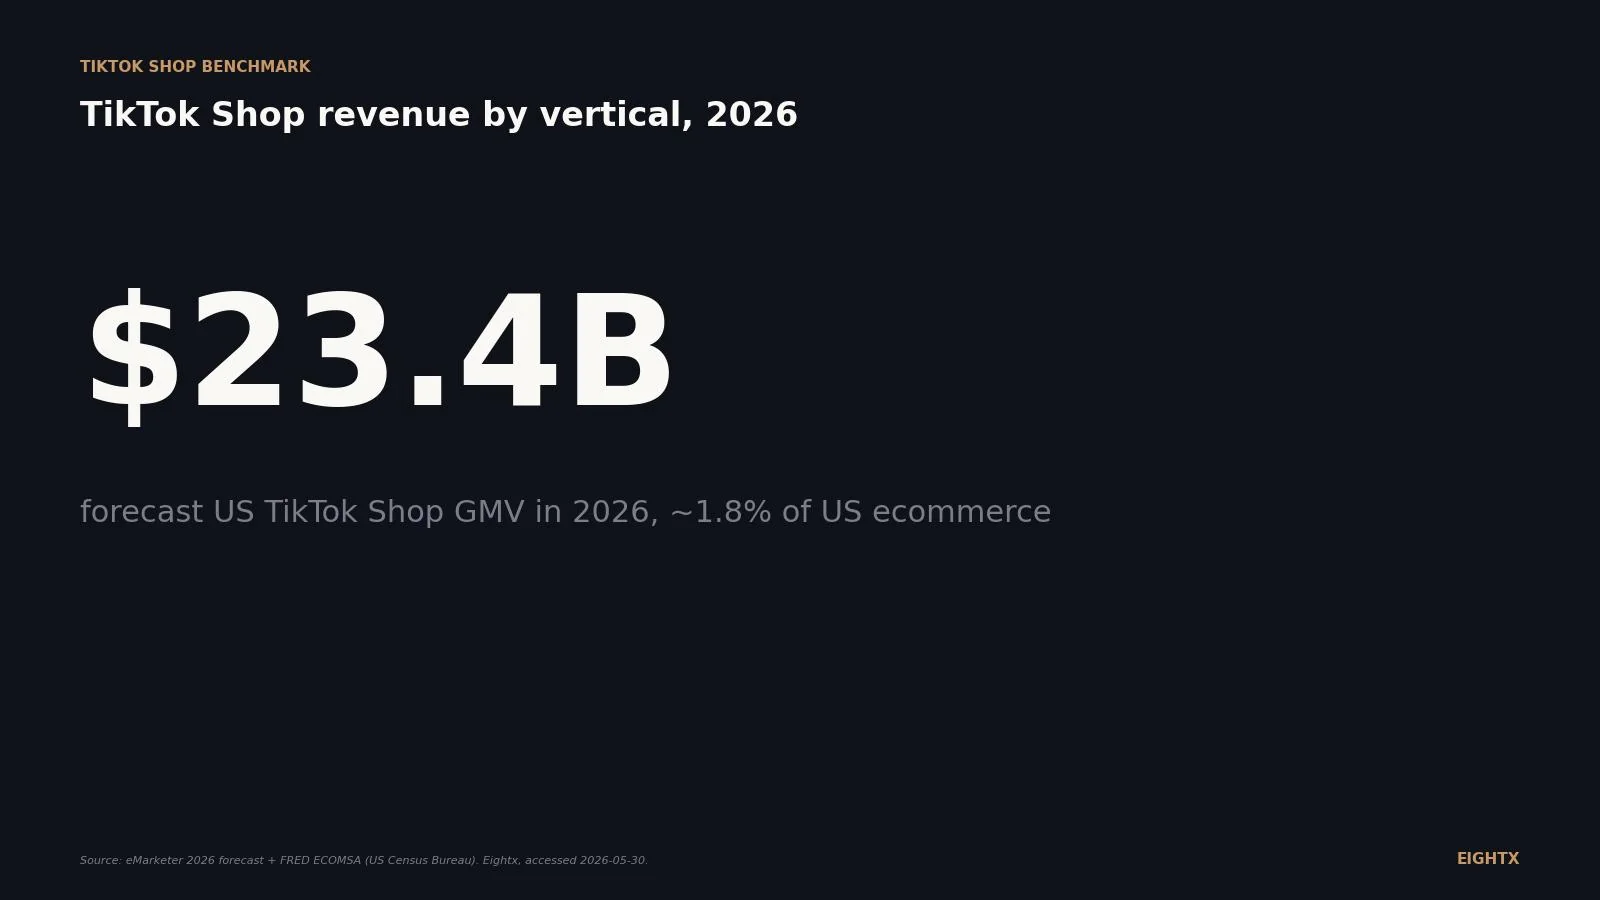
TikTok Shop will do $23B in US GMV in 2026 and beauty is its hottest category. But the average buyer spends $118 a year and 30% defect to Temu. The CFO read on the channel.
Sleep Number filed Chapter 11 with a $415M sale. A teardown of how a household brand at a 59% gross margin went bankrupt: negative equity, $540M+ debt, near-zero cash.
A class action says Amazon raised prices for tariffs then keeps the refunds. The real CFO question for sellers: if IEEPA tariffs are struck down, who gets the money back?
Asia-US container rates jumped to ~$4,000-6,000 per FEU in June 2026, the highest since mid-2025, as brands frontload ahead of July tariffs. What it does to your landed cost.
Crocs did $4.04B at a 58% gross margin and still posted a loss quarter. The CROX teardown: what a $737M HEYDUDE writedown teaches operators about buying a second brand.
Coty's FY2025 10-K shows a 64.8% gross margin on shrinking revenue. We read the segments, the $1.57B marketing line and the debt the way a CFO would diligence them.
Brilliant Earth (BRLT) added ~800bps of gross margin from 2021-2025 yet slid to its first operating loss. A CFO-grade teardown of the P&L for ecom operators.
NZ has the cheapest Meta CPM in the English-speaking world (US$9.01), yet CAC still bites. The 2026 customer acquisition cost benchmark for Kiwi DTC, in NZD.
NZ's national online average order value is NZD $120 in 2025 (NZ Post). Here is the AOV benchmark by vertical for New Zealand DTC brands, and the levers that move it.
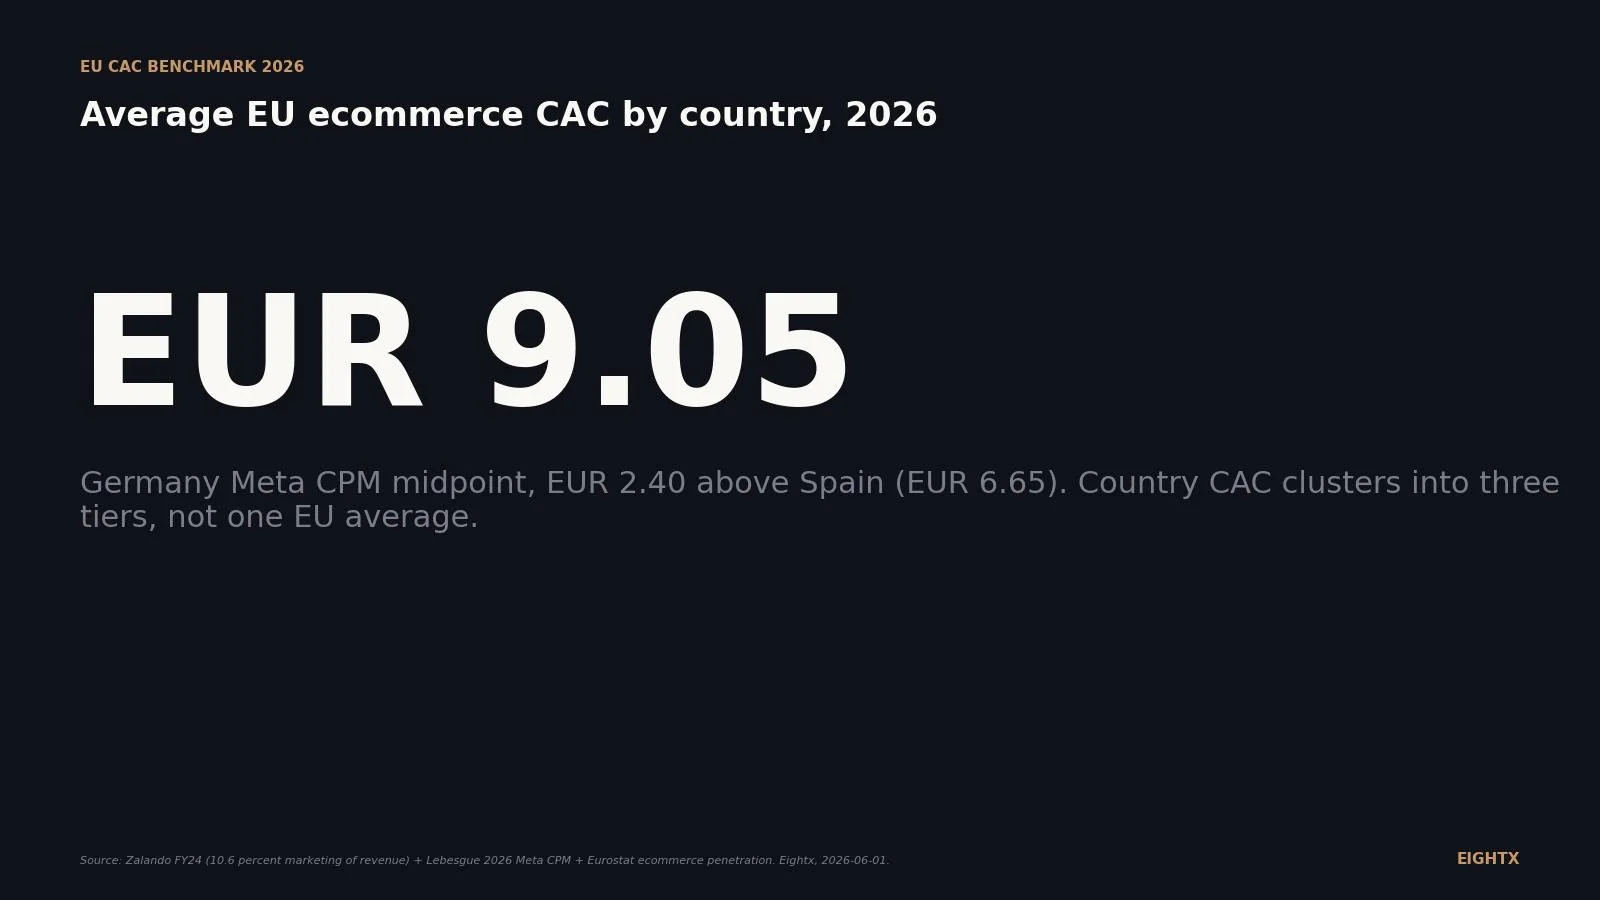
What a German DTC brand actually pays to acquire a customer in 2026: blended CAC of €60-110, the EU's highest Meta CPM at €9.05, CAC by vertical, and the payback math.
No official Germany-only AOV in euros exists. The 2026 read for DTC operators: the EMEA proxy near 185 EUR, the 50%+ returns drag, and the real levers that move basket size.
EU DTC brands pay roughly €65 to €110 blended CAC, and Germany runs ~30% above Spain. The 2026 benchmark by vertical, country, and the LTV:CAC line that matters.
EMEA runs the world's highest baskets at ~€184 per order. The EU ecommerce AOV benchmark for 2026, by country and vertical, and how to lift it.
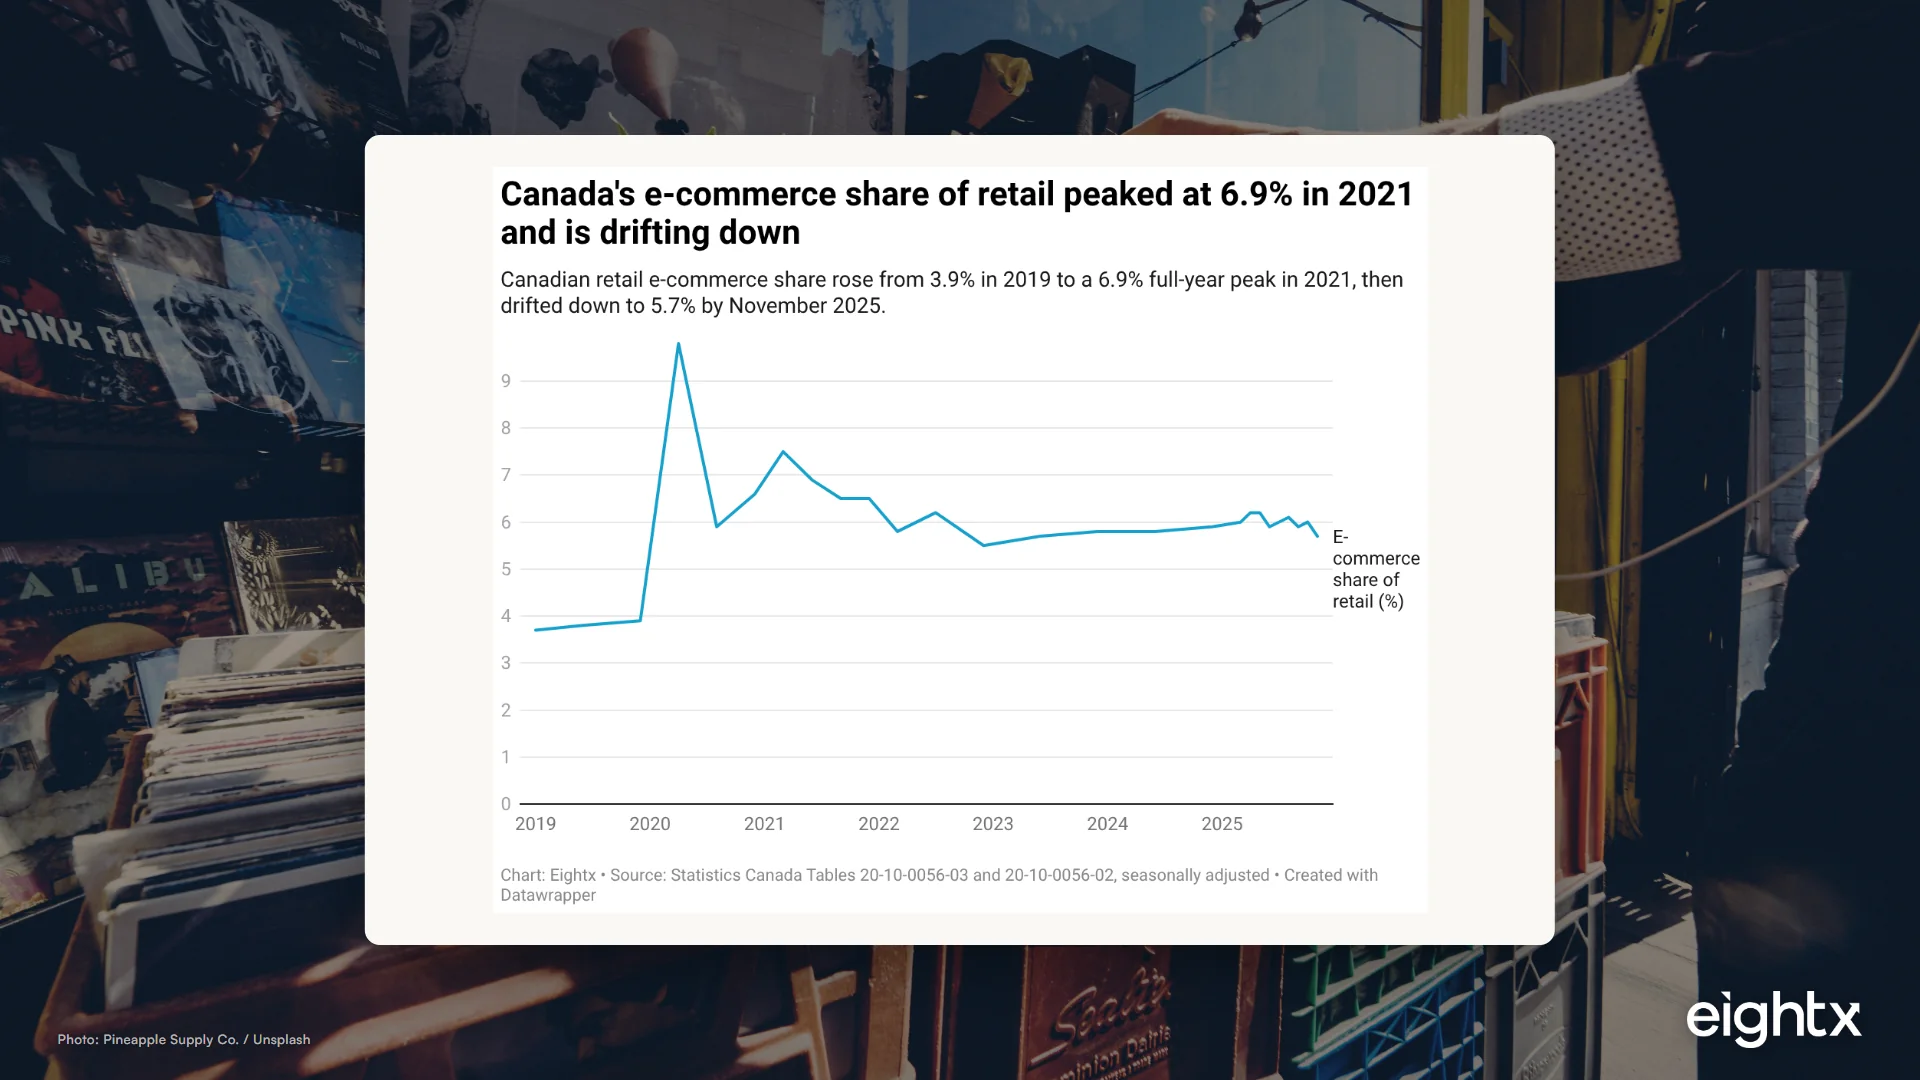
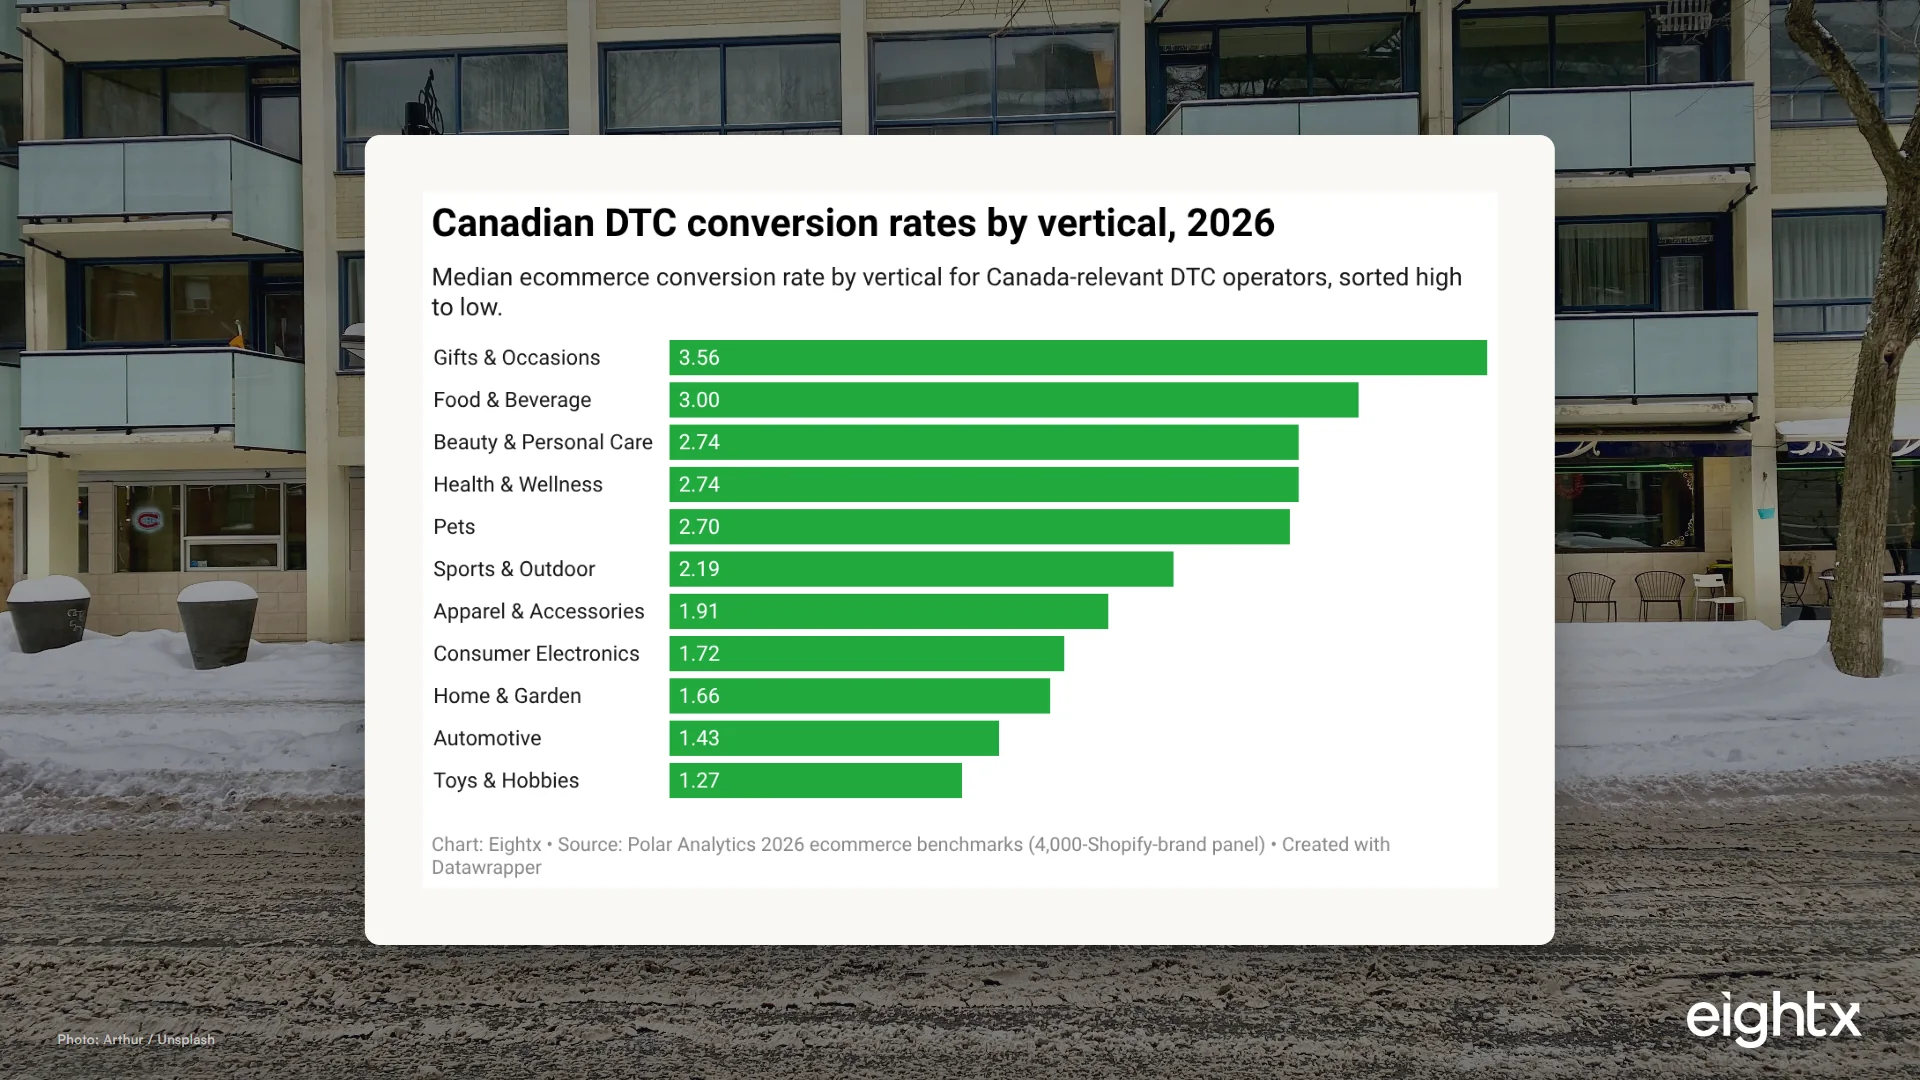
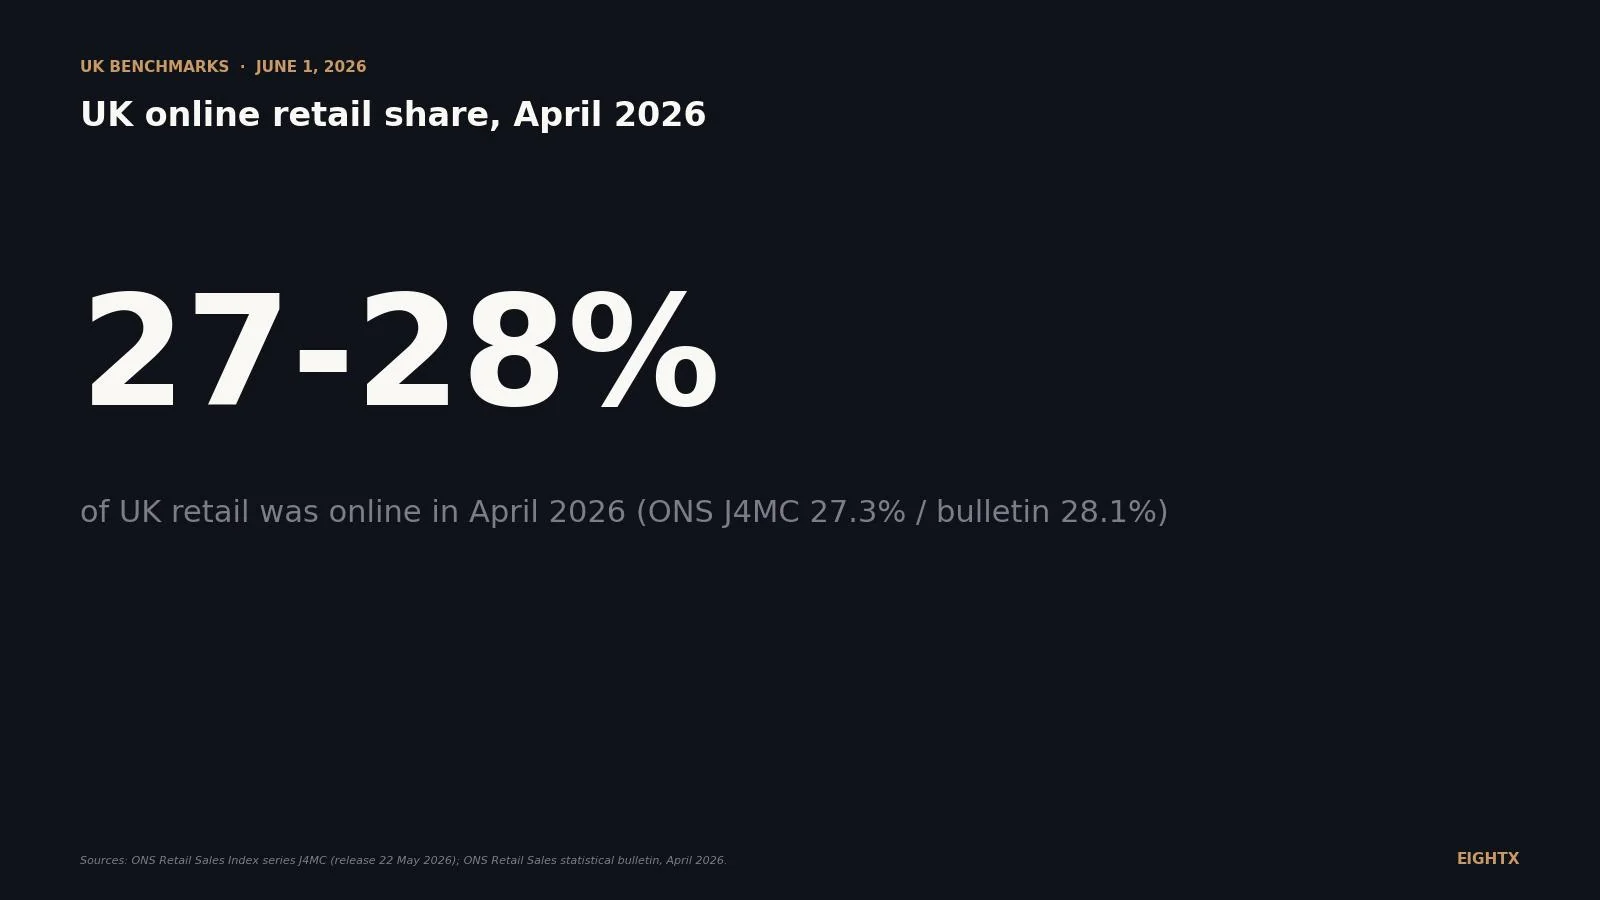
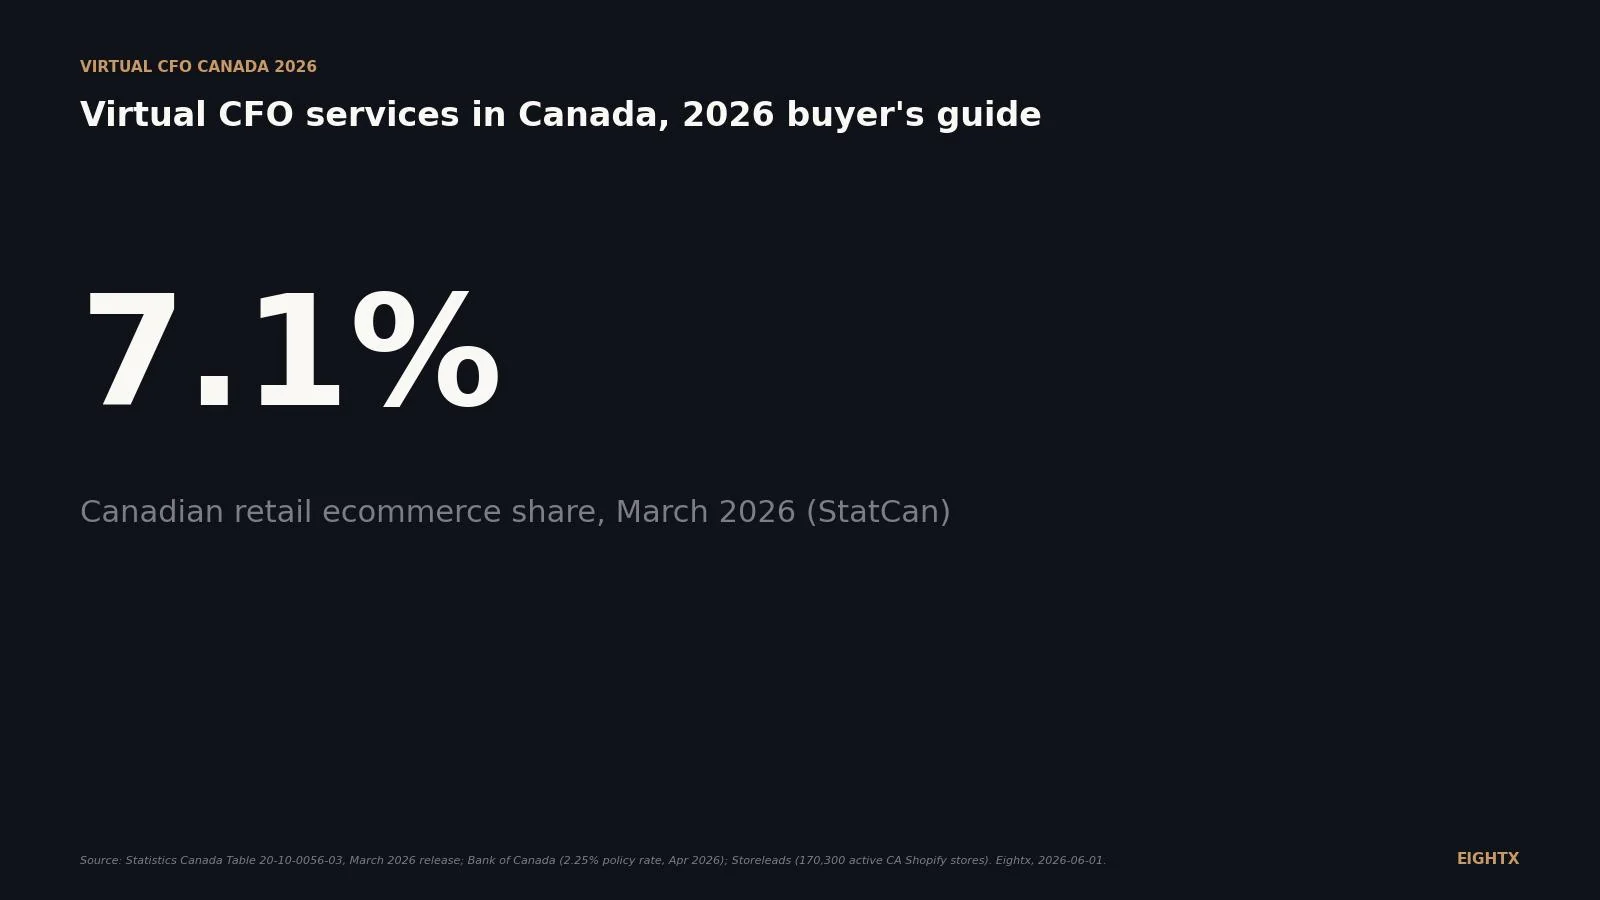
Canada's e-commerce share of retail trade hit 7.1% in March 2026 (StatCan), versus ~21% in the US and ~28% in the UK. What the under-penetration means for your DTC brand.
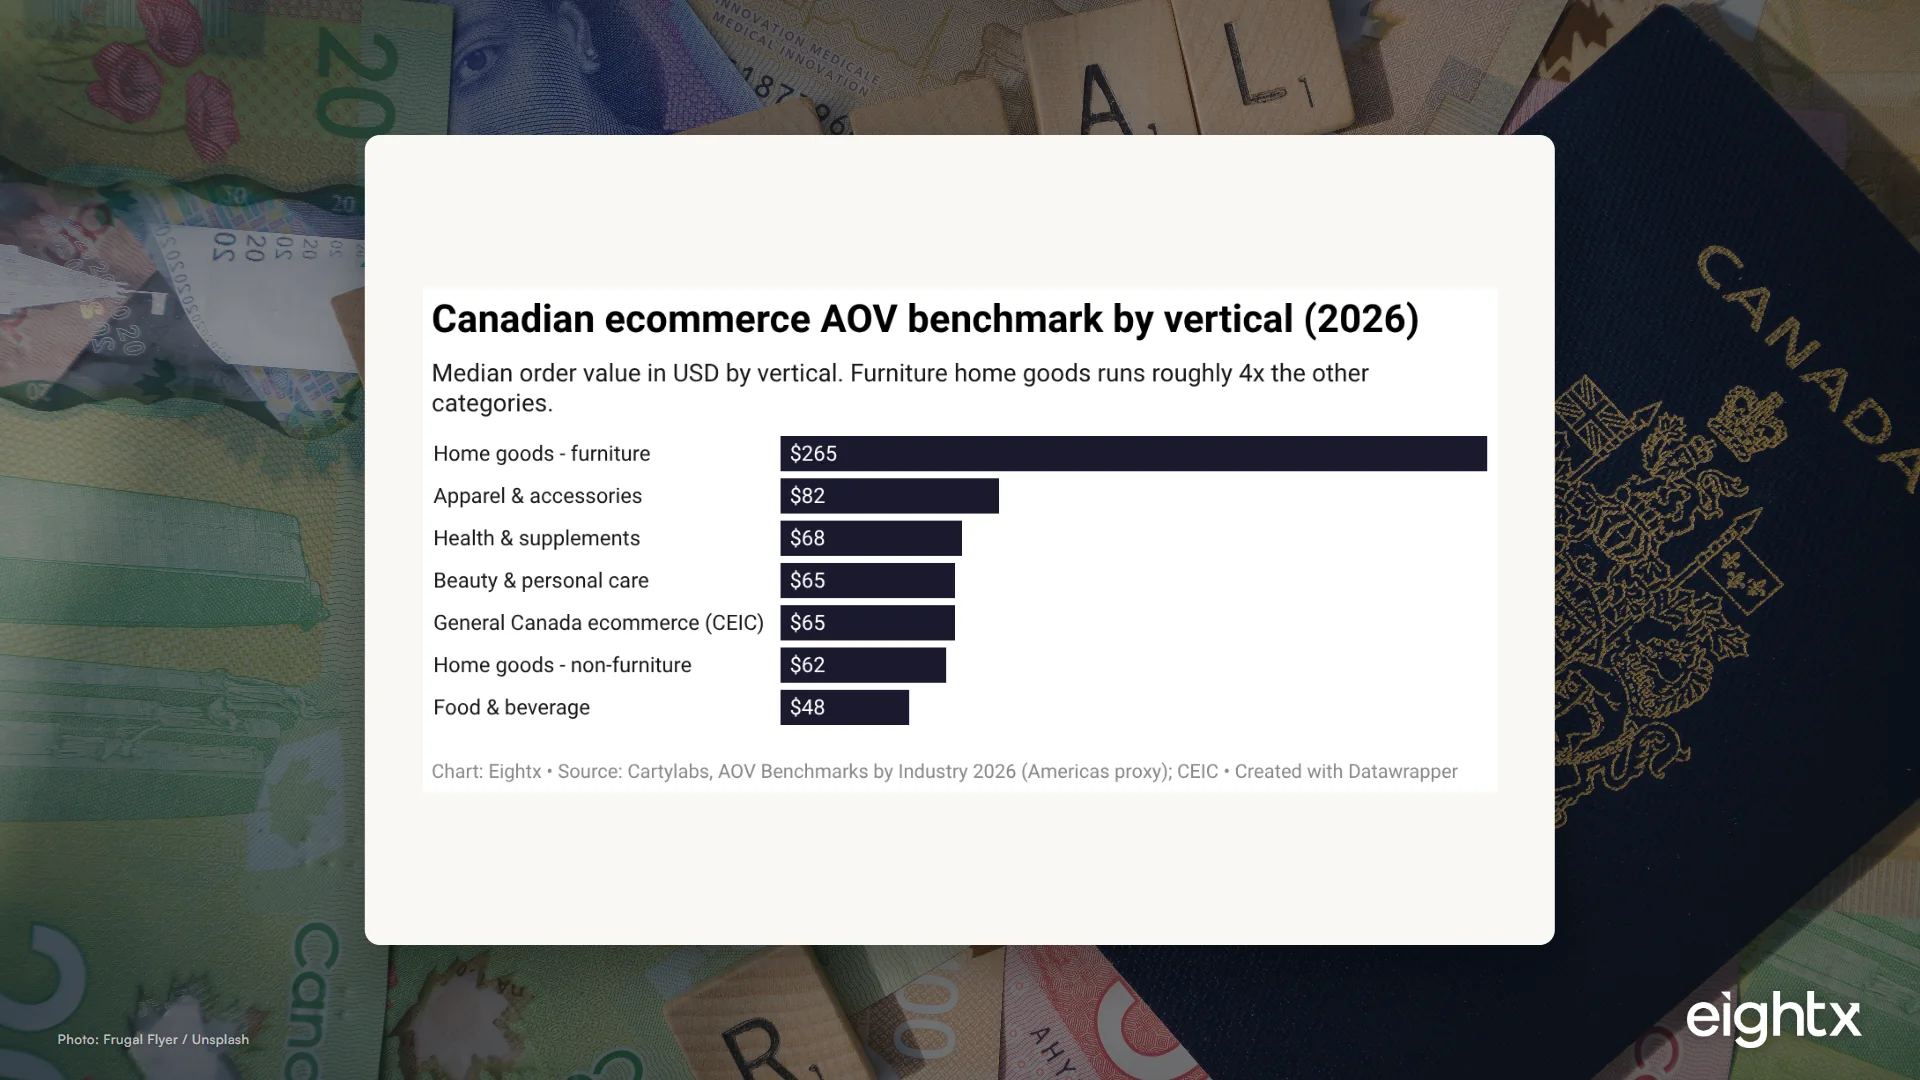
Canadian ecommerce AOV sits near C$91 (US$65) in 2026. Benchmark your order value by vertical, plus the FX and free-shipping levers that move it.
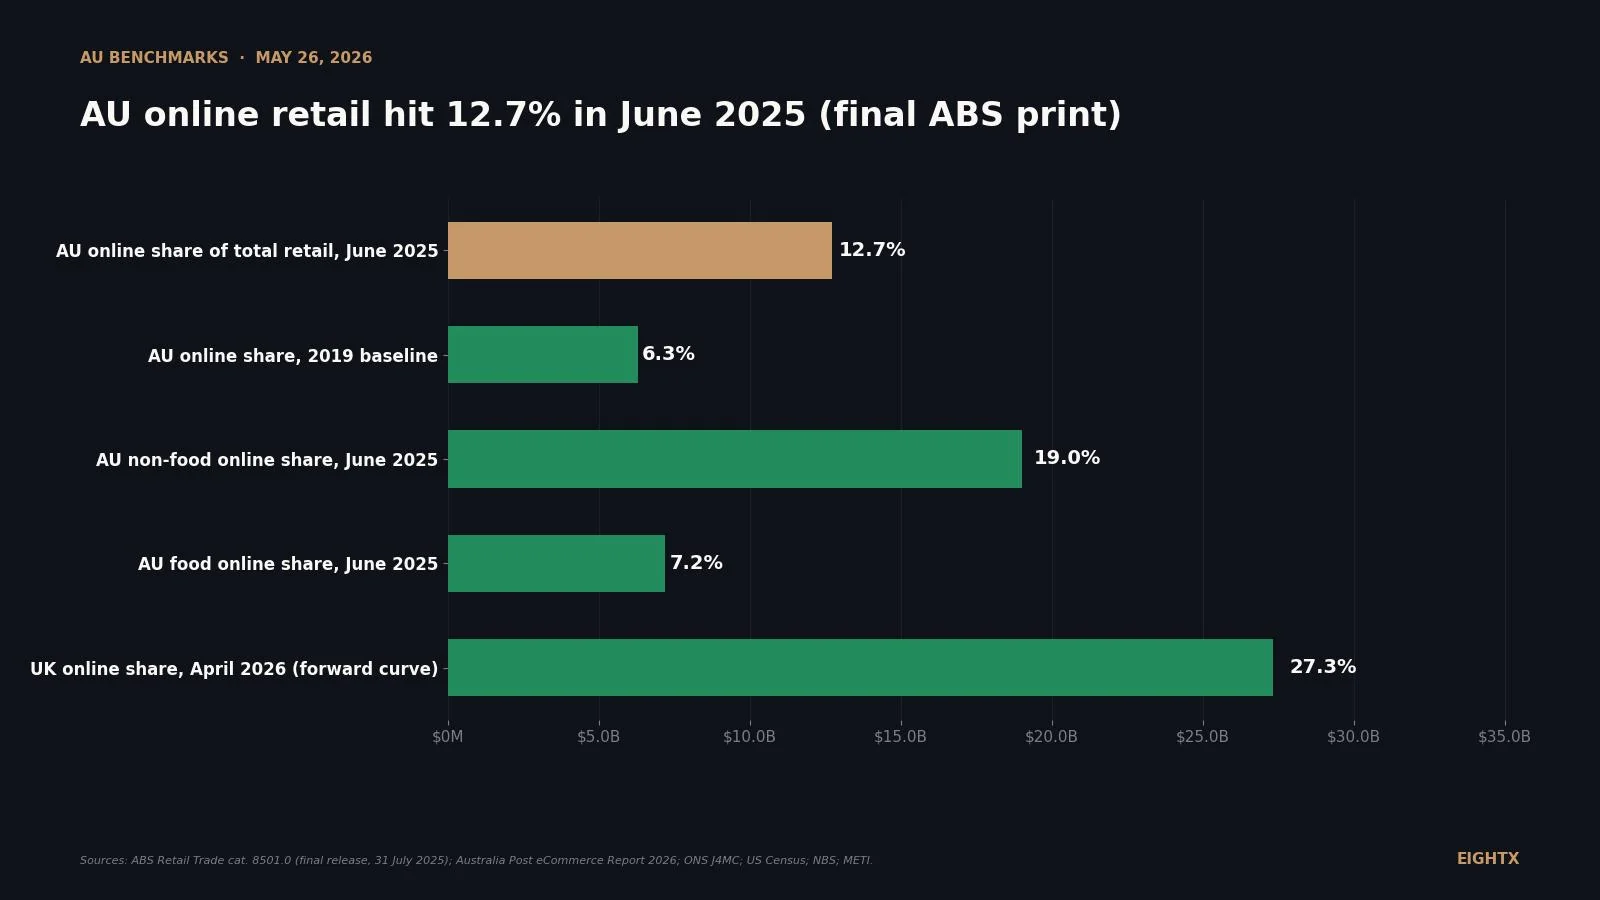
Online hit 12.7% of Australian retail in June 2025 (ABS), a third of US penetration. The non-food vs food split, the ABS vs NAB gap, charted, for operators.
There is no official Australia-only AOV benchmark, so we built one. Average order value by vertical on AU Shopify data, against the global ruler, charted on ABS stats.
Cambodia overtook China as the #1 origin for US leather goods (HS 4202) in 2025. The import map by country, the 2026 tariff stack, and what it does to your landed cost.
China supplies 81% of US steel kitchenware imports (HS 7323). A China-origin SKU carries a ~38% stacked 2026 duty vs ~13% from Vietnam. The origin map, charted.
China passed Italy as the #1 source of US eyewear imports and now carries a ~22% duty stack vs Italy's 15% cap. The 2026 HS 9004 origin-and-tariff map.
US coffee imports hit $12.6B in 2025 (HS 0901). Where it comes from by country, the 0%-to-10% tariff timeline, and what it does to a DTC coffee brand's margins.
Shopify Q1 2026: revenue $3.2B up 34%, GMV $101B, $476M free cash flow, yet a $581M GAAP net loss. Why the headline is wrong and what it signals for your store.
Klaviyo Q1 2026: revenue $358M up 28%, first positive GAAP operating income, $9M net income, and a $100M buyback. What a profitable Klaviyo means for your brand.
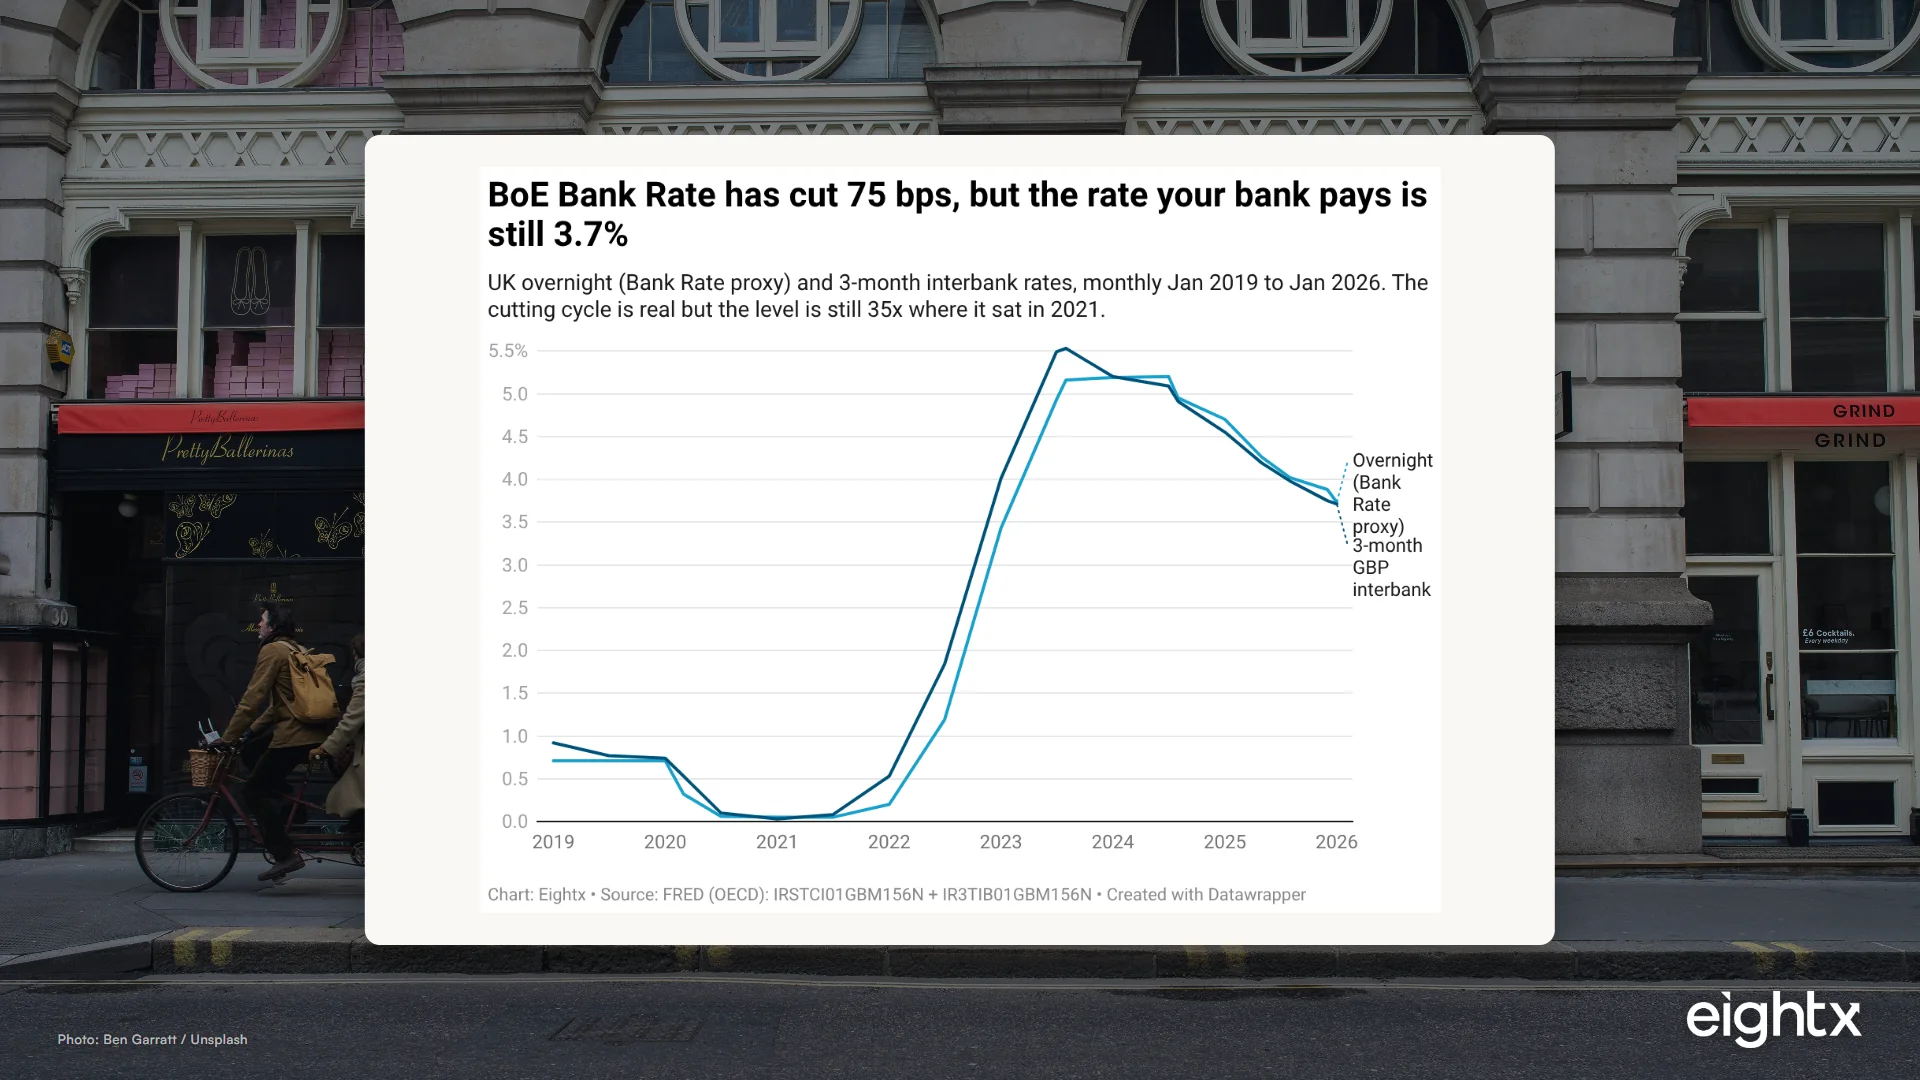
The BoE base rate is 3.75%, but UK DTC brands pay 15-60%+ on real financing. Here is the full WACC picture for 2026: debt cost, cost of equity, and blended.
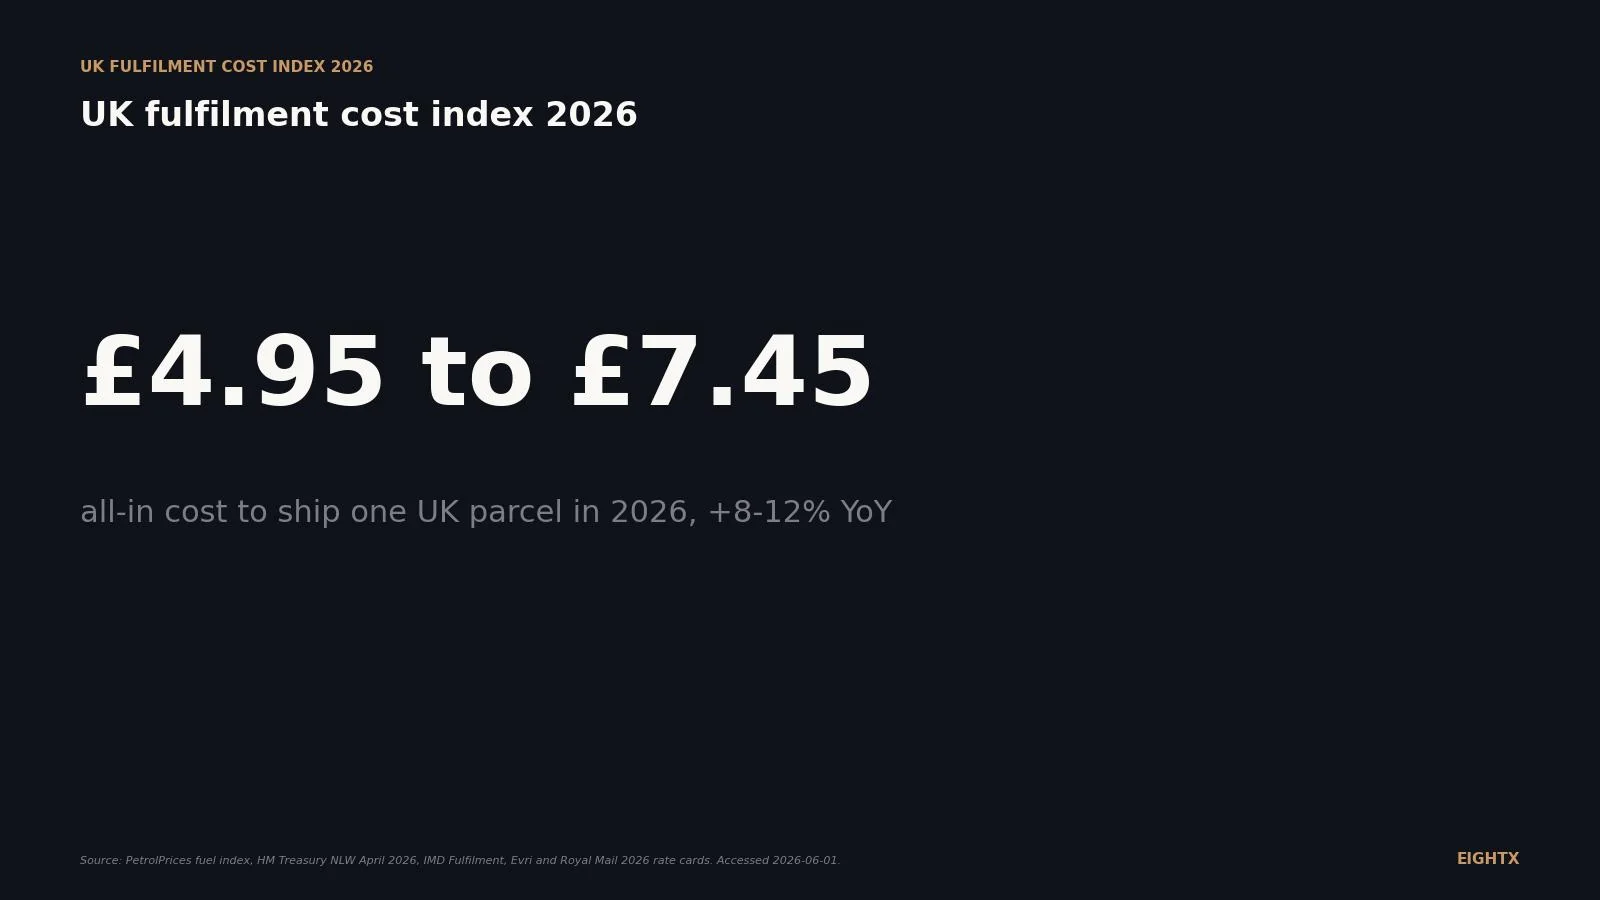
What UK 3PL fulfilment actually costs in 2026: pick-and-pack £0.45 to £2.20 per order, pallet storage £3 to £5 a week, all-in £2 to £6, built on ONS data.
The RBNZ cut the OCR to 2.25%, but your real New Zealand DTC hurdle rate is closer to 18-28%. Here is what capital actually costs a Kiwi brand in 2026.
What a NZ 3PL should cost per order in 2026: pick-pack NZ$3.50-6, storage NZ$20-40/pallet, plus the island-logistics premium and April import levies.
The all-in cost of capital for a German DTC brand in 2026, built from ECB, bund, and KPMG numbers: a low-to-mid-teens hurdle rate after the ECB stopped cutting.
German 3PL benchmarks for 2026: pick-and-pack €1.50-2.50 per order, pallet storage €8-15 per month, all-in €5-9 per order. Built on Eurostat and ECB data.
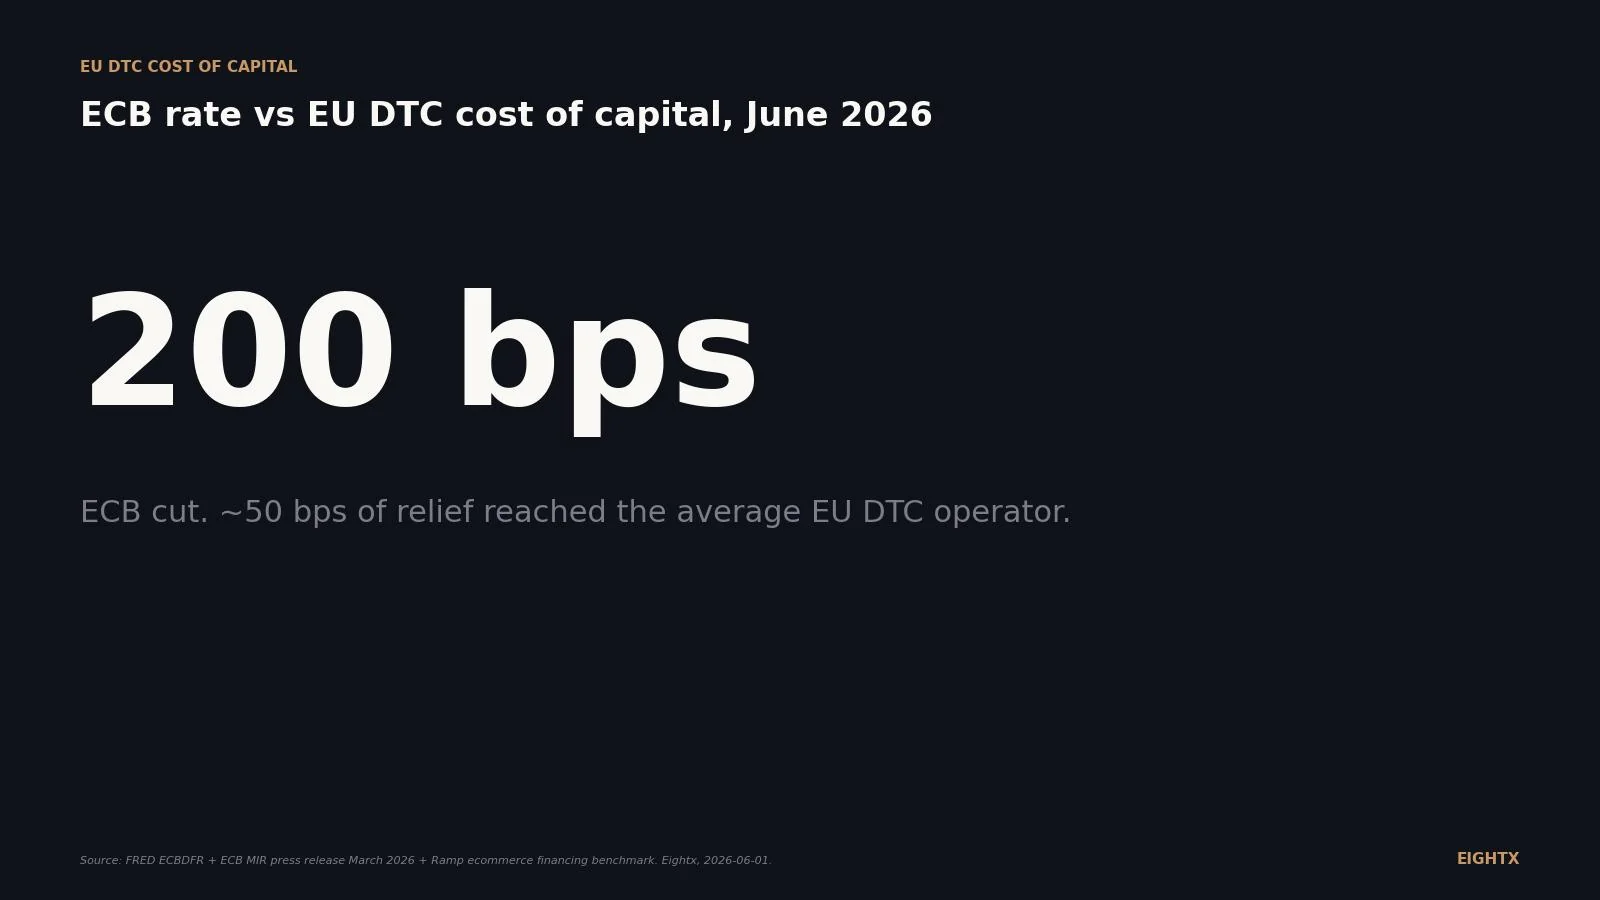
The ECB sits near 2.4% but a European DTC brand's real cost of capital is 18-28%. The 2026 EU hurdle rate to use on your next inventory buy, charted.
Europe's 2026 3PL cost index, built on ECB and Eurostat data: pick-and-pack EUR2-4 per order, EUR4-7 all-in ex-postage, plus the July de minimis shock.
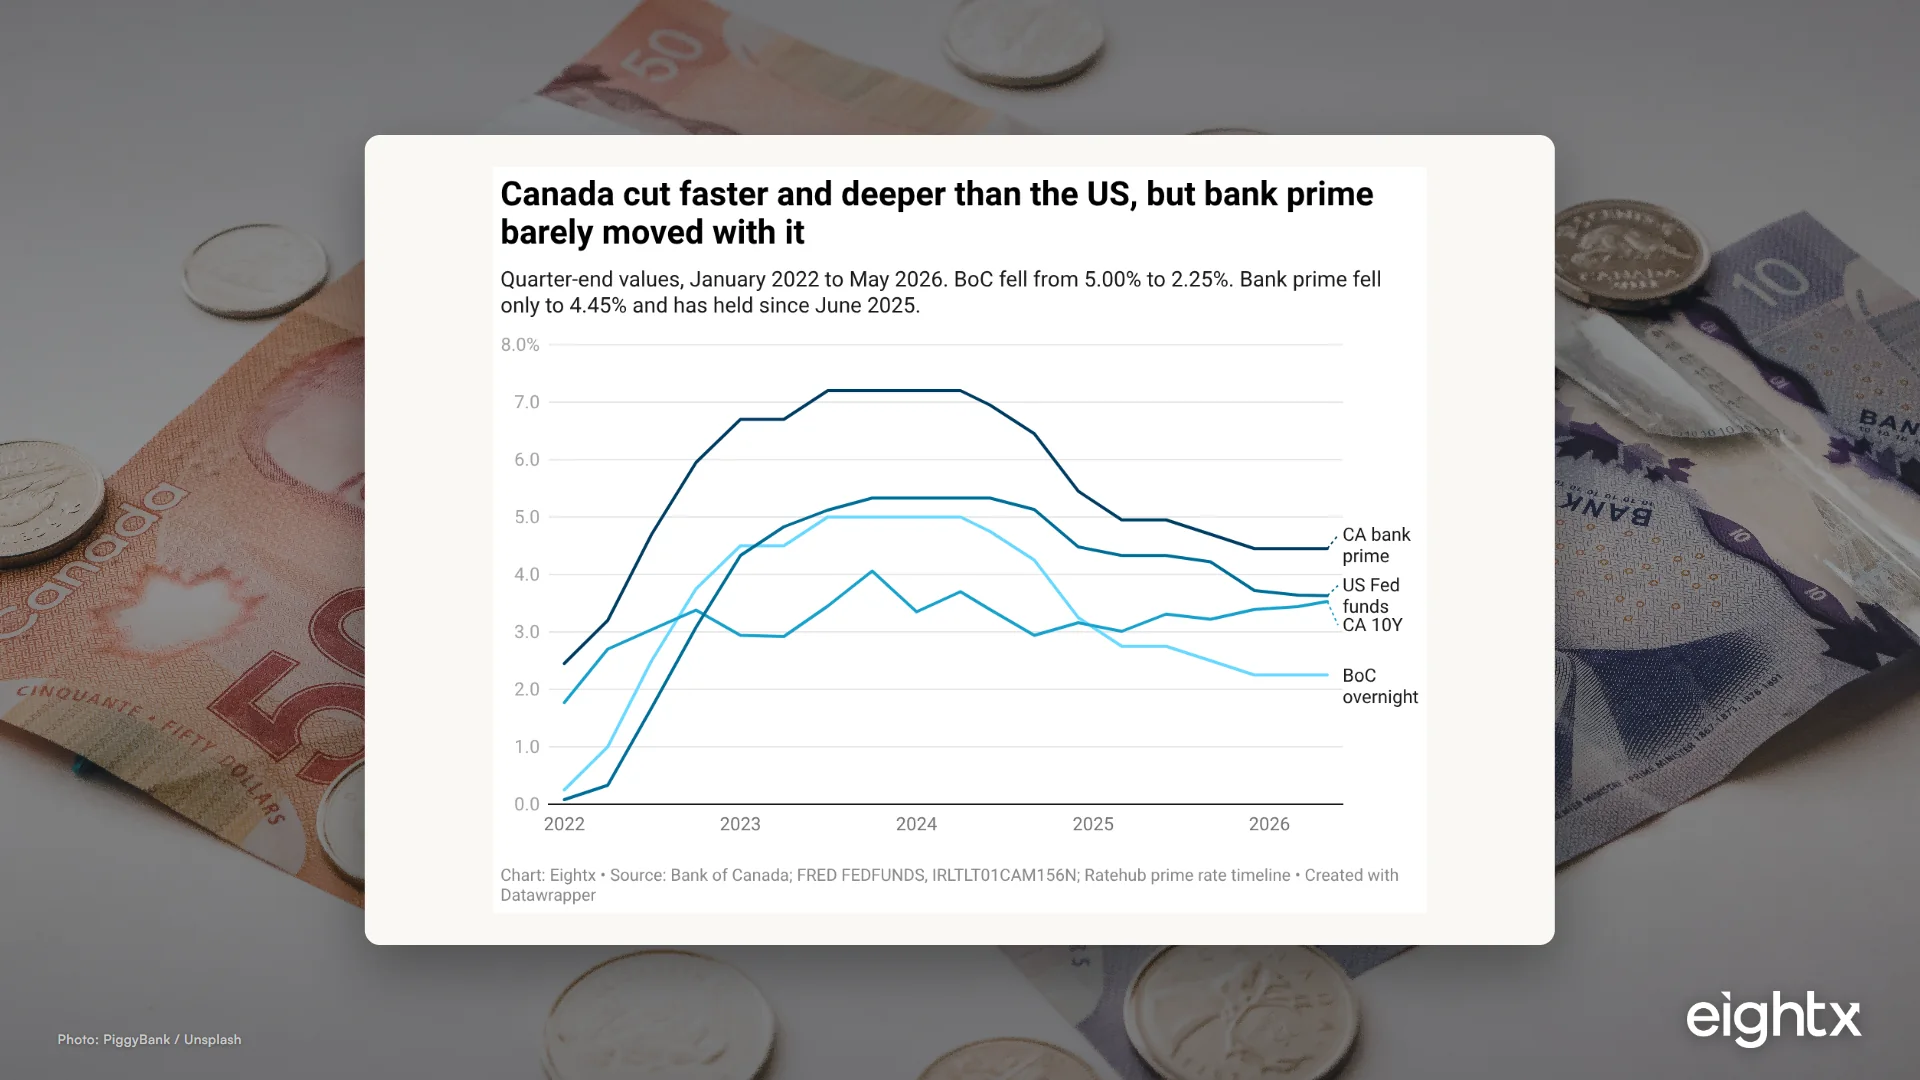
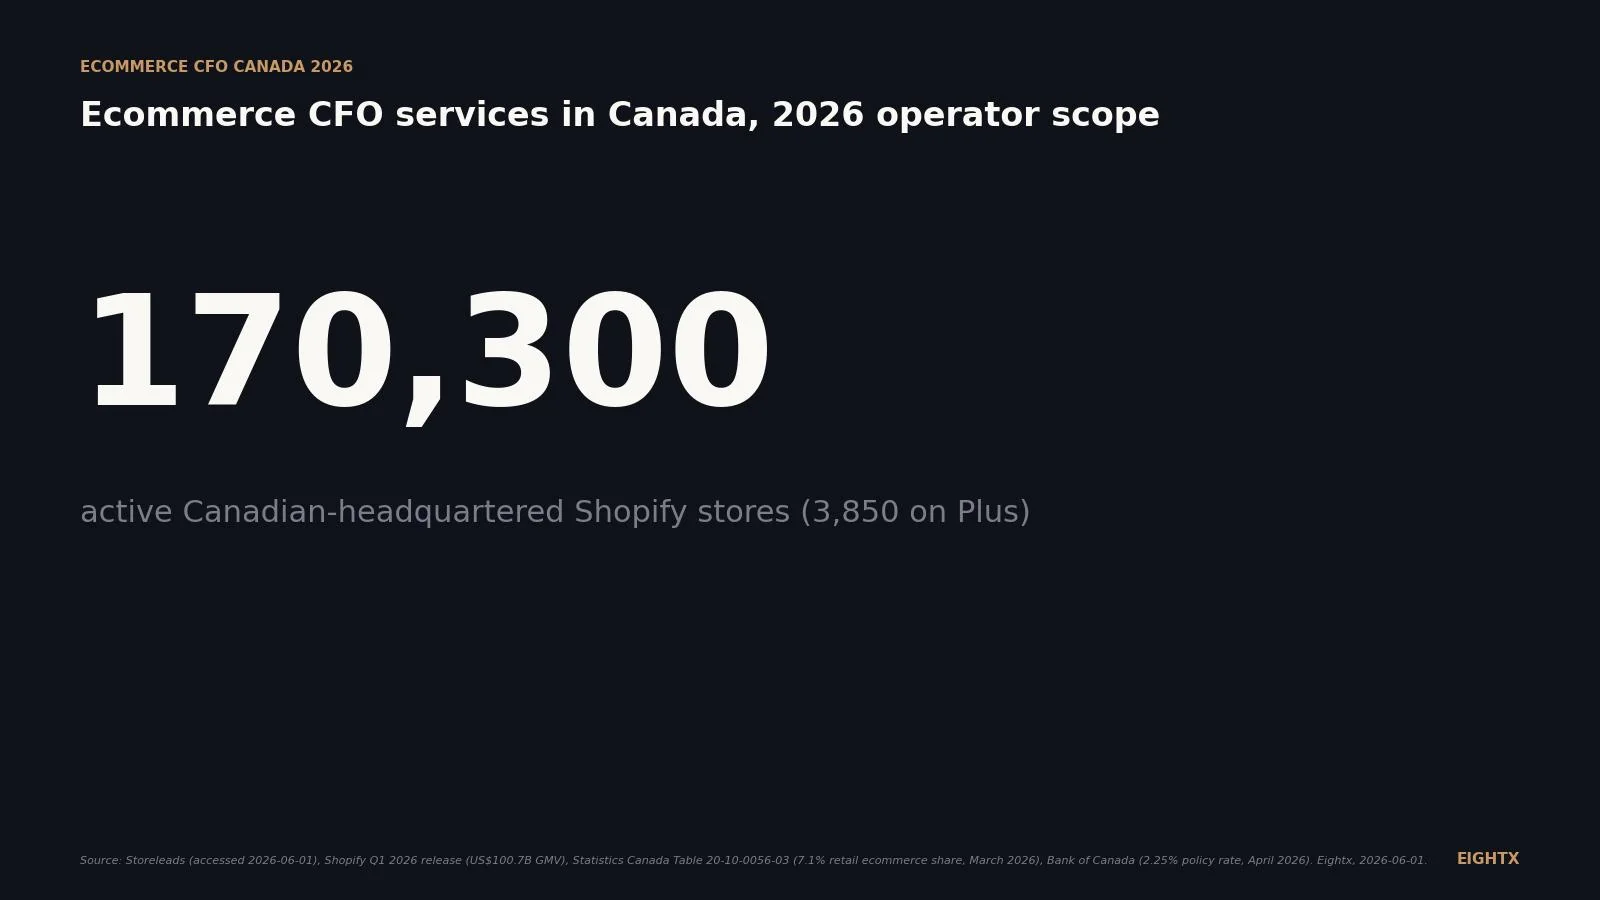
The Bank of Canada cut 275bps to 2.25%, but Shopify Capital, Wayflyer, and Clearco still run 16-40% APR for Canadian DTC brands. Here's your real hurdle rate.
Canadian 3PL benchmarks for 2026: pick-and-pack C$2.50-4 per order, storage C$15-30 per pallet, all-in C$8-15 per order. Built on StatCan and BoC data.
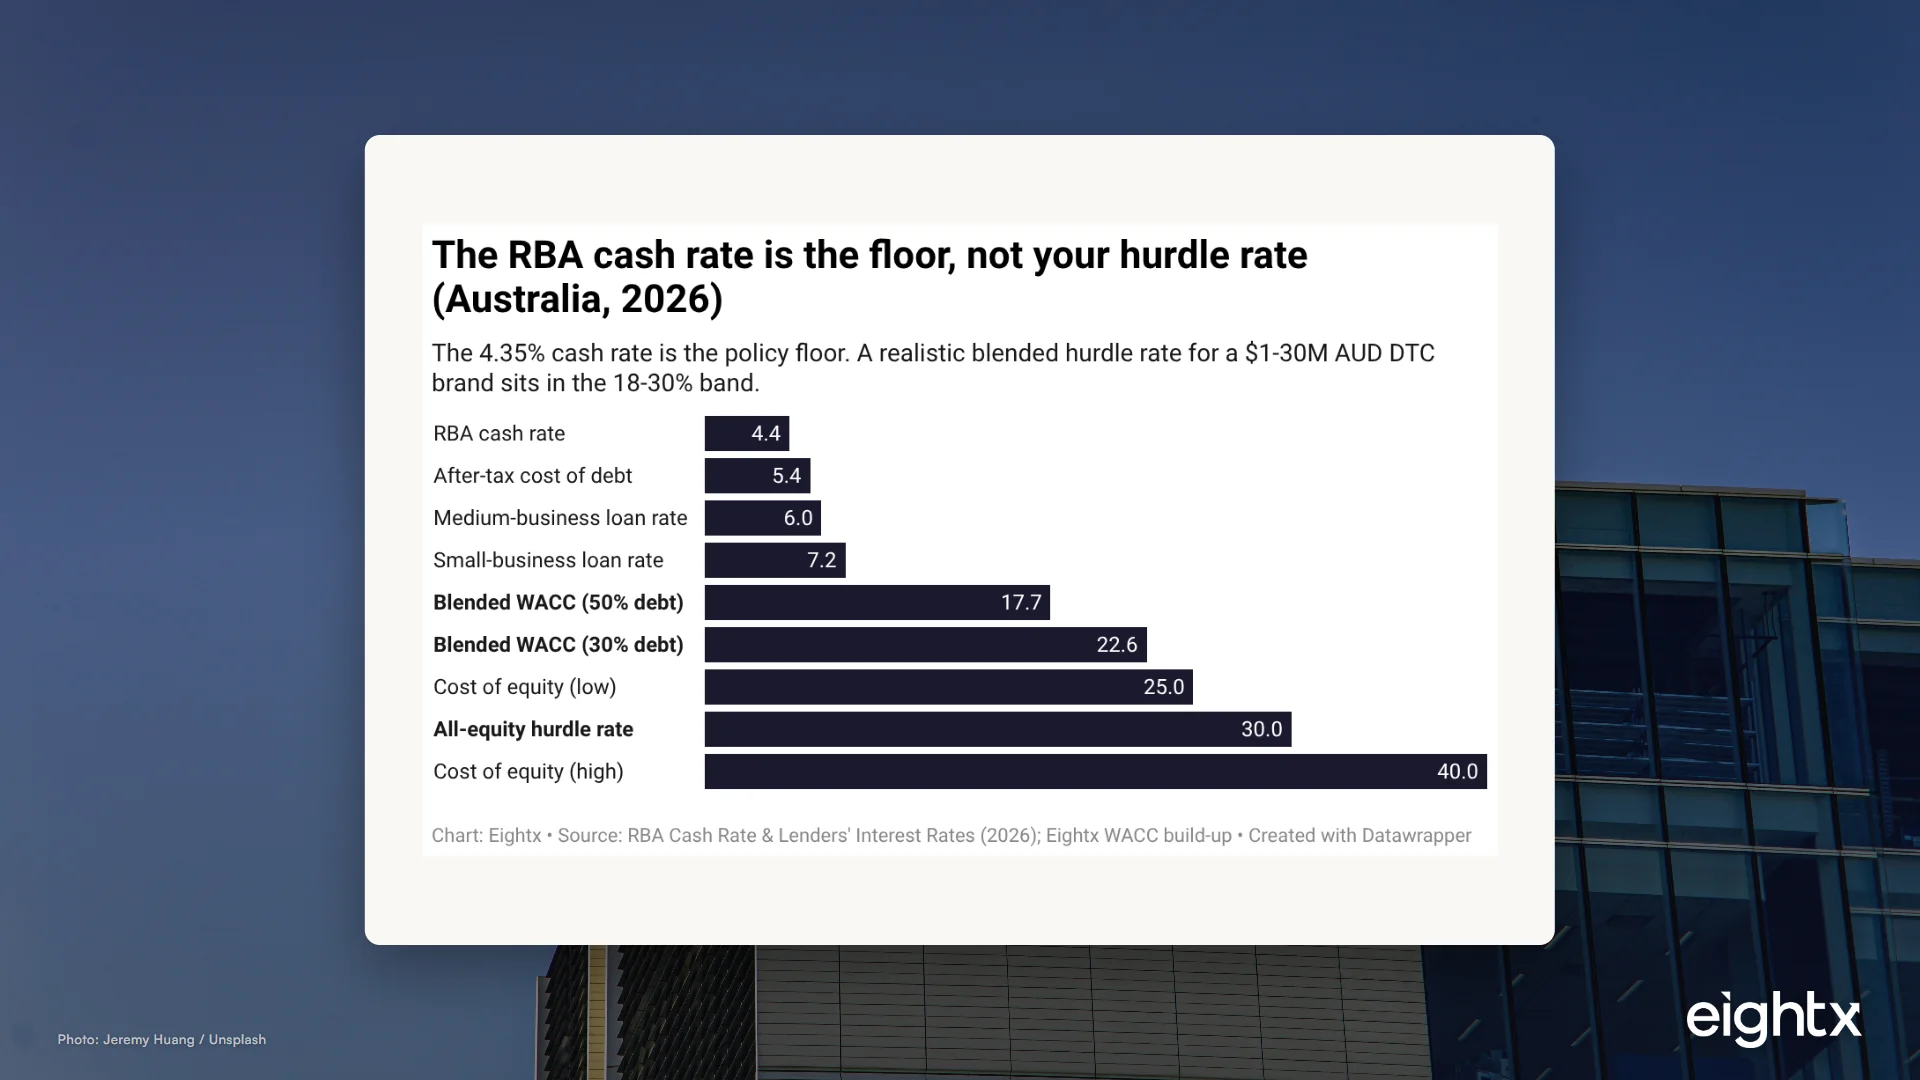
The RBA cash rate is 4.35%, but your DTC brand's real cost of capital is closer to 18-30%. How to build a hurdle rate for inventory and ad spend in Australia.
Australian 3PL benchmarks for 2026: pick-and-pack runs A$2-5 per order, storage A$20-45 per pallet, plus the ABS wage and price data driving rate rises.
US ceramic tableware imports hit $1.37B in 2024 with 74% from China. The HS 6911/6912 tariff stack, origin map, and what it does to your landed cost in 2026.
US candle imports (HS 3406) hit $1.16B in 2025. Vietnam supplied 53.7%, Canada surged to 21.4%, China shrank to 3.4%. The 2026 tariff map by origin, charted.
India passed China as the #1 source of US bed and bath linen (HS 6302) in 2025. Import value by country, tariff exposure by origin, and what it does to landed cost.
96.9% of US stroller imports (HS 8715) and 81% of car-seat-class seats come from China, but baby clothes already diversified. The 2026 tariff split, charted.
Canada Goose grew revenue 13% in FY2026 but operating income fell 46%. A line-by-line teardown of the 20-F: margin, SG&A, channel mix, inventory and cash.
Birkenstock runs a 59% gross margin on €2.1B FY2025 revenue, yet it's wholesale-led and getting more so. A CFO-grade read of the 20-F for ecom operators.
An operator-grade teardown of Allbirds' 10-K: revenue halved to $152.5M, gross margin fell to 41%, SG&A hit 70% of sales, and $291M of cash burned before the sale.
The ecommerce summer slump is shallow in the data. The real squeeze is cash: you pre-pay Q4 inventory across summer while sales dip. Here's the playbook.
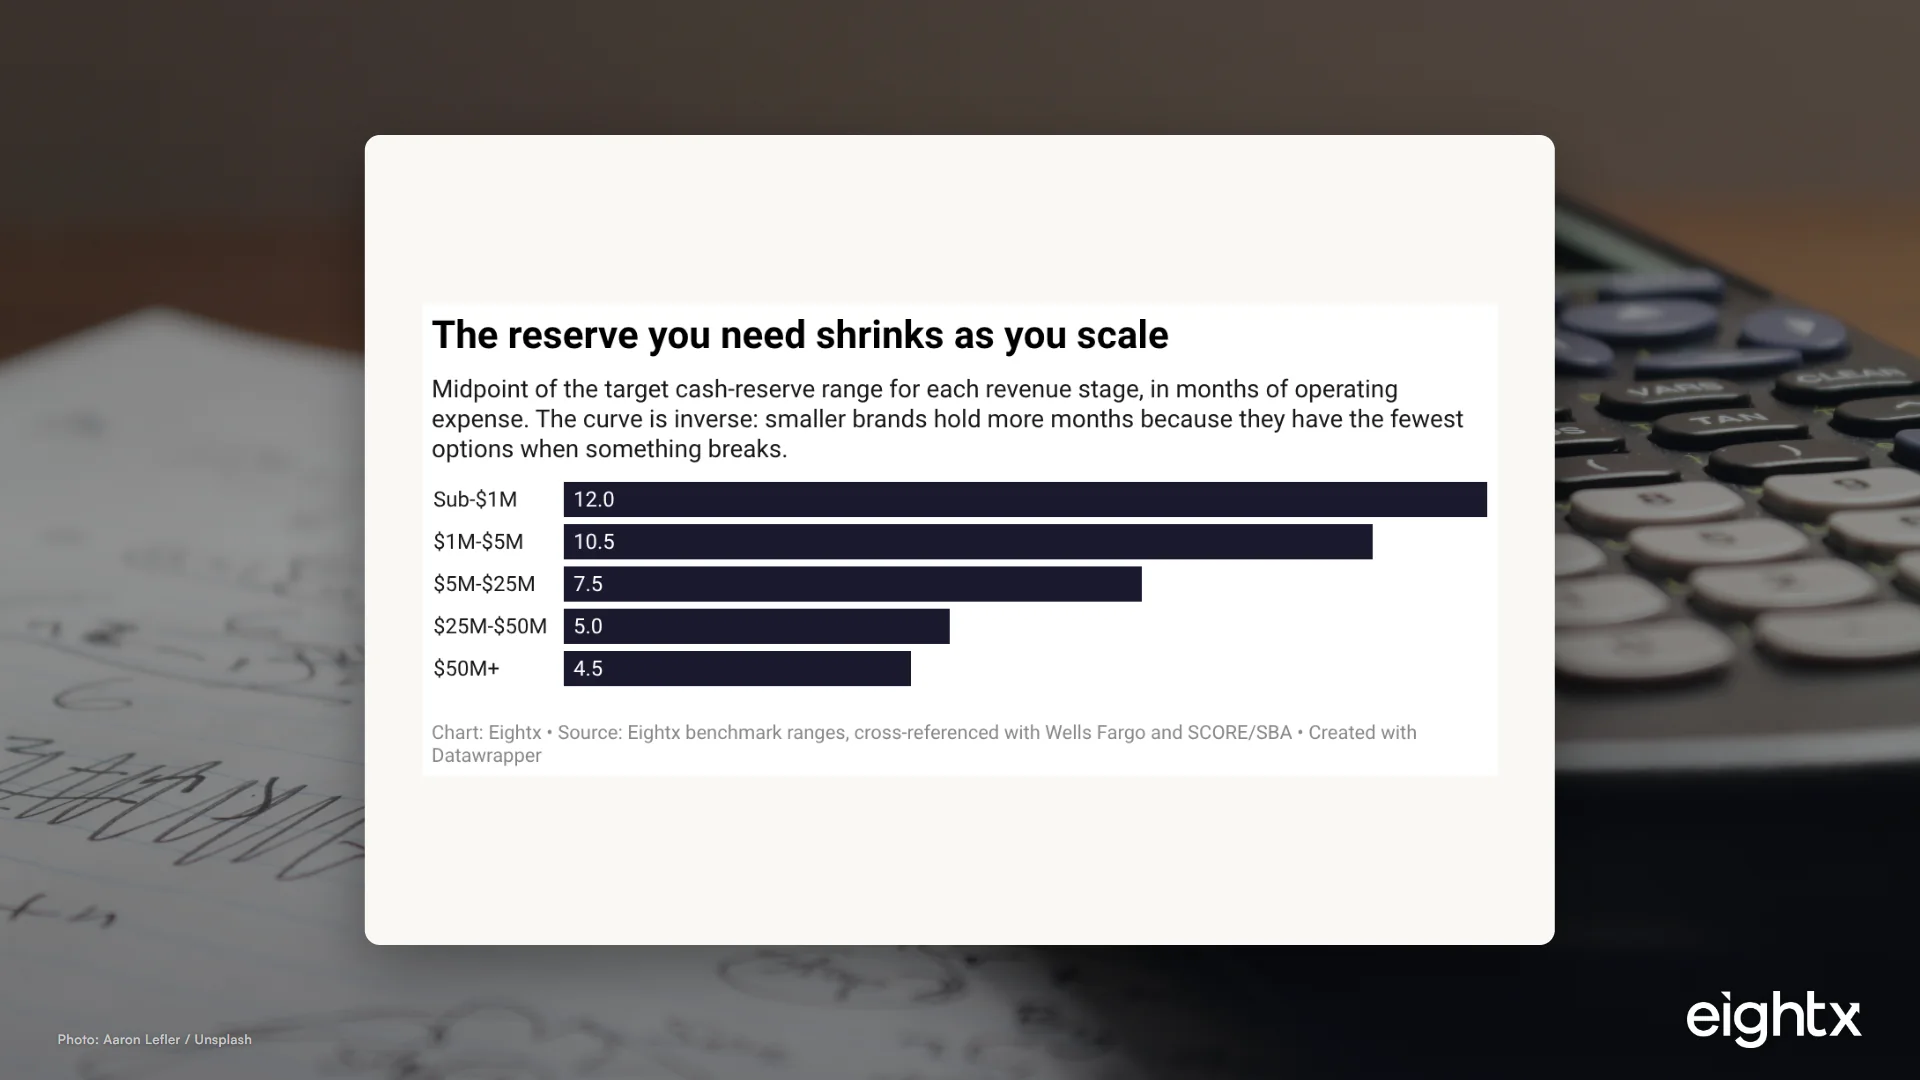
How much cash should an ecommerce business keep in the bank? Stop watching your balance. Set 7 guardrails against cash and the parts of the business that move it.
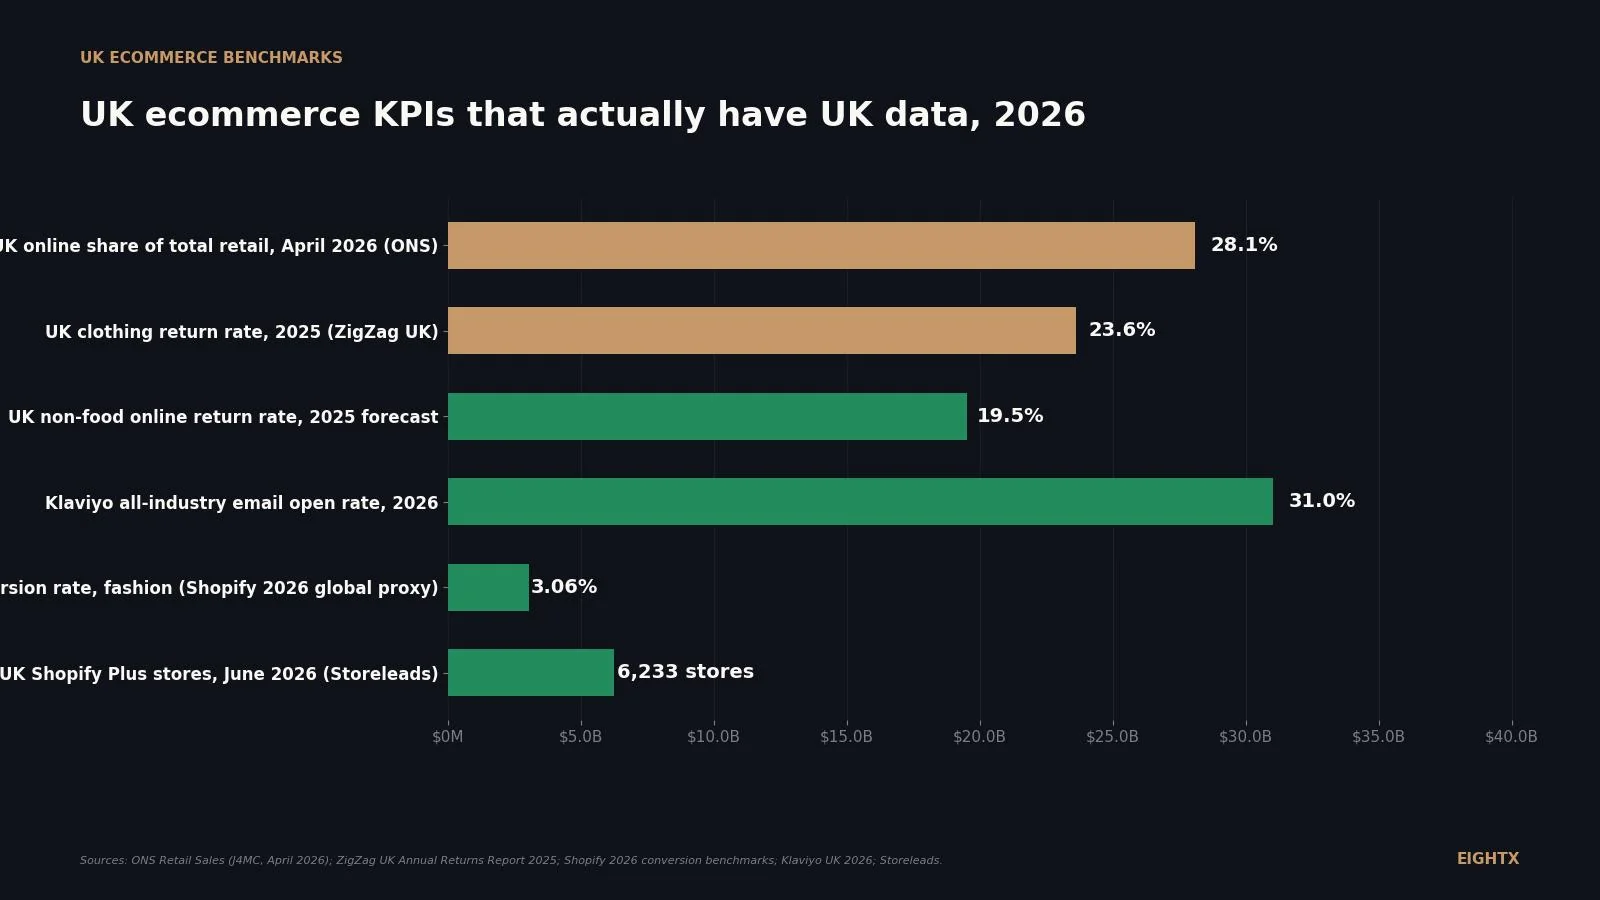
UK online returns sit near 19.5% in 2025 and clothing hits 23.6% (ONS + category data). What that costs a British DTC brand per parcel, and how to fix it.
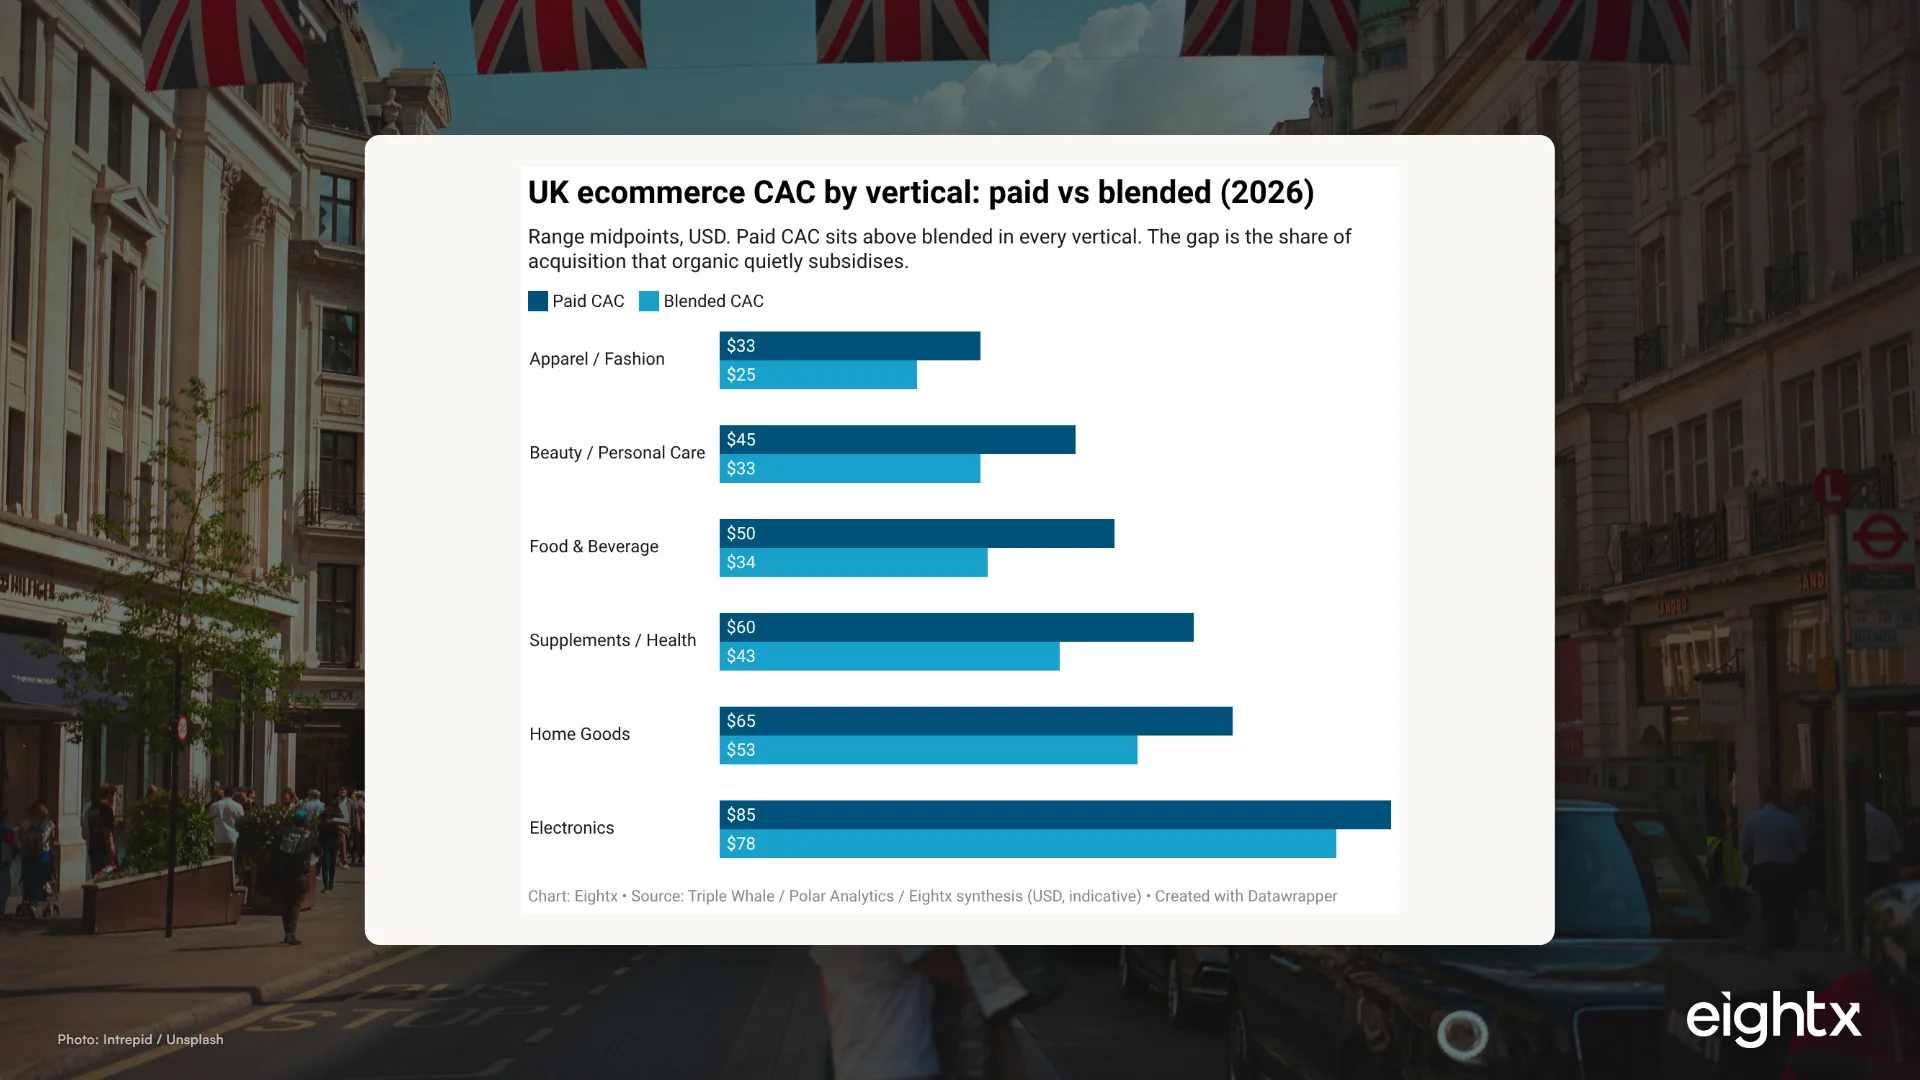
What it actually costs a UK DTC brand to buy a customer in 2026: CAC by vertical, payback, and LTV:CAC, built on ONS retail data plus the Storeleads GB cut.
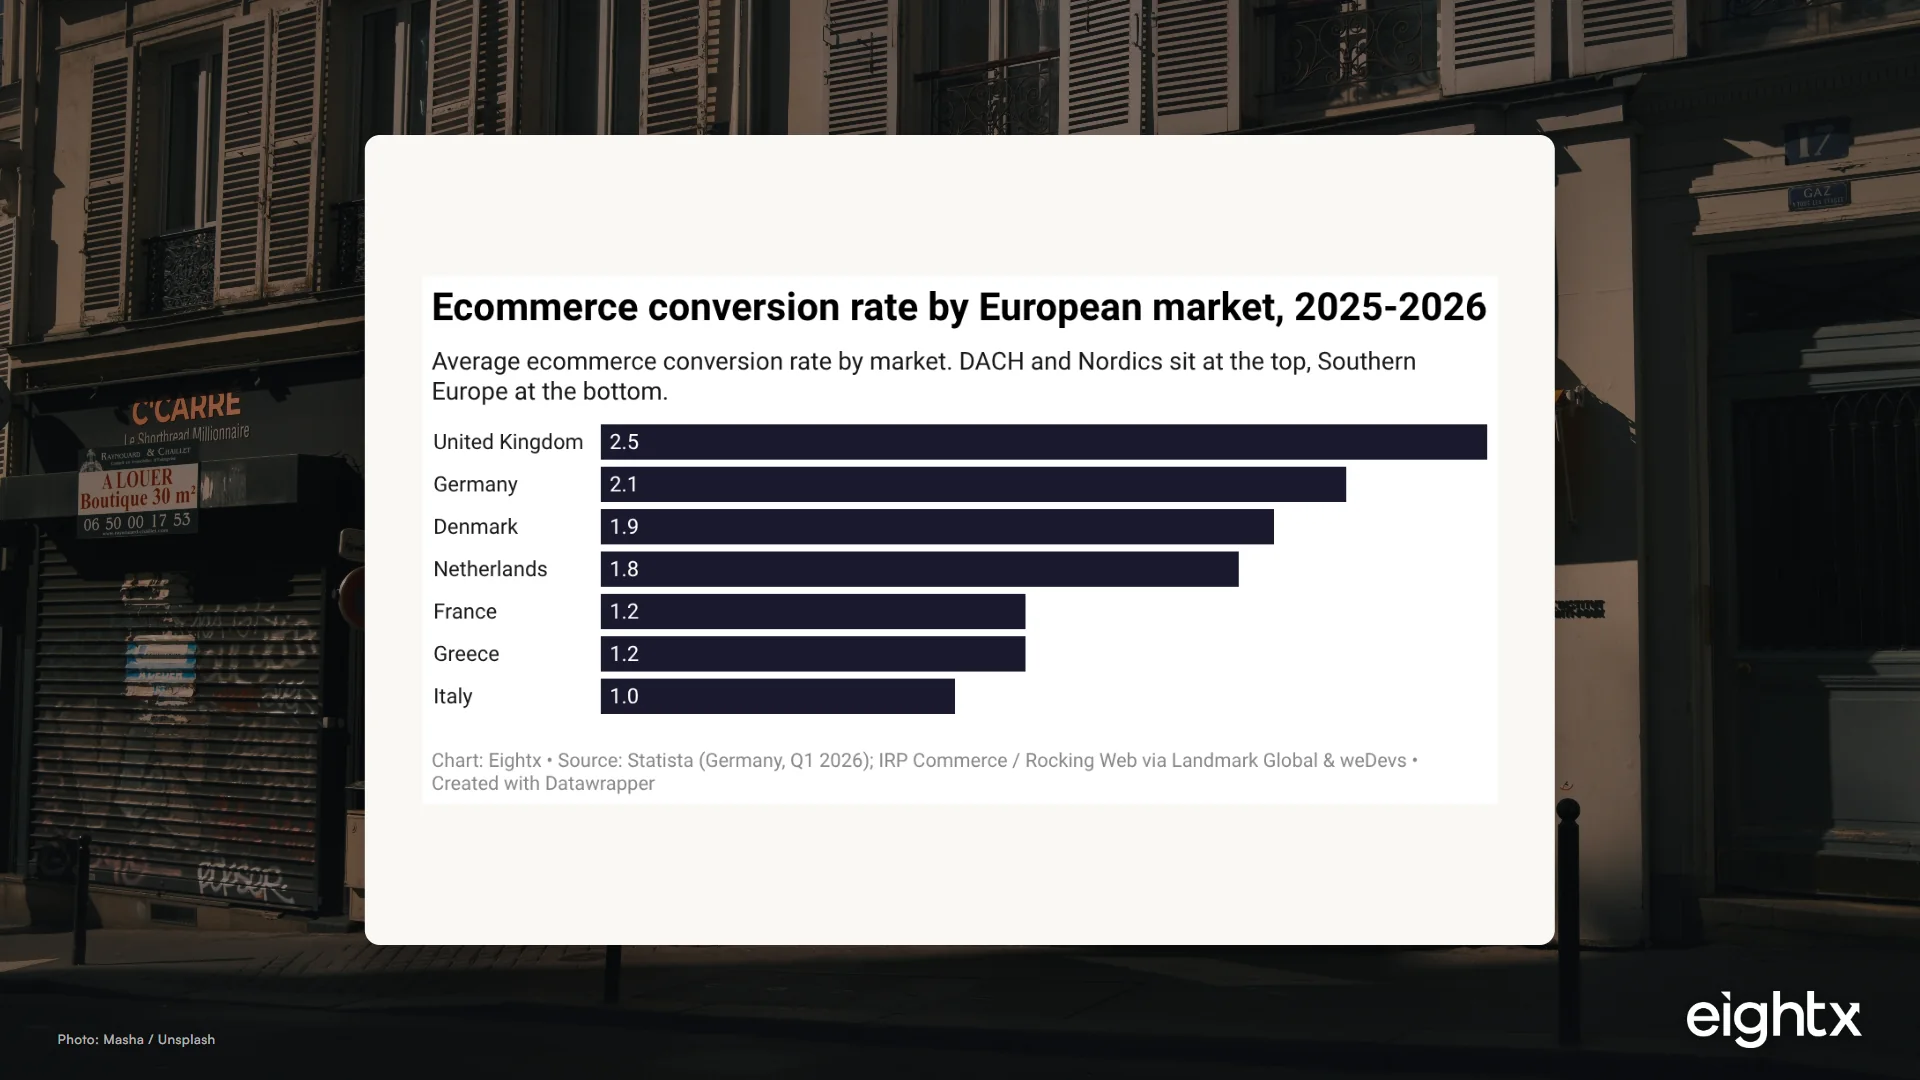
EU ecommerce benchmarks for 2026: conversion is 2.1% in Germany and 1.2% in France, returns hit 25% in apparel, and the DTC gross-margin floor by country.
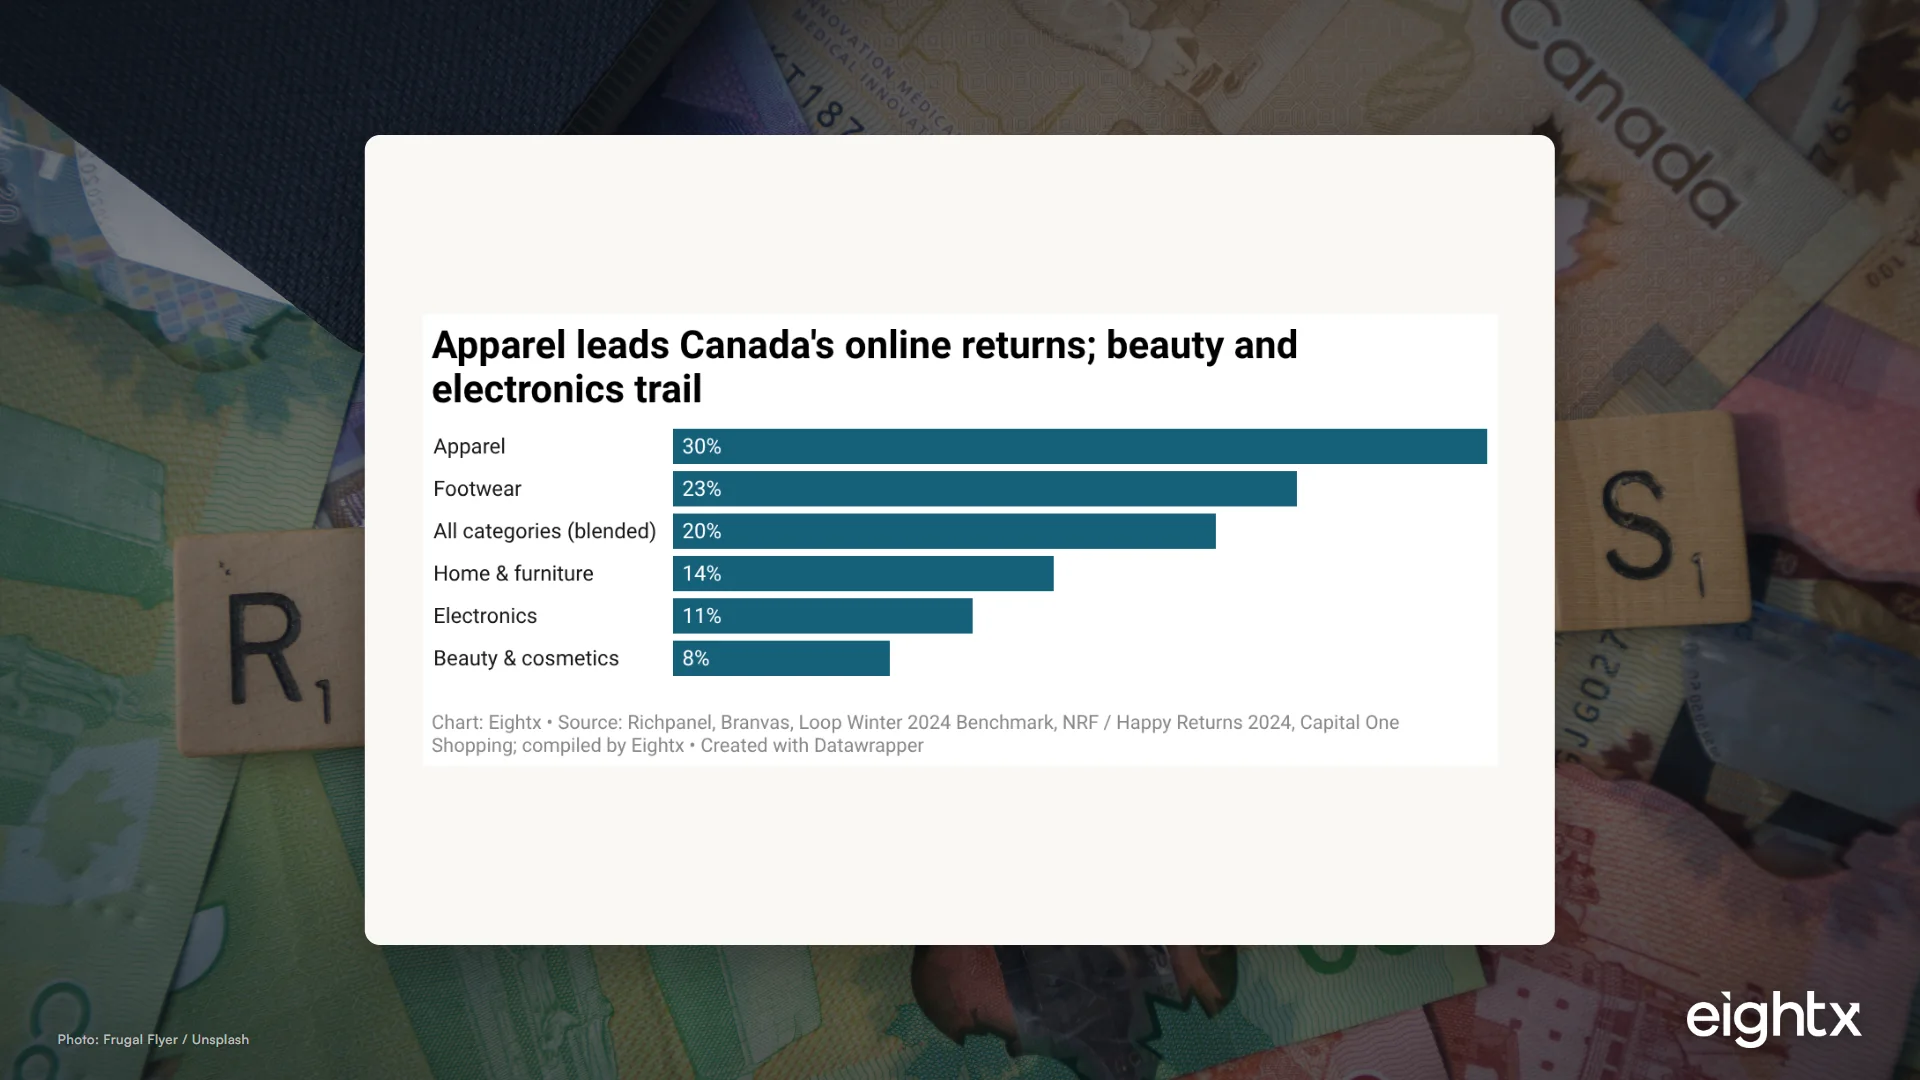
There is no StatCan return rate table for Canada. Here is the working per-order ecommerce return rate benchmark by category, and what each return costs your margin.
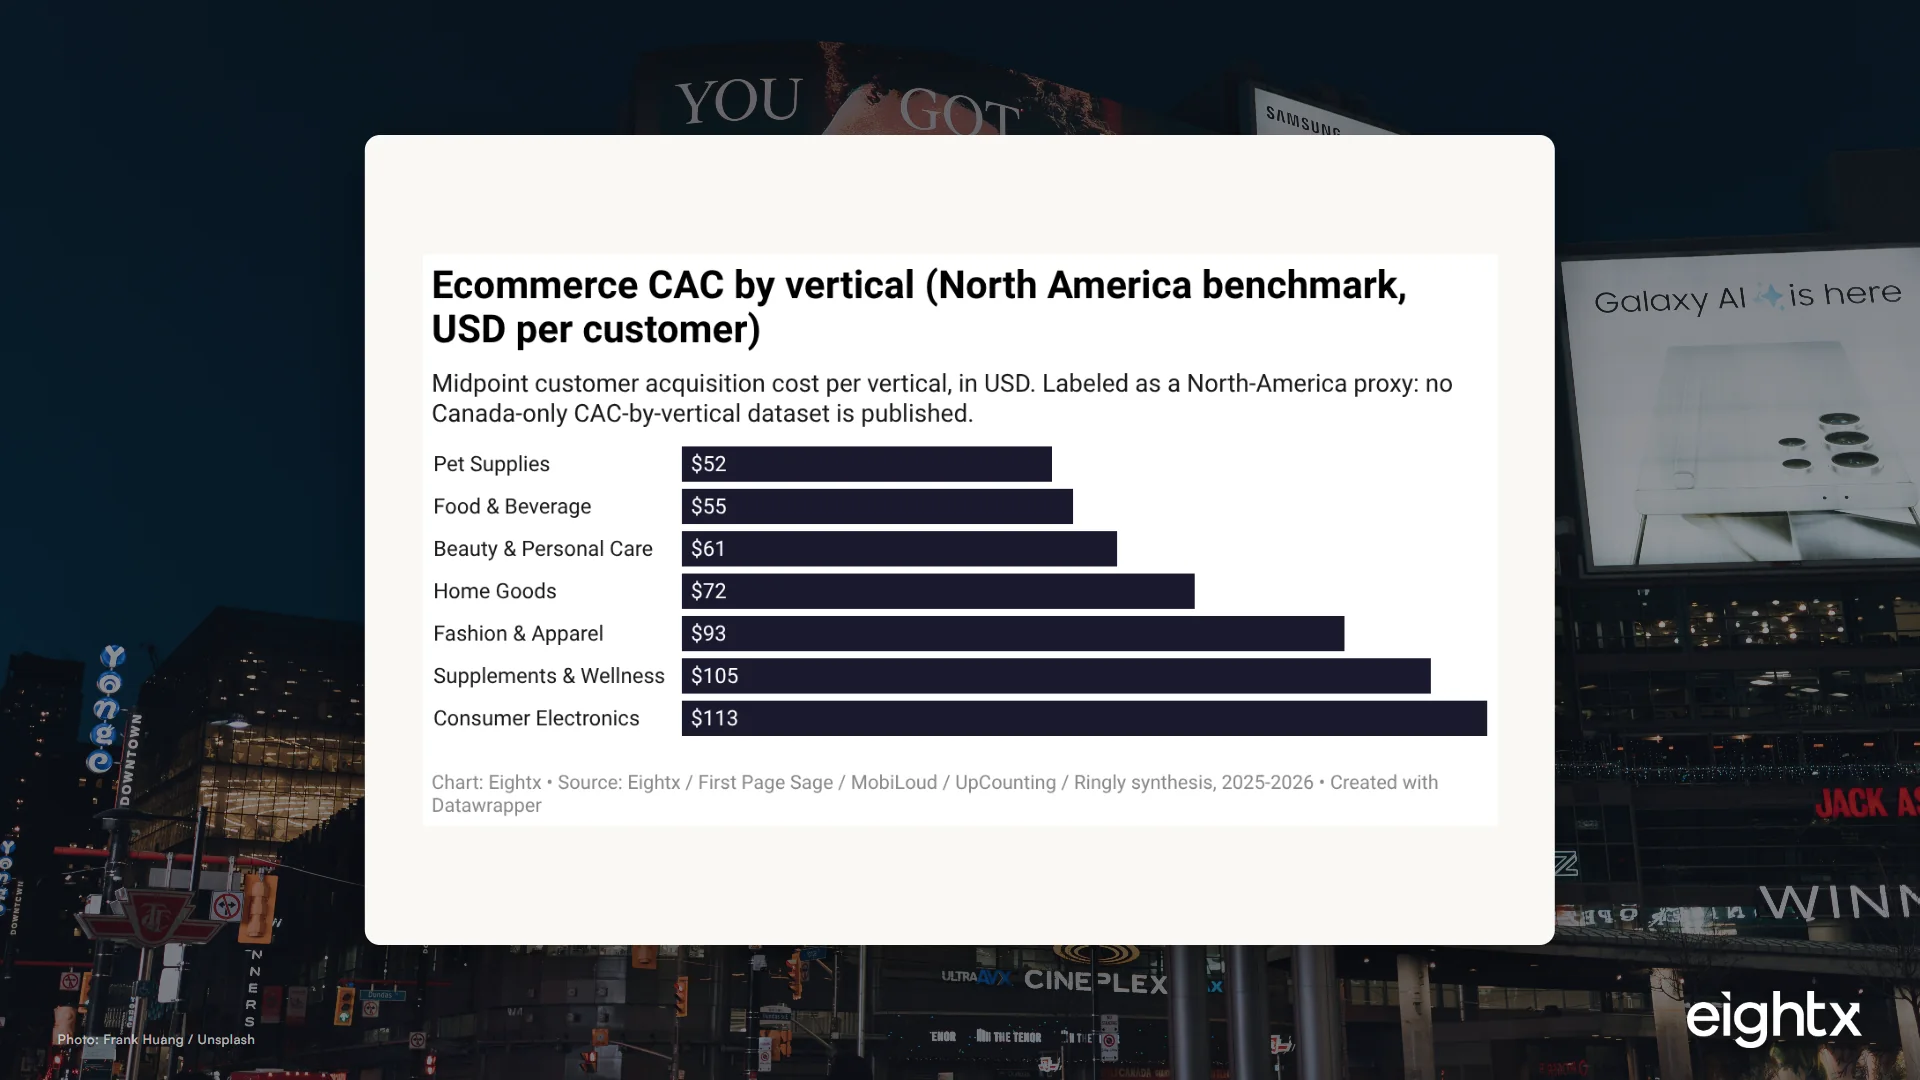
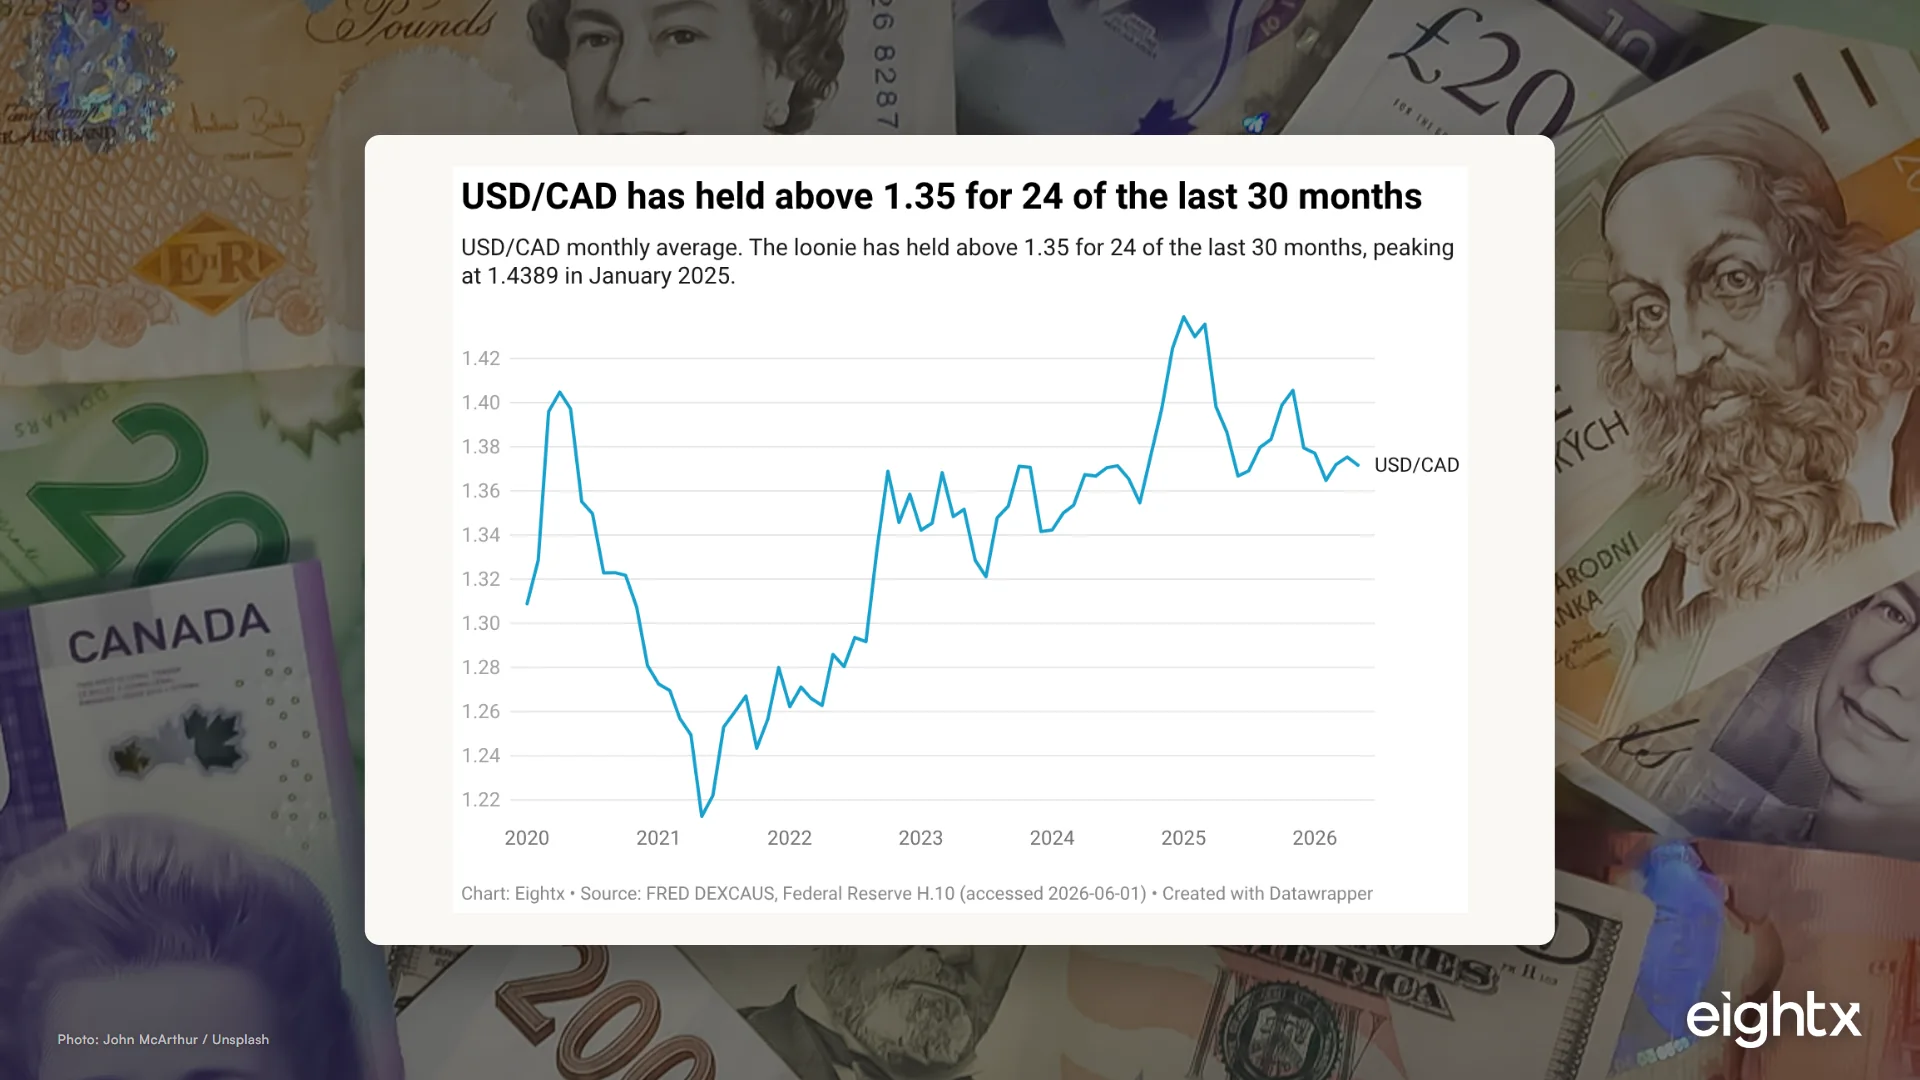
What a Canadian DTC brand actually pays to acquire a customer in 2026: CAC by vertical, the loonie's hidden FX tax on ad spend, and how to localize a US number.
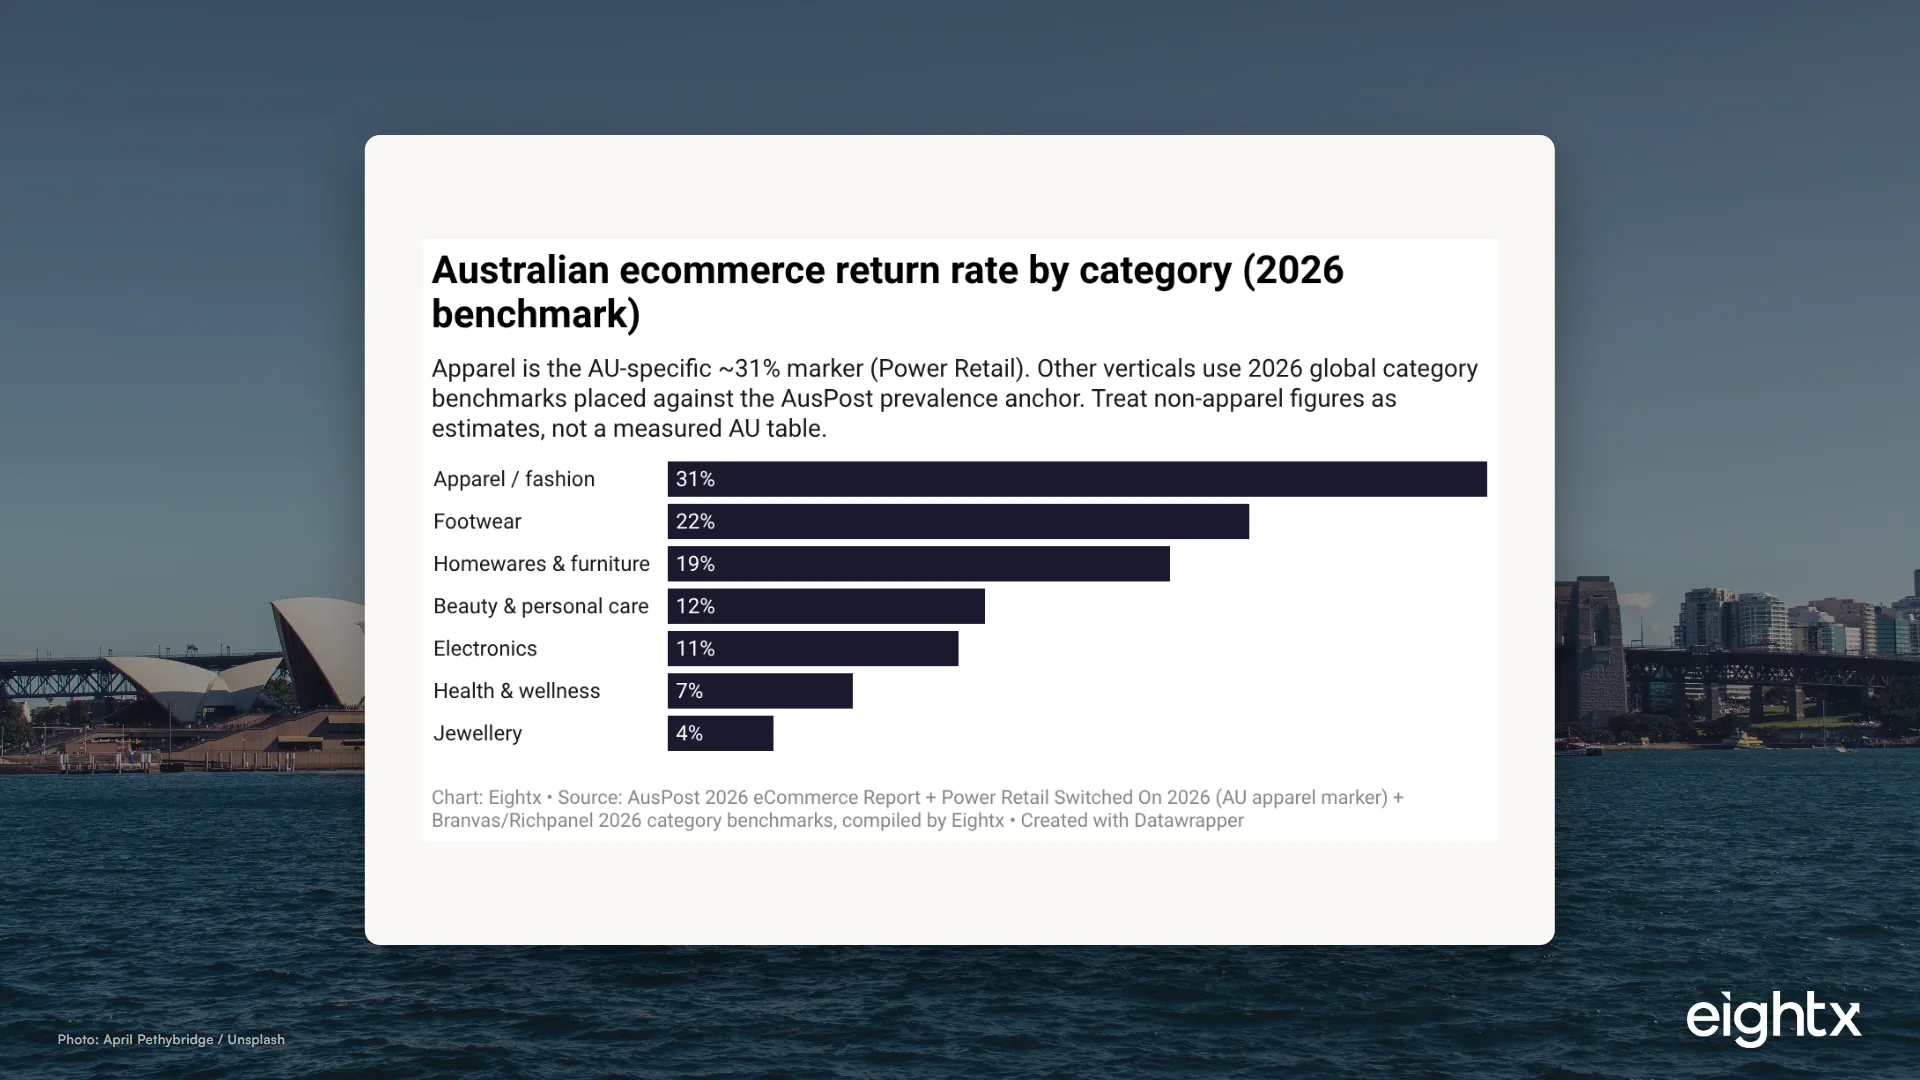
AusPost says 41% of Australian online shoppers returned an item in 2025. Here is the working per-order return rate benchmark by category and what it costs your margin.
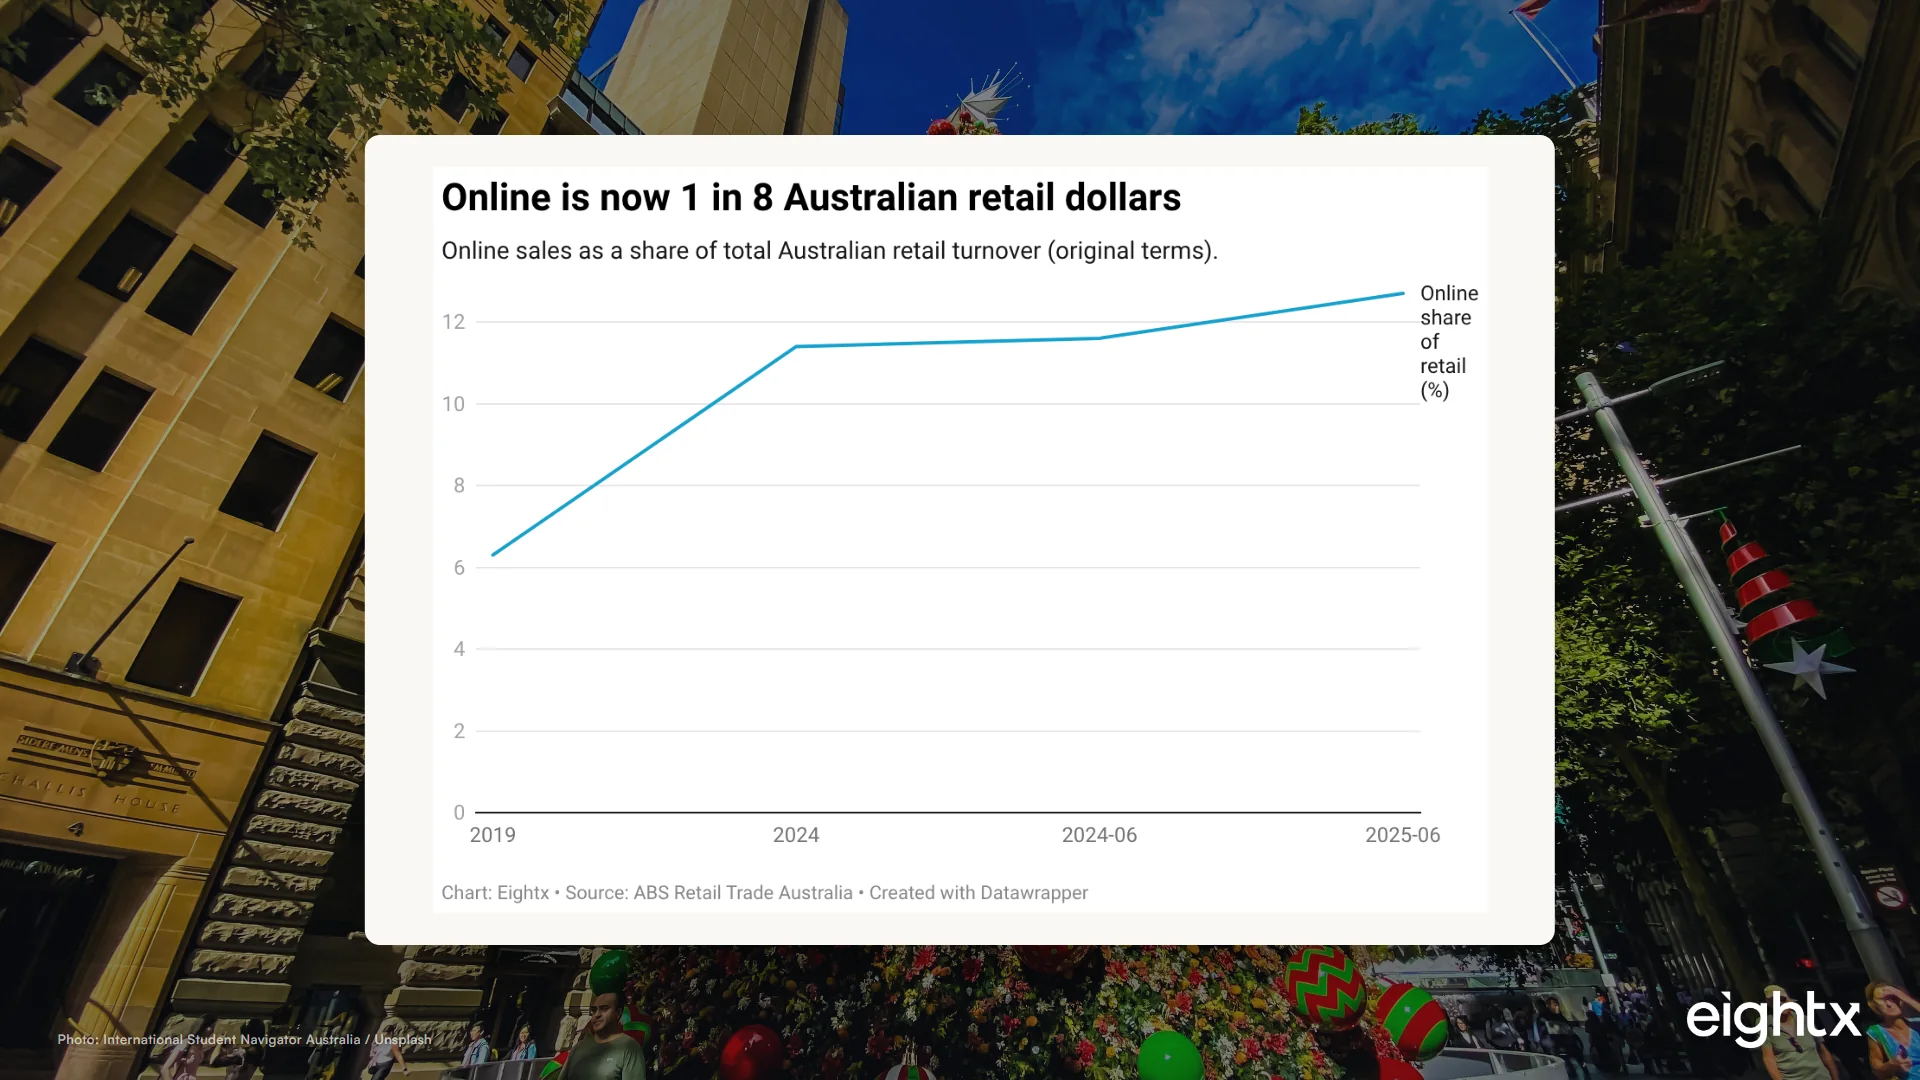
Online is now 12.7% of Australian retail (ABS, Jun 2025). The 2026 KPI scoreboard for AU DTC: conversion, AOV, gross margin, LTV:CAC, returns and cart abandonment.
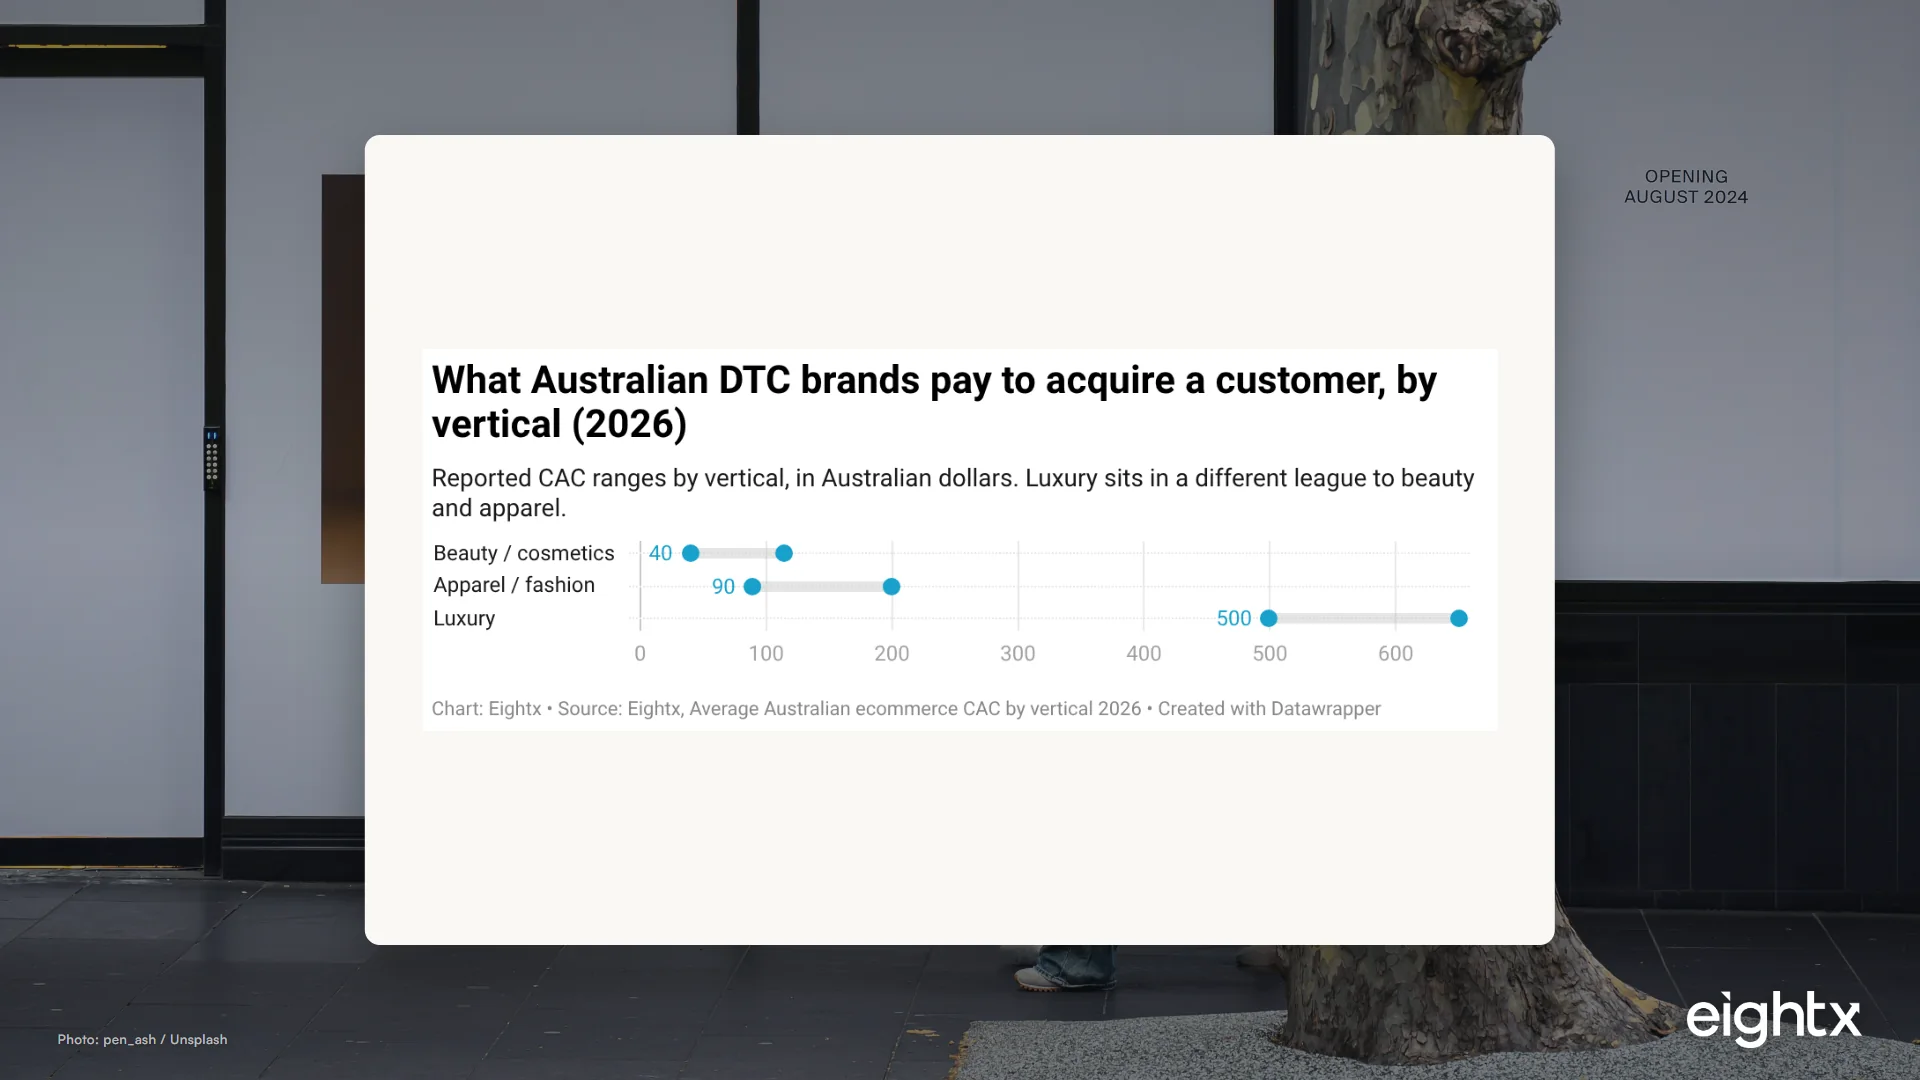
Australian DTC CAC runs 20% to 35% above the US even though Meta CPMs are cheaper here. The 2026 benchmark by vertical, charted, on ABS data.
Public supplements comps run 71-80% gross margin but only ~5% operating. The 2026 benchmark for CAC (~$89), LTV:CAC (3:1+), AOV, returns and inventory turns.
Public skincare comps post 69-74% gross margins but operating margins of -5.5% to +4.5%. The 2026 benchmark on margin, CAC, LTV, AOV, returns and inventory.
Public pet gross margins run 29.8% to 61.3% but operating margin sits near 2%. The 2026 margin, CAC, LTV and inventory benchmarks for pet brands.
Public jewelry comps say gross margin runs 39.5% to 57.5%, operating margin stays under 6%, and inventory eats 75 to 186 days of cash. The 2026 benchmark report.
Home goods gross margin runs 30-56% (median ~42%) but operating margin collapses to ~4%. The 2026 benchmark report from six public comps: CAC, AOV, returns, turns.
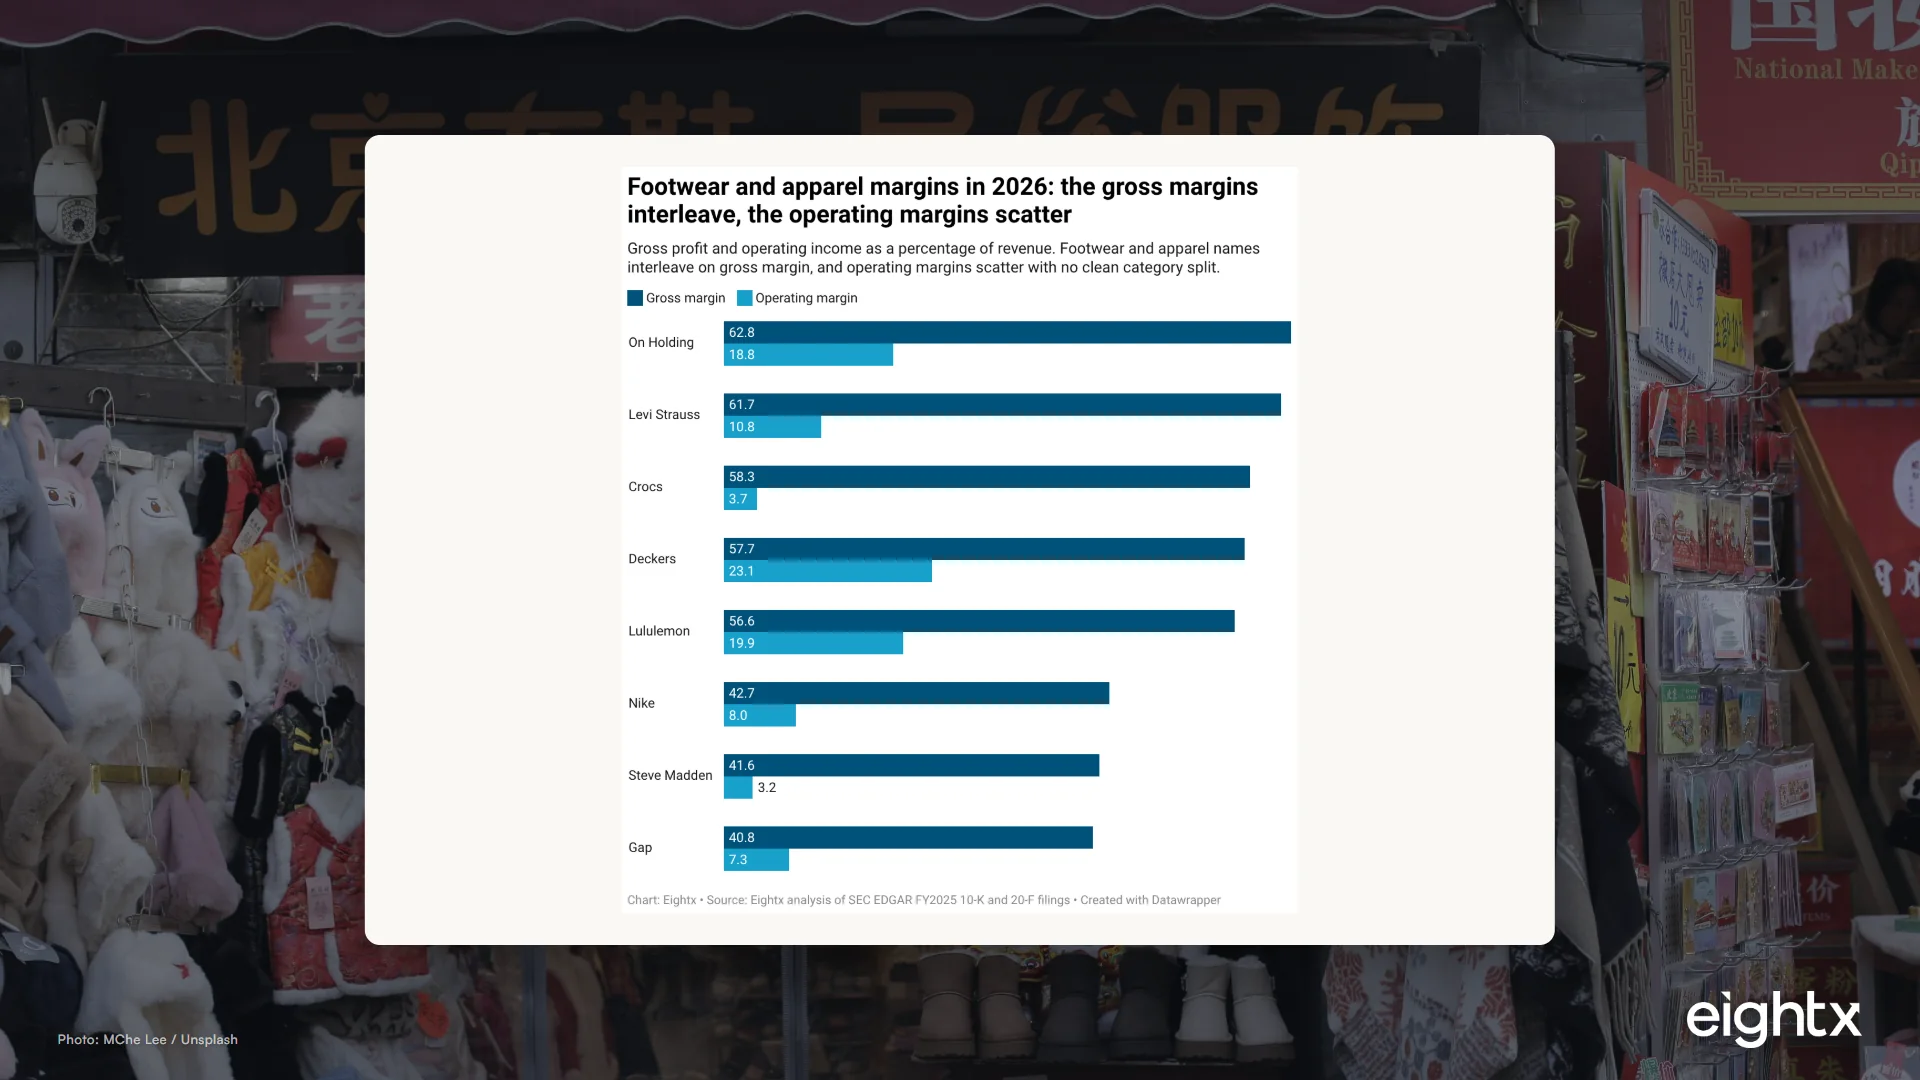
Footwear gross margins run 42-58% but operating margins collapse to a 3-23% spread. The 2026 benchmark on margins, returns, turns and CAC for shoe brands.
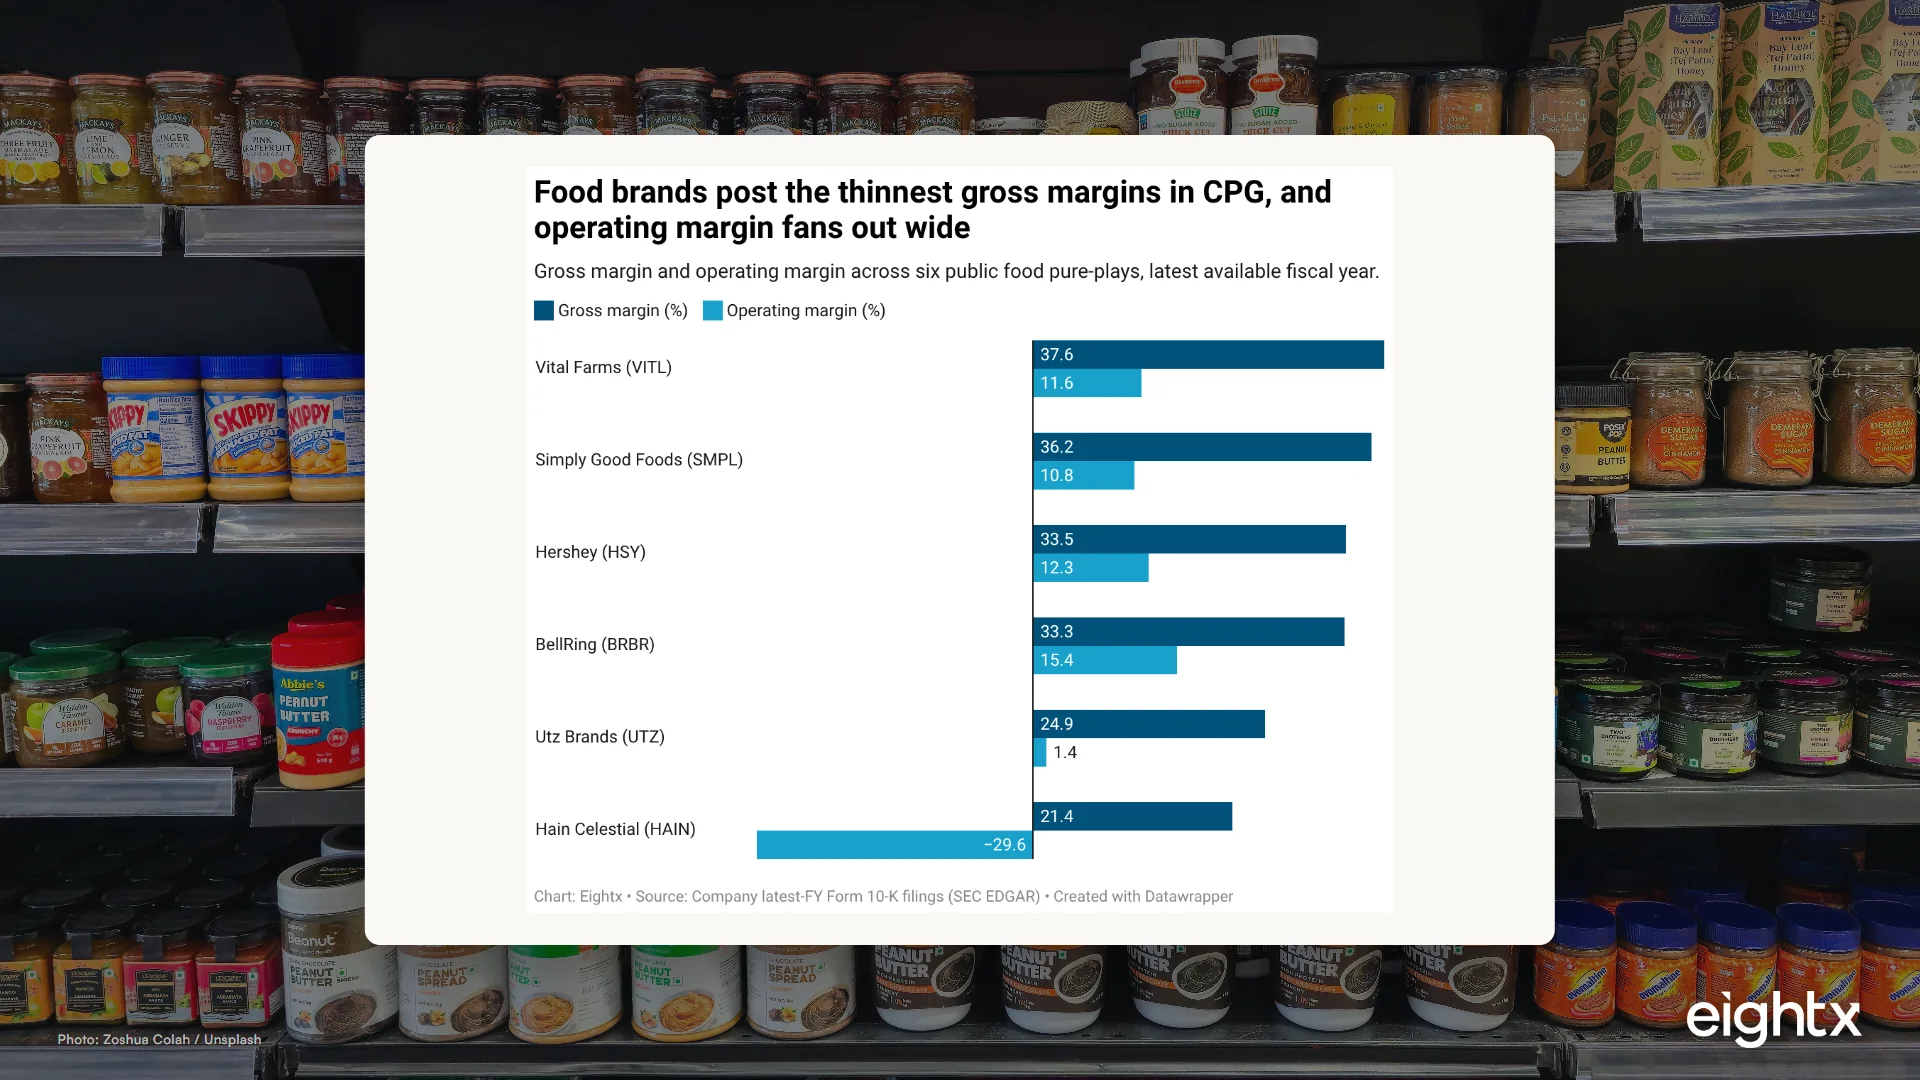
Public food brands run 21-38% gross margins (median 33%), the bottom of CPG. The 2026 food benchmark on margins, CAC, LTV, inventory turns and trade spend.
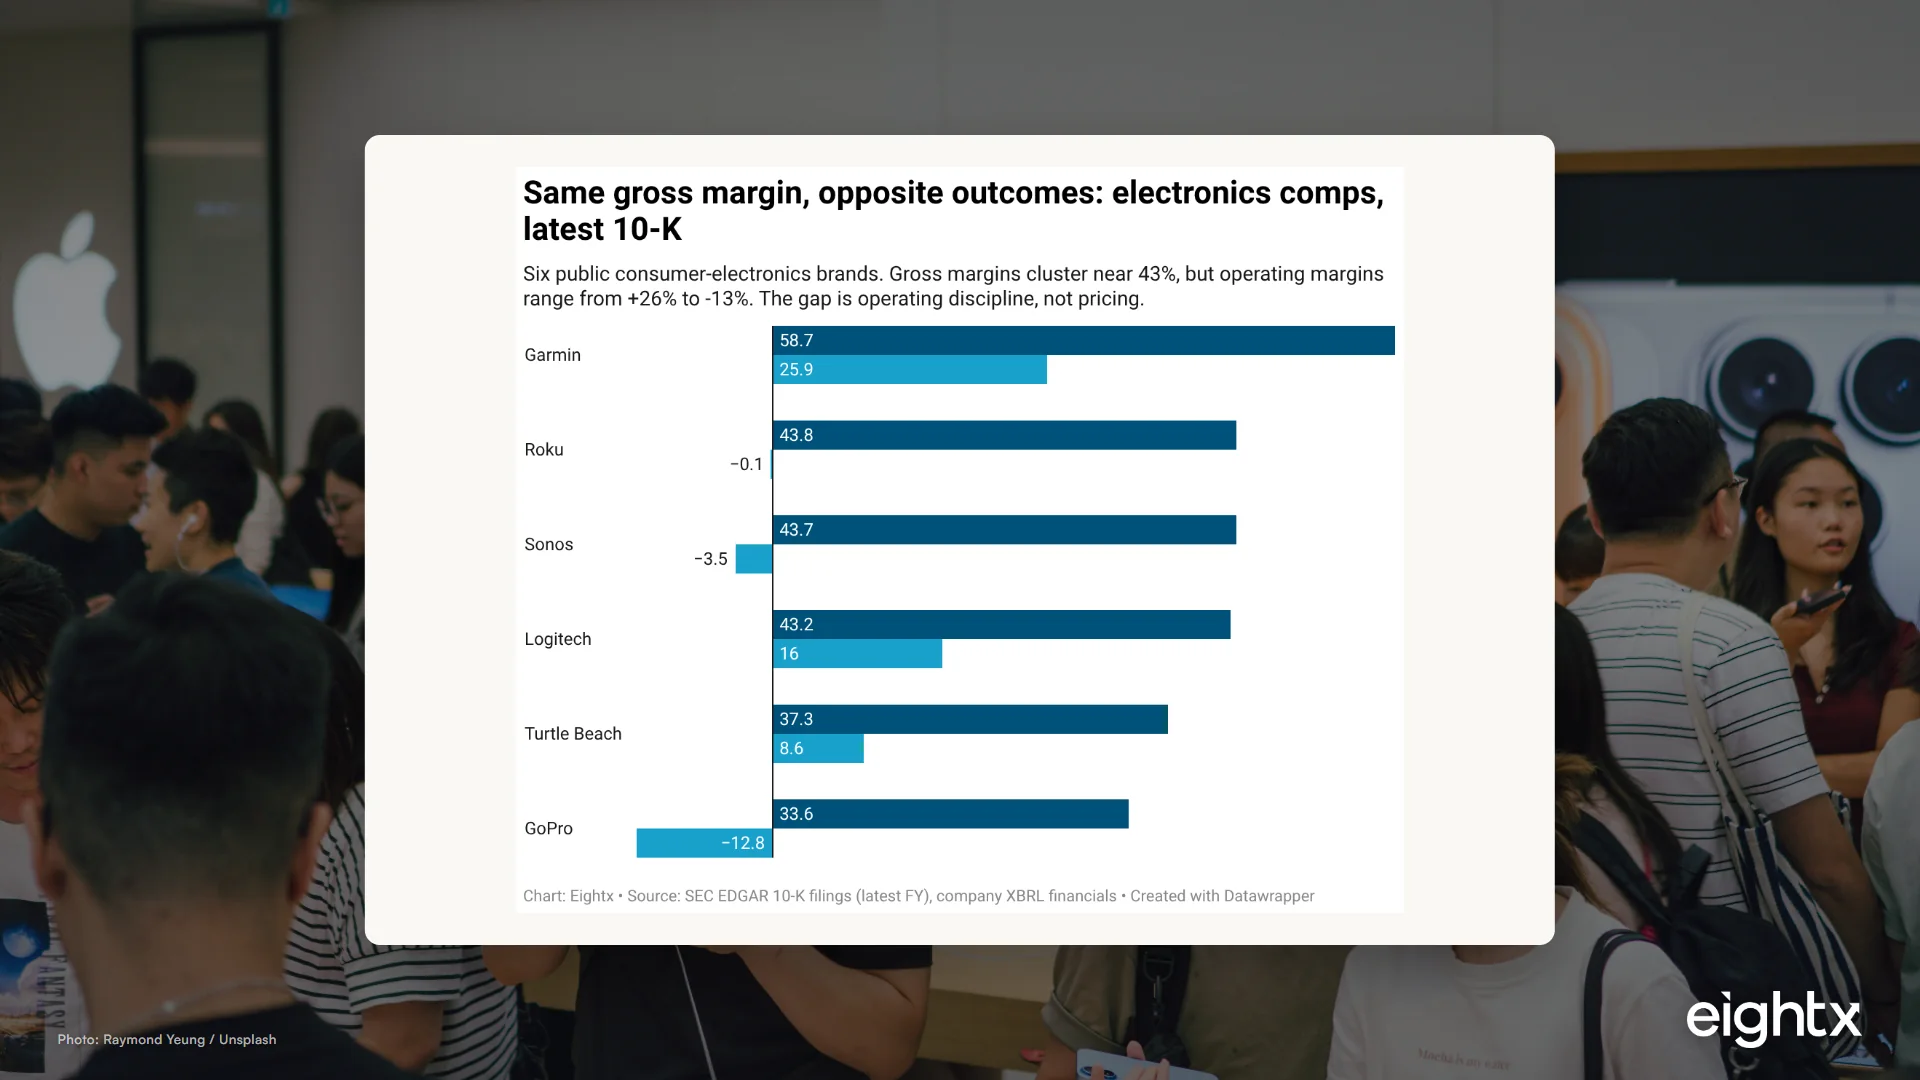
The 2026 financial benchmark for consumer electronics brands: 43% gross margin, $76 CAC, 10% return rate, 3.5x inventory turns. Six SEC comps plus 123,000 storefronts.
Public coffee comps report 16-35% gross margin, but a DTC coffee brand should model 45-55%. The 2026 benchmarks for margin, CAC, LTV, AOV and inventory.
Public beverage gross margin spans 36 to 62% but operating margin runs -7 to 29%, from 6 FY2025 10-K comps. The 2026 margin, CAC, LTV, AOV and inventory numbers.
Median beauty gross margin is gorgeous at ~69% but operating margin just 4.1%, from 7 public 10-K comps. The 2026 margin, CAC, LTV, AOV, returns and inventory numbers.
Median apparel gross margin is 55.3% but operating margin just 6.7%, from 8 public 10-K comps. The 2026 margin, CAC, LTV, AOV, returns and inventory numbers.
How bundle pricing lifts AOV without eroding margin: pure, mixed, BOGO and build-a-box types, the discount-depth vs attach-rate tradeoff, and a worked margin example.
The six levers that move a DTC brand from a floor multiple to a premium one, with the EBITDA turns each one earns and a 12 to 24 month action plan.
How SAFEs and convertible notes work for DTC founders: caps, discounts, post-money vs pre-money, interest and maturity, and the dilution they create at conversion.
A temporary cash gap appears. Do you take bridge debt or raise equity? A CFO compares cost of capital, dilution, speed, and risk with a worked example.
How DTC and ecommerce brands actually get valued: SDE multiples for small brands, EBITDA multiples as you scale, revenue multiples for high growth, plus 2026 ranges.
The dashboard a DTC brand must show investors in 2026: contribution margin, CAC payback, LTV:CAC, retention, gross margin, growth, and burn multiple, with each bar to clear.
How much to raise for an ecommerce brand: size the round from your next milestone plus 18 to 24 months of runway, run the dilution math, and avoid raising too much.
How to run inventory across DTC, Amazon FBA, wholesale, and retail without stranding stock in one channel while another stocks out. A CFO allocation framework.
Benchmark your inventory days against your DTC vertical, calculate yours with the DIO formula, then pull the levers that free cash. Each day cut is real money.
Calculate your ideal inventory investment from turnover, lead time, service level, and growth. The formula, a worked example, and how to spot over- or under-investment.
When you must take an inventory write-down under lower of cost or net realizable value, the P&L and tax impact, and how to avoid a surprise year-end hit.
How to clear dead stock without torching margin: identify it, weigh carrying cost against liquidation, and work a clearance ladder from bundle to broker to write-off.
A cross-vertical playbook for managing seasonal ecommerce cash flow: see the demand curve, name your trough, fund the inventory build, and clean down each cycle.
Build a rolling 13-week direct cash flow forecast for your DTC brand: the line items, the weekly roll, and the inventory-days benchmarks that explain why the trough exists.
What triggers a state sales tax audit, what auditors request, and how a VDA caps back-tax exposure. An operator survival guide for DTC and ecommerce brands.
Finaloop ($245-995/mo) vs Pilot ($499-2,799/mo) vs Bench ($199-599/mo) in 2026. Native Shopify/Amazon/TikTok reconciliation, accrual basis, and the Bench shutdown risk.
The DTC squeeze is paying for inventory AND the ads to sell it before cash returns. How to size the combined need, sequence spend, and match financing to each side.
The complete guide to funding an ecommerce brand: bootstrapping, equity, debt, revenue-based financing, inventory finance, and grants, and when each fits by stage.
Most DTC cash is trapped in inventory and receivables. Use the cash conversion cycle (DIO + DSO - DPO) to find it, then free it by turning stock and extending terms.
A product launch is a cash bet: deposit, production and freight leave months before revenue. Build a driver-based launch cash forecast and stress-test the downside.
Where US furniture imports came from in 2025 by origin, the China collapse, the 2026 tariff stack and the ocean freight index: the numbers that set your landed cost.
How to build a DTC fundraising financial model investors trust: a driver-based three-statement model, unit economics, cohort retention, use of funds, and scenarios.
Footwear vs apparel margins compared with FY2025 filings: gross margins nearly tie, but tooling, returns, and size-curve markdowns split the contribution margin.
2025 US Census data on footwear import origins (HS 64) plus the 2026 duty stack by country, so a shoe brand can see its real landed-cost exposure by origin.
Fix or kill a money-losing product line: measure contribution margin per SKU, then reprice, re-source, cut shipping and returns, bundle, or discontinue. The full playbook.
Amazon collects and remits sales tax on your FBA orders under marketplace facilitator laws in all 45 states, but you may still owe registration, filings and income tax.
Equity vs debt vs revenue-based financing for ecommerce in 2026: a decision matrix on true cost of capital, dilution, control, repayment risk, and use-case fit.
Electronics is the largest US import category at $496.8B. A 2025 Census origin map for HS 85 and the 2026 China and tariff exposure for accessories brands.
The 2026 economic nexus threshold reference for DTC brands: every state's dollar and transaction test, the states that dropped the 200-tx rule, and how to monitor it.
Exactly what goes in a DTC brand's deal data room: financials, tax, legal, IP, contracts, cohort data, ops, and HR. A build-the-data-room checklist for a fast sale.
When the S-corp election actually pays for an ecommerce owner: how the reasonable-salary-plus-distribution split cuts self-employment tax, with a worked example at four profit levels.
How much cash reserve a DTC brand should hold, in months of operating expense and as a multiple of the seasonal swing, by revenue stage and risk profile.
A 30-day cash crunch plan for DTC brands: pull the survival levers in priority order, from cutting ad spend and stretching payables to AR collection and emergency financing.
SDE vs EBITDA for ecommerce valuation: small owner-run brands are priced on SDE, larger ones on EBITDA, and the crossover sits near $1M to $2M of earnings.
The step-by-step for registering for sales tax once you have nexus: permits, the Streamlined Sales Tax shortcut, filing frequency, and DIY vs automation vs outsourced costs.
Most ecommerce and CPG brands miss the federal R&D tax credit. What qualifies under Section 41, how 2025 Section 174 expensing restoration interacts, and how to claim it.
What a buyer's Quality of Earnings analysis digs into: revenue recognition, true gross margin, add-back legitimacy, customer concentration and working capital, and how to pre-empt it.
The behavioral pricing levers that move DTC conversion: charm pricing, decoy anchoring, and per-day framing, with the margin math and how to use each one well.
How payout lag and rolling reserves at Shopify Payments, Stripe, and PayPal quietly hold your cash, and how to model the money you cannot touch yet as you scale.
How to price for wholesale vs DTC: set MSRP, a keystone wholesale margin, and a MAP policy so your wholesale price still earns positive contribution and DTC holds.
How to split a seasonal inventory buy between an up-front pre-season commitment and held-back open-to-buy for reorders, with the OTB formula and the profit math.
How to get your ecommerce books due-diligence ready 6 to 12 months before a sale: accrual accounting, a clean monthly close, documented add-backs, and cohort reporting.
The non-dilutive capital toolkit for CPG and DTC brands: supplier terms, R&D credits, grants, SBA loans, inventory lines, PO financing, and RBF, with 2026 costs and stacking.
How to negotiate a term sheet beyond valuation: liquidation preference, the option pool shuffle, board seats, pro-rata, anti-dilution and vesting, and where to push.
Spoilage is a margin tax on food and beverage brands. Quantify spoilage as a percent of COGS and see how shelf life and retailer date codes cap your safe inventory buy.
Trade spend is a CPG brand's second-biggest cost after COGS, often 15 to 25% of gross sales. How to book it as contra-revenue and protect margin.
Slotting fees by retailer and category, what a retail launch really costs per SKU per store, and how to model the breakeven velocity to earn the slot back.
What is left of a CPG brand's margin after distributor margin, retailer margin, and trade spend? We walk the price build from factory cost to grocery shelf.
How co-man economics work for food and beverage brands: per-unit run cost, setup and changeover fees, ingredient and packaging MOQs, plus an MOQ-to-cash framework.
A side-by-side contribution margin map of the three CPG channels: DTC, retail, and Amazon. See which one actually makes money at your stage and why.
Who is buying food, beverage and CPG brands in 2026 and at what revenue multiple. Real deals from PepsiCo, Celsius and Carlsberg, plus what drives a premium.
Beverage brand unit economics, broken down per can. Why low price, heavy freight, and trade spend make drinks the toughest CPG margin to scale profitably.
After the 2026 court rulings, China apparel duty is closer to 24% than 60%. How to rebuild your landed-cost model on what survives in law and chase tariff refunds.
How apparel brands set the size curve from sell-through data, why a sold-out SKU with broken sizes still loses money, and how leftover odd sizes drive markdown drag.
Apparel seasonal cash flow planning: why SS and FW buys drain cash months before sell-through, where the summer trough sits, and a month-by-month two-season cash plan.
Apparel has the highest ecommerce return rate, around 25 percent. Here is the fully loaded cost of an apparel return in 2026, with a per order example and the fixes.
How pre-order and made-to-order flip the apparel cash cycle: customer cash arrives before production, cutting working capital and markdown risk. Plus the tradeoffs.
The financial case for the apparel drop model: scarcity drives full-price sell-through and cuts markdown, but caps volume. Drop vs evergreen economics on margin and cash.
The margin math of a DTC price increase: how much volume you can lose and still win, how to test it by segment, and how to time and communicate the rise.
How to set a free shipping minimum that lifts AOV without eating margin. The math behind the threshold, the real cost of absorbing shipping, and a worked example.
When and how to use dynamic and tiered pricing in DTC: the margin upside from McKinsey, FTC, and Consumer Reports data, the trust risks, and the guardrails you need.
A 20% off promo at 60% gross margin needs 50% more units just to break even. Here is the breakeven math, when promos are worth it, and how to run disciplined ones.
A practical DTC demand-forecasting method that avoids the cash-killing over-buy: blend base velocity, seasonality, promo lift, and lead time, then size to a turn target.
Wholesale net-30/60/90 terms mean you produce, ship, then wait months to get paid. Here is the DSO cash drag, factoring and PO financing costs, and how to price it in.
Markdowns are the biggest controllable margin leak in apparel. The 2026 playbook: shallow early cuts on sell-through triggers, the margin ladder, and the cash math.
What apparel and footwear brands sell for in 2026: real EV/revenue and EBITDA multiples, who is buying, and what drives a premium. Sourced recent deals plus live public comps.
The $800 de minimis exemption is gone. What the end of Section 321 does to cross-border DTC margins, which fulfillment models break, and how to respond in 2026.
How CPG broker commissions (3-7%) and distributor margins plus UNFI/KeHE fees, MCBs and freight allowances stack on one SKU, and how to model distributor vs direct.
China's share of US imports by DTC category in 2026: toys 65.9%, footwear 26.1%, furniture 20.6%. See which categories break if China tariffs spike.
China is ceding US apparel import share to Vietnam, Bangladesh, India and Cambodia. 2025 Census data on the sourcing shift and what it means for your duty mix.
Air freight costs about 18x more per kg than sea but lands 27 days sooner. The 2026 decision rule for when to pay up for air vs wait for sea, by SKU.
How subscribe-and-save math really works for supplement brands: churn curves by billing period, the LTV formula, and how many cycles it takes to recover CAC.
How supplement brands manage dated stock: 18 to 24 month expiry windows, cGMP lot traceability, FEFO, and sizing safety stock without writing off expiring batches.
Where US supplement ingredients and finished goods come from in 2026, plus the China and India ingredient dependence that quietly drives your supplement brand's COGS.
How supplement brands use stacks and bundles to lift AOV, shorten CAC payback, and protect the contribution margin that keeps multi-product subscriptions profitable.
Amazon vs DTC contribution margin per order for supplement brands: 15% referral fee plus FBA and ads versus higher DTC gross margin, paid CAC, and subscription LTV.
What it costs a supplement brand to stay legal in 2026: label review, DSHEA structure/function claims, FTC ad substantiation and NDI notifications, with dollar ranges.
When should a supplement brand leave its co-packer for in-house production? The gross-margin gain vs capex, cGMP overhead, and the breakeven volume math.
What cGMP manufacturing, COAs, and identity, potency and contaminant testing add to a supplement's COGS, plus how MOQs trap cash at low volume. Real 2026 ranges.
Supplement CAC runs $80-$130 with 3-6 month payback. See 2026 CAC, LTV:CAC, and payback benchmarks, and why subscription changes the math for supplement brands.
Who is acquiring supplement and wellness brands in 2026 and at what multiple. Real deals from Nestle, PepsiCo, Simply Good Foods and USANA, plus what drives a premium.
How to price supplements for subscription margin: set the anchor price, pick subscribe and save discount depth, and protect contribution margin after churn.
A CFO pricing framework for beauty brands: build up from COGS, fulfillment, samples, and returns to a target contribution margin, with a worked example.
What MoCRA actually costs a small DTC beauty brand: facility registration, product listing, safety substantiation, labeling and adverse-event reporting, with real 2026 dollar ranges.
Samples, testers, and GWP quietly eat 4 to 10 percent of revenue for beauty brands. Here is how to book them correctly and track sampling cost per acquired customer.
Beauty retail vs DTC margins: wholesale to Sephora/Ulta runs 50% keystone gross margin with no CAC, DTC runs 70% but spends it on CAC. The contribution-margin math.
How beauty brands book formulation, lab, and stability-testing costs under ASC 730 and Section 174A, and what it does to your EBITDA and valuation.
How the working capital cycle of a beauty launch traps cash from supplier deposit to sell-through, and how to finance the gap. CCC math plus financing options by cost.
How beauty brands plan inventory around shelf life, PAO and batch tracking. Why expiry-dated SKUs force smaller reorders and how shelf life interacts with inventory days.
What beauty brands spend on influencer and UGC marketing as a percent of revenue by stage, plus how to judge that spend on contribution margin, not reach.
Where US beauty imports come from in 2026: South Korea 24.8%, Canada, France and Italy lead HS 3304 while China sits under 8%. What it means for tariff risk.
Beauty Q4 can be 40% of annual sales. Here is the month-by-month cash plan: when inventory cash leaves, when the trough hits, and how to fund the peak.
Who is acquiring beauty brands in 2026 and at what revenue multiple. Real deals from e.l.f., L'Oreal and Helen of Troy, plus what drives multiples up.
A data map of where DTC products are made: 2025 US Census import origins for apparel, footwear, furniture, beauty, toys and electronics, plus the 2026 tariff hit.
Temple & Webster (ASX:TPW) reached $600.7m AUD revenue in FY2025 with a 33% gross margin, zero debt, and 1.274 million active customers. Teardown of the drop-ship model.
Asia-US container rates jumped 20-40% this week as importers front-run July Section 301 tariffs. What it does to DTC landed cost, COGS, and the front-load timing call.
Ulta Q1 FY26: net sales $3.16B (+11.1%), ecom comps mid-teens vs low-single-digit stores, new Gemini AI assistant. The operator read on conversational commerce.
Canada retail e-commerce share sits at 5.7% in November 2025 (StatCan), down from the 6.9% 2021 peak reading. Why the eMarketer 12% number double-counts your TAM.
USD/CAD hit 1.3717 in May 2026, 9.7% weaker than 2021. A 5% loonie swing costs Canadian Shopify brands ~2.4 GM points. The model, the hedge, the playbook.
Bank of England Bank Rate is 3.75%. UK DTC brands pay 6.14% to banks and 20% to 37% to Wayflyer, Uncapped, Liberis and YouLend. The full cost-of-capital stack.
BoC overnight rate is 2.25%. Canadian bank prime is 4.45%. Shopify Capital Canada lands at 15-30% APR. MCAs at 35-80%. The full 2026 stack for DTC brands.
Information wages are up 5.3% YoY, warehousing +4.1%, finance +3.8%, retail +3.3%. The function-by-function DTC payroll picture for 2026, from BLS CES.
Consumer-goods subscription churn benchmarks 6.5%/mo (Recurly), DTC consumer panel 7.1% (Recharge). Replenishment retains, curated boxes shrink in 2026 10-Ks.
Consumer sentiment at 49.8 while PCE consumption growth hit +5.94% YoY (April 2026). The DTC macro pulse: 6 indicators every ecom operator should track.
74,677 Shopify face & body stores vs 1,124 US toilet-prep manufacturers (NAICS 325620). Where the CPG white space actually sits in 2026, by category ratio.
Universal Store FY25: 61.1% gross margin, 16.4% EBIT, online only 13.3% of sales. THRILLS impairment, Perfect Stranger growth, and the AU DTC read.
Step One Clothing teardown: A$86.9M FY25 revenue, A$10.9M 1H FY26 inventory provision, 87% IPO drawdown. What an A$3-50M AU DTC founder should copy and skip.
Canadian ecommerce hit 7.0% of retail in Feb 2026 (StatCan). The triangulated 2026 Canada DTC benchmark: AOV, CAC, CVR and return rate by vertical in CAD.
Kruze Consulting is a venture-startup accounting firm. Eightx is an ecom-operator CFO. Side-by-side for $5M-$150M Shopify and Amazon brands choosing between the two.
Eightx vs inDinero for ecommerce brands. ICP, scope, pricing, error-catching, ecom-vertical depth, switching guide, and 8 FAQs.
Eightx vs FullyAccountable for $5M-$150M Shopify and Amazon brands. Pricing, scope, proactivity, error-catching, ecom-vertical depth, and switching guide.
Finaloop is an AI bookkeeping platform with a CFO add-on. Eightx is a senior CFO partner with bookkeeping behind it. Here is how to pick.
Eightx vs ecomCFO compared on scope, pricing, proactivity, error-catching, and ecommerce depth for $5M-$150M Shopify and Amazon brands.
Eightx vs Crew Finance for ecommerce brands. Where each fits, pricing, scope, ecom-vertical depth, and what to expect if you switch.
Burkland serves 800+ VC-backed SaaS startups. Eightx is built for $5M-$150M Shopify and Amazon brands. Here is the honest comparison.
Eightx vs Bench for ecommerce: scope, ecom depth, accuracy, response time, pricing, and who each is actually built for in 2026.
Average customer lifetime in months by ecommerce vertical for 2026. Supplements 12-20 months, beauty 7-13, food 6-13, pet 10-17, and why the month-3 cliff is universal.
Channel CM3 ranges from negative 22% on fully-loaded Meta to positive 77% on email and SMS. The 2026 benchmark table, the macro driver, and how to measure it.
Amazon FBA contribution margin (CM3) runs 8 to 15 points below Shopify DTC on the same SKU in 2026. Vertical benchmarks, fee math, and the channel mix decision.
CAC payback benchmarks for 2026: marketplaces 1-3 months, subscription 3-9, DTC 6-12. SEC 10-K data on Etsy, Chewy, Warby Parker, FIGS, BARK, and the math.
Blended ecommerce CAC midpoints by revenue band, 2026. Sub-$1M pays $95, $5-20M pays $75 (worst tier per Polar), $100M+ pays $55. Plus YoY inflation by band.
Adore Beauty disclosed a 20.7% H2-vs-H1 CAC cut in FY25, the only named AU DTC efficiency metric. Step One at 27% marketing. The verified AU CAC band by vertical, 2026.
Australia Post's sitewide A$96 online basket masks an 8x spread across verticals. Here's the 2026 AOV band by category, with ASX-listed AU DTC disclosures.
AU 3PL benchmarks for 2026: pick-pack A$2-A$5/order, storage A$25-A$45/pallet/month, NSW vs VIC vs QLD pallet rates, and the AusPost fuel-surcharge jump to 19.5%.
Cin7 Core starts at $349, Unleashed Core at $399 (USD/mo) in 2026, but the real decision is channel mix and EDI, not price. Decision matrix for ecom operators.
Avalara vs TaxJar (Stripe Tax) for DTC: revenue bands, channel mix, and the $5-10M crossover where TaxJar stops scaling and Avalara starts paying for itself.
Vendor Central runs a 75 to 120-day cash cycle. Seller Central can run negative. The 1P vs 3P finance comparison Amazon won't publish, for $5M-$150M operators.
Glossy.co ran a Tubi-sponsored post on beauty + CTV growth. Here is the independent data, the operator math, and the CTV decision tree for an 8-figure DTC beauty brand.
Relay gives 20 to 50 real checking accounts per entity with Thread Bank's $3M FDIC sweep and Profit First automation. Where it wins for DTC operators and where it falls short.
Recharge bought Skio for $105M in April 2026. We model all-in monthly platform cost for Recharge, Skio, and Smartrr at four GMV bands. The switch-point is $100K/month.
Ramp's AP is free; Bill.com runs $20K+/yr more at 500 invoices/mo. A fractional CFO's side-by-side on pricing, AP depth, AR scope, and ERP fit for DTC.
Triple Whale runs on 11.42% of Shopify Plus, Northbeam on 1.40%, Polar starts at $300/mo. A fractional CFO's read on which attribution platform pays back at each stage.
Most DTC brands graduate from QuickBooks Online to NetSuite between $15M and $30M revenue. The triggers, the cost stack, and the migration math for 2026.
Mercury, Brex, and Ramp compared for DTC operators in June 2026: FDIC sweep ceilings ($5M / $6M / $50M+), Brex Treasury 4.01-4.36% APY, card rewards, and pricing.
Lifetimely is the only one of the three with a real-time P&L. Peel runs deepest on cohort and subscription retention. Tydo is the exec dashboard. Here's how to pick.
NetSuite for a $20M DTC brand: Year 1 all-in $180K-$350K, Year 2+ $110K-$220K. Six QBO break-point signals, three-stack comparison, free TCO calculator.
Cogsy starts at $199/mo, Inventory Planner at $249.99/mo. The real choice is revenue band plus channel mix. Crossover sits at $10-15M with multi-channel complexity.
Highbeam is banking, card, and a line of credit. Wayflyer is a lump-sum capital advance. The CFO playbook on cost, fit, and when to run both in 2026.
A2X for Shopify and Amazon
Synder vs A2X
Shopify's backyard
Canada GST/HST/PST for ecommerce in 2026
What is a chargeback in ecommerce? Network rules, fees, and the 0.9% line
What is an interchange fee in ecommerce? The hidden layer inside your 2.9%
What is a payment reserve rollover? Stripe, Shopify Payments, and PayPal explained
Payment gateway vs payment processor vs acquirer
GMV vs net revenue
What is ROAS? The definition, formula, and the break-even number your margin demands
What Is MER (Marketing Efficiency Ratio)? Formula + 2026 DTC Benchmarks
What is CAC payback period? The months-to-recover formula every DTC operator should track
Free Intuit Amazon connector vs A2X, Link My Books, Webgility, Synder for QuickBooks Online 2026. Pricing, settlement mapping, and the GMV band where free breaks.
Celigo vs Boomi vs Workato vs custom SuiteScript for a $10M to $100M Shopify Plus brand. 36-month TCO, 9-failure-mode severity index, and the 10-question CFO demo script.
Mosaic was acquired by HiBob and is now Bob Finance. Cube, Drivetrain, and Bob Finance are three different products. Here is the honest buyer read for DTC operators in 2026.
Dext costs $25.21/mo in the US, Hubdoc is bundled free with Xero. We break down where the upgrade pays back for ecom brands, and where Hubdoc is still enough.
Fathom Starter is $53/mo. Jirav Starter is $833/mo. LiveFlow sits between them. Which management reporting tool fits a $1M to $50M DTC brand in 2026.
At 5,000 monthly tickets with 30% AI deflection, Gorgias costs ~$0.48 per ticket versus ~$0.165 on Zendesk. The crossover math most DTC operators miss.
DTC software typically runs 1.5% to 3% of revenue in 2026. Real per-vendor prices for Shopify Plus, Klaviyo, Loop, Yotpo, plus stack totals by stage.
Wayflyer's 8% fee paid back in 90 days is a 32.5% APR. Settle's 1.4%/month simple interest is 17%. The factor-rate-to-APR math every ecom CFO should run before signing.
ShipBob (3PL) and ShipStation+DIY both land near $7-$8 all-in per order at moderate volume. Real cost math, volume thresholds, and 2026 fee creep.
Stripe is 2.9% + $0.30. Shopify Payments is 2.15-2.9% + $0.30 plus a 0.2-2.0% third-party gateway surcharge. Here's what each routing actually costs in 2026.
Shopify Inc. revenue is $11.6B vs $342M at BigCommerce/Commerce.com (2025 10-Ks). What that means for your Plus vs Enterprise TCO at $20M to $100M GMV.
Shopify Tax, Avalara AvaTax, and TaxJar compared on price, features, and the moment you actually need to switch. Operator decision tree inside.
Webgility vs A2X for a multichannel ecom brand: order-level posting vs settlement-summary journals. Verified 2026 pricing, switch thresholds, and which tool fits your stack.
Bookings, billings, and revenue are three different numbers on a prepaid subscription. Here's the $12,000 worked example, the ASC 606 mechanics, and the journal entries.
Dead stock carrying cost defined for ecommerce: the 20-30% annual drag, the five components, two formulas, and the 180 and 365-day dead-stock thresholds for DTC.
DSCR is EBITDA divided by annual debt service. SBA and bank inventory lines want 1.20 to 1.25x minimum. Formula, lender thresholds, and the four traps that sink ecom deals.
EBITDA defined for ecommerce founders. Non-GAAP status, two formulas, the SEC reconciliation rule, and why M&A buyers and lenders anchor to it. Updated 2026.
Goodwill is what the buyer of an ecommerce brand pays above the fair value of identifiable assets. Solo Brands wrote $337M of it off between 2021 and 2024.
GST/HST for ecom: Canada's CAD $30,000 small-supplier rule, Australia's AUD $75,000 turnover threshold, HST rates by province, and simplified non-resident regimes for 2026.
Inventory shrinkage is the gap between book inventory and the physical count. NRF pegs it at 1.6% of sales. Here's how it hits a DTC P&L and what to do about it.
Keystone markup means doubling cost: 2x landed cost equals a 100% markup and a 50% gross margin. The formulas, the conversion table, and where the rule breaks for DTC.
MAP pricing is the lowest price a reseller may ADVERTISE, not sell. Legal in the US (Colgate doctrine), mostly illegal in the EU/UK. Bands, enforcement, Amazon.
MRR x 12 over-states subscription-ecom ARR by 30-40 percent at median churn. The formula, the Recharge tier benchmark ($56,096 / $1,271 / $316), and which MRR to actually use.
Open-to-buy (OTB) is the dollar amount of new inventory a merchant can receive. Formula: EOM + Sales + Markdowns - BOM - On-Order. Recalculate weekly to protect cash.
Run-rate revenue: a period of revenue stretched to a year. Why $3M November x 12 = $36M ARR is a trap for DTC, what TTM is, and when ARR math is actually legitimate.
Safety stock and reorder point defined for DTC operators: the APICS combined-variability formula, the Z-score table, and a 35-day China-lead-time worked example.
SDE is EBITDA plus owner pay plus add-backs. It is how brokers price your sub-$5M Shopify or FBA brand. Formula, 2026 multiples by category, worked example.
TTM is the rolling 12-month window buyers use to price your DTC brand. Formulas, the seasonal Q4 fix, and how to bridge TTM EBITDA to TTM SDE.
UK 20% rate, £90,000 resident threshold, £0 for non-UK sellers, £135 import rule, EU €10,000 OSS, €150 IOSS, ViDA timeline. Plain-English VAT glossary.
Wise Business: 0.33 to 0.60% over mid-market. Airwallex: 0.50% on majors, 1.00% otherwise. The math on $100K monthly USD-to-AUD, plus a free calculator.
A 5-user ecom team pays $588/yr more on QBO Plus than Xero Growing. Pricing, seat caps, A2X, multi-currency, and where both ledgers break at $10M+.
WTI up 79%, US diesel up 45% in 13 weeks. What the Iran oil spike does to 8-figure DTC shipping costs, COGS, and AOV - with FRED data and forecast scenarios.
Bookkeeper vs BAS agent vs accountant vs CFO in Australia
The 2026 EOFY checklist for Australian ecommerce
Virtual CFO vs Fractional CFO in Australia
What Is EBITDA Margin? (eCommerce Definition)
What Is Operating Margin? (eCommerce Definition)
What Is CapEx vs OpEx?
What Is SG&A (Selling, General & Administrative)?
Fractional CFO vs Full-Time CFO
What Is Net Working Capital (NWC)?
What Is Working Capital?
Average CPG gross margin by category 2026: beauty 64-74%, supplements 55-70%, household 55-65%, pet 30-62%, snacks 28-37%, alcohol 48-59%, food & bev 30-49%.
Amer Sports' CFO says tariff refunds have 'no visibility' and won't move the model. For an 8-figure DTC brand, $200K is real cash. What to actually do this month.
Cettire 90%, Lovisa 74%, Step One 32%, Adore Beauty under 2%. The nine-brand ASX scoreboard for Australian DTC international revenue share in FY25.
Canadian ecommerce gross margin by vertical for 2026: Aritzia 43.1%, Lululemon 56.6%, Roots 61.3%, plus the Bank of Canada and tariff read for your 2026 DTC plan.
Air freight costs roughly $5.47/kg China to North America in May 2026 (Freightos), ocean costs $0.23-0.40/kg (Drewry). Mode-mix benchmarks by CPG vertical.
Beauty brands ship 50 to 150 new SKUs a year. Focused food brands ship 5 to 15. The CPG new-product launch cadence benchmark by vertical for 2026, sourced from 10-Ks.
Public CPG R&D ranges 0.33% (Hain) to 8.43% (Beyond Meat) of revenue. HPC majors 1.7-2.6%, food/beverage 0.4-0.9%. The 13-company benchmark plus 5 brands that don't disclose.
DSO benchmark across 10 public consumer brands (SEC 10-K, FY2024). Pure-DTC: 0.9 to 12 days. Omnichannel: 24 days. CPG wholesale: 45 to 73 days. Updated quarterly.
Glassdoor says $173,904 for founders, $88,575 for ecommerce owners. Neither matches a real DTC brand. The actual average by revenue band from BLS, Kruze, and SEC.
Bootstrapped public DTC brands print 57.2% gross margin in FY2025. VC-backed brands print 51.4%. The 5.8 pt gap tracks category, not capital. Real divergence is cash.
10-brand public DTC panel FY2019-FY2025: median gross margin +1.1 pts (55.9% to 57.0%), median operating margin 14.6% (FY2020) to 2.9% (FY2022) to 5.3% (FY2025). It is opex, not COGS.
Mature DTC refer-a-friend programs drive 5-10% of revenue at the median and 12-30% top quartile. Beauty and pet lead. Electronics and home lag. The 2026 ranges.
FY2025 10-Ks for 10 public consumer brands: Levi's discloses 33% own-retail revenue cleanly. Lululemon est 40-50%, Warby >60%, FIGS 0%, ELF 0%. The three-tier ladder.
Storeleads 3.59M store panel + Klaviyo 10-K + Gorgias/Recharge public pricing. Only 1.82% of Shopify stores spend over $100/mo. Real app-stack budgets by revenue band.
EU ecommerce CAC sits in three tiers in 2026: DACH/Nordics EUR 60-110, France EUR 55-95, Iberia EUR 30-55. Zalando 10.6 percent marketing of revenue is the anchor.
Ten LSE-listed UK online retailers ranked by FY25 margin. Moonpig 27.6% EBITDA. ASOS 5.3% EBITDA on a £281.6m statutory pre-tax loss. Vertical beats scale.
ECB cut deposit rate 200 bps to 2.0% by June 2025 and held. EU DTC blended cost of capital fell only about 50 bps. Here is why and what to do this quarter.
Shopify global GMV hit US$100.7B in Q1 2026 and 170,300 of those merchants are Canadian. Ecommerce CFO scope, CAD retainer bands, and the math on a Shopify or Amazon CA brand.
UK online sales hit 28.1% of retail in April 2026 (ONS). Named London-HQ DTC brand revenues, fractional CFO £30-84K/yr vs full-time £130-300K base.
What a UK ecommerce CFO does, the post-Brexit and MTD items a US or AU CFO will miss, and the operator signals that mean it's time to hire one for your Shopify or DTC brand.
Latest official ecommerce-share readings for US, UK, EU, Australia, and Canada in 2026. A 4.8x spread, source-by-source. Refreshed quarterly from primary government series.
28% of EU individuals now order online from sellers in another EU country (Eurostat). EUR/USD up 12.8% in 16 months. The corridor + FX read for EU operators.
78% of EU-27 internet users bought online in 2025 (Eurostat). Ireland 95%, Bulgaria 57%. EU B2C turnover hit EUR 842B (EuroCommerce). The country map for DTC.
EU VAT thresholds in 2026: 10k EUR OSS, 150 EUR IOSS, the 3 EUR flat duty from 1 July 2026, and what ViDA changes in 2028. Living index for DTC operators.
Euro-area HICP Energy hit 110.24 in April 2026, the highest since the 2022 crisis. Here's what +55.6% vs 2021 does to EU-made DTC gross margins.
UK Amazon FBA in 2026: 30-50% of gross goes to Amazon, 20% VAT to HMRC, and Pan-EU FBA is permanently off-limits since 2021. The fractional CFO call on each.
Canadian Shopify fractional CFO retainers in 2026 sit at CAD $4,000-$12,000/month for $5-50M brands. 3,853 CA Plus stores, TO/Van/MTL bands, full-time crossover.
UK Shopify fractional CFO retainers in 2026 sit at £3,000-£7,000/month for £1-10M DTC brands. Five UK-specific finance traps, real bands, and the full-time crossover.
Where the five central banks landed in 2026 (ECB 2.00%, BoC 2.25%, Fed 3.63%, RBA 3.60%, BoE 3.75%) and the implied inventory-financing APR for global DTC brands.
Canadian outsourced CFO retainers run CA$4K to $30K/month in 2026. USD/CAD sat at 1.3717 in May. A 5% loonie move on 70% USD-COGS = 3.5 GM points. Buyer's guide.
What a UK outsourced finance function delivers at £1,200-£5,000/month in 2026, how it differs from a fractional CFO retainer, and which model fits your DTC brand.
Every major DTC packaging substrate sits 30 to 44 percent above January 2020 levels in April 2026. Aluminum cans +10.8% YoY on tariffs. What operators do about it.
US diesel $5.52/gal (+58% YoY), warehouse PPI +52% since 2021, surcharges 33% of the average commercial parcel and 51% of the residential DTC parcel. The FRED + BLS + carrier-rate math behind your 2026 free-shipping threshold.
UK online retail share hit 28.1% in April 2026 (ONS). UK clothing return rate is 23.6% (ZigZag). The vertical benchmarks UK operators can actually trust.
FY25 margin tracker for six UK and EU listed DTC brands. Zalando 4.8% adjusted EBIT, HelloFresh 6.3% AEBITDA, ASOS 5.3% adj EBITDA but -GBP 281.6m statutory PBT.
UK fulfilment cost per order in 2026 sits at £4.95 to £5.60 economy and £5.75 to £7.45 premium, up 8-12% YoY. Diesel, NLW and carrier rates triangulated.
UK online retail share was 27.3% in April 2026 (ONS J4MC) or 28.1% on the bulletin headline. Clothing online sits at 29.3%, food at 10.1%. UK leads the US and Australia.
Storeleads census of 251,169 active UK Shopify stores: 6,233 on Plus (2.48%), Klarna on 22.7% (highest globally), Apparel 23.1%, Klaviyo and Mailchimp tied.
44,000 UK firms now cap turnover below the £90k VAT threshold (OBR). The £49 sticker math, the absorb-vs-pass-through trade, and what crossing actually costs.
Canadian retail ecommerce hit 7.1% in March 2026. Virtual CFO scope, CAD $5K-$15K/month retainer bands, and the revenue point full-time CFO starts to clear.
What a UK virtual CFO covers, what it costs in 2026, and when the math beats a £300,000-£400,000 year-one full-time hire for £1M-£30M ecommerce brands. Real bands, real sources, no gated pricing.
Allowance for doubtful accounts: the contra-asset that reserves for expected bad debt on AR. Typical wholesale DTC reserve is 1-3% of gross receivables.
Amortization vs depreciation: same straight-line mechanic, different GAAP shelves. ASC 350 vs 360, IRC §197 tax twist, and Shopify's 8-year D vs A split.
Capitalize vs expense under ASC 350-40, ASC 730, and ASU 2018-15. The GAAP rules, the 100-300 bps EBITDA swing, and the QofE landmines buyers reverse.
Cohort analysis groups DTC customers by their first-purchase month, then tracks repeat rate and LTV. Here are the 2026 m0 to m3 retention benchmarks by vertical.
Economic order quantity (EOQ) is the order size that minimizes ordering plus holding cost. Wilson formula, a DTC worked example, and the seven places it breaks.
GMROI (Gross Margin Return on Inventory) is the cash-efficiency ratio behind every reorder. Healthy band 2.0-3.0, beauty 3-5, grocery 1.2-2.0. Formula plus benchmarks.
Incrementality testing measures the conversions your ad spend actually caused (iROAS), not what the platform claimed. The 2026 guide for ecommerce operators.
MMM is the post-iOS source of truth for DTC media spend. Adoption floor is $20M+ revenue, $3M-$5M+ media spend, 18-24 months of data. Cost band and MTA contrast.
Net revenue retention (NRR) for DTC subscription brands. Realistic band is 75-95%, not the 110-130% SaaS standard. Formula, benchmarks, and the three operator levers.
Prepaid expenses are payments for benefits you receive over multiple months. Definition, GAAP rules under ASC 340-10, DTC thresholds, and the journal entries.
Sell-through rate (STR): units sold divided by units received, times 100. Healthy band 70-80% per period; beauty 75-90%; below 40% is the warning zone.
P&G Beauty FY25: net sales $15.0B (-2%), net-earnings margin 18.1% (-140 bps), Skin Care net sales -HSD. What CPG's biggest skincare business teaches DTC.
Public CPG days payable outstanding benchmarks: Mondelez 155, Procter and Gamble 137, Lululemon 23, Celsius 22. The 28-brand DPO table from FY2023 to FY2025 10-Ks.
Public CPG lead-time benchmarks for 2026: Days Inventory Outstanding from 78 days (BellRing supplements) to 205 days (Olaplex), plus the Census retail I/S ratio.
Healthy DTC ecommerce runs at a 2-5% stock-out rate. Retail global average is 8%. Promoted SKUs hit 10%. Full benchmarks by vertical with the 2026 IHL Group $1.157T number.
Amazon is 11% of e.l.f., 24% of SharkNinja, 86% of Aterian, 93% of Pattern Group. The 10-K table for 19 public consumer brands sampled, FY2025.
2026 average order value benchmarks: Shopify $85 (Littledata), WooCommerce $105 to $122, BigCommerce $120 to $150. The platform isn't really driving the gap. Customer mix is.
Mobile AOV runs at 70-80% of desktop AOV across every 2026 benchmark (Kibo, Shopify, sqmagazine, Immerss). What the gap means for your CAC, LTV, and channel mix.
2026 cart abandonment benchmarks across 12 ecommerce verticals. Global average 70.2% (Baymard, 50 studies). Grocery 61%, apparel 72%, B2B 82%, finance/travel 81-91%.
Email and referral convert at ~4.2% in 2026, organic search 2.8%, Google paid search 2.5%, Meta paid social just 1.1%. Klaviyo flows beat campaign blasts 25-150x.
2026 ecommerce LTV benchmarks across 7 verticals. Shopify panel + public DTC 10-K gross margins. Revenue LTV is half the story; the contribution-margin flip is the other half.
Storeleads pull of 3.59M Shopify stores: 4.6% of supplements brands and 4.3% of beauty brands run a loyalty app. Only 1.5% of electronics do.
Cross-industry LTV:CAC median is 3.4:1 in 2026, top quartile 5.6:1. Vertical bands from public DTC 10-Ks and benchmark data: pet, beauty, apparel, electronics.
Reverb 80% unpaid traffic. Etsy 79% GMS (a proxy). REVOLVE 49% free + low-cost. The 10-vertical DTC organic search benchmark for 2026, from SEC 10-Ks + Similarweb.
Shopify's 10-K shows a 2.33% blended take. Affirm 2.40%. Klarna 2.74%. PayPal 1.50% transaction-only. Why your effective rate is closer to 4.4%.
Parcel PPI up 54% since 2019, accelerating again in 2026. Public DTC and consumer 10-K disclosures land 1.9% to 22.6% of revenue. The vertical-by-vertical read.
Annual prepay subscribers retain 2.5x longer than monthly (28% vs 11% at month 12). The 2026 DTC churn benchmark by billing period with cohort survival math.
FY2025 net margins for 18 public DTC and CPG brands. Lululemon 14.2%, Vita Coco 11.7%, Allbirds -50.7%. Six cleared 5%. Eight posted net losses.
Klaviyo's 2026 cohort puts email at 27% of revenue across 183,000+ brands. Supplements run 30-40%, apparel 20-30%, electronics 12-22%. The vertical-by-vertical bands.
Courier PPI up 12.3% YoY in April 2026, the highest reading since 2023. All-in DTC fulfillment cost per order in 2026 lands $10 to $17 by vertical. The benchmarks.
FY2025 public DTC gross margin ranges 25% (Dutch Bros) to 75% (Tapestry). Four-band averages sit within a 5-point band (43.7% to 48.2%). Scale does not fix margin.
The DTC staffing curve from US Census CBP and SEC 10-K data. 4-5 FTEs at $1M, 20 at $10M, 70 at $50M, 135 at $100M. With the structural assumptions behind each.
Gross margin is revenue minus COGS, expressed as a dollar or percent. Formula, vertical benchmarks for 2026, and why CFOs distrust it as a primary KPI.
Net margin is profit after every cost, COGS, OpEx, interest, tax. Formula, 2026 public DTC ranges (2-14%), and why net margin is your bank-account truth metric.
LTV is total contribution margin a customer generates over their relationship with you. Formula, time-horizon traps, and 2026 ranges by ecommerce vertical.
LTV:CAC ratio = lifetime value ÷ customer acquisition cost. 3:1 is the floor for healthy DTC. Formula, thresholds, channel-level vs blended, and 2026 vertical anchors.
Add-backs are one-time or non-operating items added back to reported EBITDA to derive Adjusted EBITDA. Which ones survive buyer scrutiny, which ones don't.
QofE is the financial deep-dive a buyer's accounting team performs in M&A diligence. What they look for, why your reported EBITDA usually shrinks, how to prep.
ASIN = Amazon Standard Identification Number. The 10-character ID for every Amazon product. Structure, why ASINs matter for catalog management, and how to find yours.
Amazon's three ad types in 5 minutes. When to use Sponsored Products, when to layer in Brands, when Display works. Budget allocation rule of thumb.
The Buy Box is the default Add-to-Cart on an Amazon listing. ~80% of sales flow through it. Factors, how to win and hold it, what losing the Buy Box costs.
IPI is Amazon's 0-1000 score gating FBA storage capacity. Composition, threshold, how to improve, what happens when IPI drops at peak season.
A SAFE converts to equity at a future priced round. No interest, no maturity. The standard early-stage instrument. Valuation cap, discount, and dilution mechanics.
Term loan = fixed lump sum borrowed for a fixed period. The right tool for one-time large capital needs. Structures, APRs, what banks vs alt lenders charge.
Deferred revenue = cash received but not yet earned. Sits as a liability on the balance sheet. Why subscription brands carry significant deferred revenue.
Depreciation spreads the cost of a capital asset over its useful life. Why it's in operating margin but not EBITDA. Common DTC depreciation schedules + GAAP rules.
Scenario planning runs base / stress / optimistic cases through your model to see what breaks. The three scenarios every ecom brand should refresh quarterly.
Sensitivity analysis flexes one variable at a time to see how much it moves the output. The CFO tool that ranks operating levers by leverage.
Budget = annual plan, set once. Forecast = updated periodically. Actuals = what happened. All three together is BVA reporting, and what investors want.
Variance analysis = actuals minus forecast, with commentary. The monthly close discipline that separates competent FP&A from bookkeeping. Structure + format.
Australia's 10% GST takes 9.09% off every domestic gross dollar before margin. ASX-listed DTC brands sit from 100% exposed to 7% exposed. The structural breakdown.
Average ecommerce NPS sits between +6 and +74 in 2026 depending on the source. Per-vertical numbers, the four traps, and what to do if your score is below median.
Australia has no published conversion-rate-by-vertical table. Here is what the five ASX pure-plays disclose for 2025-2026 and how to read the global Shopify benchmark from AU.
AU ecommerce return rate by vertical 2026: no ASX pure-play discloses a rate, AusPost says 41% of shoppers returned an item, Power Retail cites ~31% fashion.
Public DTC peers turn inventory 2-3 times a year. Healthy private DTC brands hit 6-12 turns. The 3-4x gap is the playbook for $5M to $50M operators.
FY2025 10-K data: Revolve 3.2%, Hasbro 4.4%, Tootsie Roll 7.8%, Lifetime Brands 11.4%, CarParts.com 18.9%. The CPG warehouse-cost spread by vertical.
Six published 2026 3PL guides triangulate to $1.50-$3.00 first-item pick and $0.30-$0.75 per additional. Couriers PPI +12.3% YoY is the real 2026 cost shock.
US ecommerce affiliate spend hits $13.81B in 2026 (+11.3% YoY). Mature beauty and fashion programs drive 18-30% of online revenue. Electronics and CPG cap at 8-15%.
Blended CAC sits 10-45% below paid CAC depending on vertical (Food & Bev biggest gap, Electronics smallest). The 2026 read on what the gap is hiding.
From bootstrapped to IPO: ecom board sizes from NVCA model docs + 13-company public DTC proxy data. 5 seats at Series A, 9 at IPO, ~$285K per independent.
8 public DTC proxies plus BLS show the fair cash band for CEO, CFO, and COO pay by revenue. Median CEO base $773K. Median CFO base $487K. May 2026.
US ecommerce CX cost per order in 2026 lands at $0.15 to $0.55 by vertical. BLS + Influx Gorgias + Zendesk data. Apparel $0.42 median, food/CPG $0.22.
Gorgias all-store market average runs 200-500 tickets per 1,000 orders. Well-automated DTC portfolios run 40-100. Per-vertical 2026 ranges and the math.
Median public DTC accounting D/E is 0.75x; interest-bearing D/E is 0.00x. 10 of 17 peers carry zero long-term debt. By revenue band: 0.71x, 0.94x, 0.70x.
Carta says Seed 20%, Series A 20.5%, Series B 16.7%. IdeaProof says DTC Seed 24%, Series A 26%. The four levers that drive your actual founder dilution.
FRED Prime is 6.75%. Bank lines run 8-10%. Shopify Capital, Wayflyer and Clearco run 15-50% effective APR. Traditional MCAs hit 60-90%+. Where your brand sits.
What a $5M, $25M, $100M, and $1B DTC brand actually staffs in engineering in 2026. The staffing curve, the SEC 10-K context, and the build vs buy decision.
PitchBook-NVCA Q1 2026 medians: seed $3M, Series A $19.6M, Series B $40M, Series C $75M. The DTC version of that curve runs 10 to 30 percent lower. Here is what to plan.
DTC G&A as a percent of revenue is U-shaped. Public-DTC cohort median sits at 13.3% (FY2025 10-Ks). Sub-$10M private brands averaged 23% in FY2025 per A2X (down from 25.36% in FY2024). Here's the full curve.
Crocs Brand sits at 49% international, Wayfair at 12%. Public DTC and CPG 10-K geographic segment splits show your vertical sets the ceiling more than skill.
Loyalty redeemers spend 23-31% more per order than non-members; VIP-tier members hit +73%. Vertical-by-vertical AOV-lift benchmarks for 2026 DTC operators.
Pooled median marketing spend across 12 public DTC/CPG 10-Ks is 13.3% of revenue (range 2.2 to 31.1%). Beauty 26%, F&B 14%, apparel 12%. The CM3 anchor overrides all of it.
DTC marketing-team benchmarks by revenue band, 2026. Public 10-K marketing intensity (12-15% at scale), FTE-per-$1M curve, role-mix, in-house vs agency.
Median FY2025 operating margin across 20 public DTC and ecom brands is 2.9% (3.7% ex-Rent the Runway). Only Lululemon clears 15%. 7 of 20 are negative.
FY2025 10-Ks decoded: Chewy customers buy 9.5x/year, Wayfair 1.88x, Etsy 1.59x, Warby Parker ~1.4x. Public DTC + private MHI benchmark, by vertical.
Apparel DTC brands run 8-14 sitewide promos a year. Electronics runs 3-6. BFCM is 3.1% of annual US ecommerce, not 30%. Full per-vertical promo benchmark for 2026.
Ecommerce CX benchmarks 2026: live chat FRT 12-30 sec for leaders vs ~2 min average. Email FRT 1-2 hours vs 12 hours. AI resolution median 10%, high performers 8-15%.
Modeled all-in returns processing cost per item by vertical, 2026: apparel $25-35, electronics $35-55, large furniture $55-90+. Anchored to Optoro, Pitney Bowes, BLS.
e.l.f. Beauty: $1.93M per employee. Warby Parker: $216K. The 9x gap across 14 public DTC brands and how to read your own number in 2026 by channel mix.
No vendor publishes reviews-per-product by vertical in 2026. Here's the working benchmark we use with DTC operators, plus the Storeleads and PowerReviews data behind it.
27% of live Shopify stores carry under 10 products. SKIMS runs 475. Fashion Nova runs 232,832. The SKU-by-revenue-band benchmark no one else publishes, May 2026.
SMS sits at 10-20% of total DTC revenue for mature programs in 2026. By-vertical benchmarks for beauty, apparel, supplements, electronics, plus Klaviyo and Postscript numbers.
Pause usage is up 337% YoY on platforms that offer pause-before-cancel (Recurly, 76M subscribers). Working monthly pause-rate ranges by DTC vertical for 2026.
Chewy Autoship hit 83.3% of net sales in FY2025; Recharge pegs food & beverage at 22% of subscription GMV. The vertical-by-vertical benchmark for DTC operators.
Card-required trials convert 31.4%, no-card trials 8.9% (Adapty 2026). Replenishment holds 92%+ of first boxes; beauty bleeds 30-40%. 2026 by vertical.
Healthy DTC brands spend 3-6% of revenue on tech in 2026 (operator-guide range); primary-source data lands LOWER at 0.5-3.5%. Storeleads + vendor pricing benchmark by band.
US TikTok Shop GMV is on pace for $23.4B in 2026 (eMarketer). Beauty owns ~22%, fashion ~24%, food ~7%. The category mix that should drive your channel plan.
Carta says consumer Seed to Series A median is 819 days. Crunchbase says only 20% of 2022 seed DTC brands have graduated. What that means for runway planning.
Cross-vertical median time to second purchase is 15-35 days (apparel 15-27, supplements 27-68, durables 30+). 50% inside 30 days, 76% inside 90. The 2026 DTC benchmark.
Wholesale share of net revenue for 9 public consumer brands, FY2025 10-K and 20-F filings. FIGS and Warby at 0%, YETI 40%, On 58%, Birkenstock 62%, e.l.f. 76%, Levi's ~90%.
Same SKU, Shopify keeps about $63 of a $100 order; Amazon keeps $44. The 10-25 point gross margin gap, what 2026 fees changed, and how to book it cleanly.
Meta median ROAS sits at 1.93x in 2025 across 35,000 ecommerce brands; Google at 3.68x. Per-vertical Google premium runs +23% to +91%. Breakeven math + 15-vertical table.
FY25 10-Ks for 9 public DTC brands: Hims 2.55, FIGS 6.78, Warby 7.66, Stitch Fix 10.80, REAL 14.25. Median 8.47. What your category's MER ceiling actually is.
Refund rate is not return rate. 2026 by-vertical benchmarks for the cash going out the door: apparel 17.5%, beauty 6.4%, electronics 7.2%, furniture 17%.
14-company public DTC headcount benchmark for 2026: Vita Coco, FIGS, YETI, Etsy, Lululemon, Crocs, Warby Parker, Stitch Fix, more. SEC EDGAR data. What a $50M brand should target.
13-company public DTC benchmark for inventory write-downs from SEC 10-Ks. Allbirds at 7%, Beyond Meat 4.5%, Lululemon 0.3%. Median 1.2% of revenue. What to budget at $50M.
2026 ecommerce KPI benchmark report, 7 core metrics, public DTC + CPG comps from SEC 10-K filings, private-brand stage targets, sourced and ungated.
DIO = (Avg Inventory ÷ COGS (Cost of Goods Sold)) × 365. How long inventory sits before sale. Vertical benchmarks for 2026, why CFOs use DIO to find trapped cash.
Inventory turnover = COGS (Cost of Goods Sold) ÷ avg inventory. How many times a year you sell through stock. Formula, vertical benchmarks, why turnover is your working capital efficiency proxy.
DPO = (AP ÷ COGS (Cost of Goods Sold)) × 365. Days you take to pay suppliers. Why extending DPO is the cheapest source of working capital you have. 2026 benchmarks + tactics.
DSO = (AR ÷ Revenue) × 365. Days between selling and collecting cash. Why DTC sits at 0-3 days and wholesale sits at 30-75. Formula and 2026 benchmarks.
Burn rate = monthly net cash outflow. Burn multiple = net burn ÷ net new ARR. Why burn multiple is the new VC litmus test in 2026, plus thresholds and red flags.
FCF margin = (operating cash flow − capex) ÷ revenue. The bank-account truth metric. 2026 public DTC ranges, why FCF beats EBITDA for survival decisions.
Shopify's 2026 conversion-rate table: food & beverage 6.22%, home & furniture 1.41%, luxury & jewelry 0.94%. Plus device split, UK YoY trend, and how to benchmark.
10 public CPG and DTC 10-Ks show COGS ranges from 26% on Shopify-led DTC to 67% on wholesale. The benchmark a private operator can hold up next to their own P&L.
Median days inventory on hand across 26 public DTC and consumer brands: 127 days pooled, 168 beauty, 140 apparel, 38 food/bev. Use the vertical median, not the universal one.
Landed cost per unit by vertical, China-origin, 2026. The duty stack (MFN + Section 301 + Section 122) now runs 21.5% (beauty) to 45% (food/beverage) of FOB.
US customs duties jumped from $97B to $364B SAAR in 9 months. Effective tariff rates by HS chapter for 11 CPG verticals plus disclosures from YETI, Tapestry, e.l.f.
Amazon ACoS by category for 2026: apparel 42%, books 19%, platform average 32.5%. Sponsored Products CPC up 34% in two years. The operator read on each.
FY2025 public DTC AOVs range from $84 (1-800-Flowers, $1.7B) to $640 (Revolve FWRD, $253M). Where private $1M-$100M brands actually sit on the Shopify distribution.
Chewy autoship runs 83.3% of $12.6B in net sales at $591 per active customer. The subscription AOV uplift is real for consumables, not for apparel. 2026 benchmarks.
The 2026 ecommerce discount median across 93,000 merchants is 15% off. BFCM adds less than 1 point in every category. Cyber Week peaks run 1.5-2x trailing.
FY2025 10-Ks for 19 public consumer brands: Lululemon 24.4% EBITDA margin, SharkNinja 16.6%, six brands negative. The DTC EBITDA benchmark your buyer actually uses.
Air package delivery PPI is up 17.2% YoY in April 2026. Per-parcel US outbound rates to Australia, UK, and Germany across USPS, DHL, FedEx, UPS, and consolidators.
Mobile hit 51% of US online spend in October 2025 (Adobe). Apparel and beauty mobile-revenue-majority. Electronics and home still skew desktop. 2026 by vertical.
Zero public sources publish a clean ecom traffic-share by vertical for 2026. What 750K US Shopify stores and FY2025 DTC 10-Ks show on paid intensity by vertical.
2026 ecommerce repeat purchase rate (RPR) benchmarks across 15+ verticals: consumables 35-55%, apparel 20-35%, electronics 10-20%, plus Chewy 83% and Wayfair 79%.
Lovisa's H1 FY2026 result: A$498m revenue (+22.7%), 82% gross margin, 1,095 stores, but ANZ revenue dropped 4.9% YoY. The Lovisa playbook decoded for AU DTC.
FTI Consulting found Mosaic Brands likely insolvent from 31 Dec 2020, 1,397 days before administration. AUD 385.97m in liabilities. Zero brands sold. The operator lessons.
Premier Investments sold five Apparel brands to Myer for ~A$945m, kept Peter Alexander (+7.7%) and Smiggle (-10.7%), plus its 25.5% Breville stake. The DTC read.
28.7% of Shopify Plus stores run TikTok Pixel vs 10.4% of regular Shopify. Beauty leads at 20%; food and drink sits at the baseline. Storeleads data, May 2026.
We pulled the FY2025 10-Ks for 10 public DTC brands. None break out Amazon channel gross margin. Here is how to read the gap and benchmark your own.
Median CCC by vertical: apparel 112, beauty 132, food 86, household 96, electronics 45. HIMS runs -31 days; FIGS runs 209. Free calculator inside.
Warehouse wages +18%, diesel +48%, headcount -6%, couriers PPI +37% since Jan 2022. The BLS + FRED data your 2026 3PL renewal needs.
Zero US DTC IPOs since Birkenstock in Oct 2023. Census says retail business applications hit a record 1.17M in 2025. What the divergence tells operators about exit math.
BLS OEWS data plus 7 small-cap public DTC CEO proxies show the fair-market founder salary band by revenue. Free calculator. May 2026.
Apparel +48% Q4 lift, grocery +7%, ecom 35%. Ten-year Census MRTS data and a free calculator that turns your TTM revenue into Nov-Dec dollars and cash needed.
Apparel CPI is finally running above apparel PPI (+4.17% vs +2.89%, April 2026). Food, beauty, and furnishings: where each DTC category sits in the four-year squeeze.
Apparel fell 27.5% in COVID and 7.1% in 2008. Furniture crashed in 2008 but boomed in 2020. The BEA PCE data on which DTC categories actually hold up in a recession.
A returned $100 apparel order costs you $30 to $40 after shipping, 3PL handling, markdown, payment fees, and abuse drag. Run YOUR numbers in the calculator.
Storeleads data on 3.59M Shopify stores: only 1.8% spend over $100/mo on apps. Cutting from 17 to 11 apps lifted add-to-cart 28%. The bloat audit playbook.
Seven years after Wayfair, 45 US jurisdictions enforce economic sales tax nexus. Per-state thresholds, the 17 states that dropped 200-tx, and a calculator.
10 US states hold 54% of households earning $100K+. The Eightx DTC Demand Index ranks all 50 states + DC on the four signals that predict your CAC. Heatmap inside.
Every $1M trapped in your inventory + AR cycle costs $120,000/year at a 12% cost of capital. Public DTC benchmarks from FIGS (191 days) to Wayfair (-44).
Public DTC ad-spend hit a 13.2% cohort median in FY2025 (10 brands, SEC 10-Ks). But ad-spend % is a consequence metric, not a steering metric. Here's what to watch.
Parcel costs up 37% since Jan 2022, packaging up 22%, apparel only 17%. BLS PPI + FRED freight read for DTC operators, May 2026.
US retail e-commerce hit 16.9% of total retail in Q1 2026 (Census CB26-81). Penetration by category has split into saturated, mid-cycle, and stuck buckets.
FY2025 10-Ks for 19 public DTC brands: Lululemon 19.9% op margin, Allbirds -52.4%, median 4.1%. Even leaderboard winners gave back gross margin year-over-year.
Articore (ASX: ATG) expanded GPAPA margin from 22.1% to 26.5% as marketplace revenue fell 21%, FY2022-FY2025. FY2026 guidance targets A$2-8m positive EBIT.
Adore Beauty (ASX:ABY) grew EBITDA 53% on flat A$199M revenue. Marketing fell to 12% of revenue. H2 FY2025 CAC hit A$59. Gross margin at a record 35.3%.
Cettire (ASX:CTT) grew to A$742M sales revenue without holding stock. FY2025 teardown: 16.1% gross margin, going concern note, US tariff risk explained.
City Chic Collective (ASX: CCX) nearly tripled to A$369m then imploded. A$196m inventory trap, A$174m equity loss, and what the FY25 turnaround looks like.
Kogan.com (ASX:KGN) statutory revenue fell 36% from FY22 to FY24 but gross profit hit a record $189.9m in FY25 at 38.9% margin. Model shift, Kogan First, and Mighty Ape.
The all-in cost of a full-time AU CFO in 2026 (base, 12% super, STI, retained-search fee) vs the published industry bands for fractional CFO engagements.
Storeleads census of 152,323 active Australian Shopify stores: 3,653 on Plus (2.40%), Afterpay on 26.3% (highest globally), Klaviyo 21.4%, Apparel 21.5%.
AU online retail hit 12.7% in June 2025 (ABS, final release). The scoreboard is gone, non-food drives the growth, and the UK at 27.3% is the forward curve.
The 10 ASX-listed AU DTC brands in FY25, ranked. Gross margin spans 16.1% (Cettire) to 82.9% (Lovisa). Three of 10 posted statutory losses. The full benchmark.
Retail job openings up 48% YoY in March 2026 (BLS JOLTS); warehousing employment still contracting. The DTC layoffs we've tracked from public 8-K filings.
The 7-Layer eCommerce Profitability Audit — what a real audit looks like, the seven layers, dollar-finding ranges by ARR stage, and a 5-day DIY version.
14-peer public DTC Days Payable Outstanding benchmark FY2022-FY2025 from SEC EDGAR. The cohort bifurcated: strong brands stretched payables, weak brands lost supplier leverage.
14-peer public DTC borrowing cost benchmark 2026. Effective interest rates from SEC 10-K filings + SOFR context from FRED. Use before signing your next revolver.
FRED parcel PPI is up 37% since 2022. Truck and rail barely moved. Public DTC shipping ratios fell 8%. The 28-point gap is what your 3PL is not telling you.
Median cash conversion cycle (DIO + DSO − DPO) by ecommerce vertical 2026. Apparel vs beauty vs food. Public 10-K data.
Capital One closed its $5.15B Brex acquisition on April 7, 2026. What is actually changing for ecom brands on Brex - and what to do this quarter.
Median selling/marketing spend as % of revenue by ecommerce vertical 2026. Beauty 21%+ vs CPG food 5-10%. Public 10-K data.
Public DTC and CPG operating margin benchmarks by vertical (apparel, beauty, food, footwear). 2026 SEC EDGAR data, decomposed.
First-touch credits the channel that started the journey. Last-touch credits the channel that closed it. Both are biased. When to use each, what they hide.
Attribution model = the rule for crediting which channel drove a conversion. First-touch, last-touch, multi-touch, data-driven. Why every model lies differently.
Prospecting targets new audiences who haven't seen your brand. Retargeting targets people who have. CAC, ROAS, and incrementality differ massively. The math.
Tapcart is on 1.7% of Shopify Plus stores per Storeleads — 1,296 brands. Why mobile-app adoption stays niche, when ROI works, what each tier costs.
Yotpo 9.3%, Okendo 6.1%, Junip 1.3% — real reviews-app adoption on Shopify Plus. Where each wins, what they cost, and how to pick.
What an ecommerce CFO actually does — beyond the P&L. The 7 functions, when to hire, what each tier (fractional / full-time / interim) costs.
R&D as % of revenue benchmarks for public DTC and CPG 2026. Why most brands don't disclose R&D and what the disclosers tell us.
Median selling, general & administrative expense as % of revenue by ecommerce vertical 2026. SEC EDGAR data, decomposed.
Markup = profit ÷ cost. Margin = profit ÷ price. Same dollars, different percentages. The conversion math, when each is right, and a free calculator.
Cash basis vs accrual basis for ecommerce: when to switch, the GAAP rules, the IRS threshold ($27M), and a 4-step conversion process. CFO-grade guidance.
Outsourced CFO services explained: fractional vs interim vs project-based, what each costs, what you actually get, and how to pick.
Fulfilment cost per order = total fulfilment spend ÷ orders. The number CFOs use to evaluate 3PL pricing, scale economics, and contribution margin.
3PL = Third-Party Logistics. Outsourced warehousing + fulfilment. Why DTC brands use them, typical cost structures, when to switch to in-house or 4PL.
Reverse logistics = handling returns. Return shipping, receiving, inspecting, restocking, refunding. Why returns can cost more than the original order.
Last-mile = the final delivery from local hub to customer's door. The most expensive leg of shipping, 30-50% of total. Carrier options, cost compression strategies.
Sellable recovery rate = % of returns that can be restocked at full price. The metric that determines true return cost. By vertical, 2026 ranges, recovery tactics.
Return rate = % of units returned. Vertical benchmarks 2026: apparel 8-15%, beauty 5-10%. Why blended rates lie + the SKU-level math that matters.
How CFOs run FBA forecasting: demand + lead-time + cash + scenario layers, by SKU, with stockout penalty and IPI risk priced in. Monthly cadence template.
Honest SKU-level FBA profit analysis: 6 hidden cost categories, working capital allocation, scenario planning. Typical recovery: 200-650 bps of margin.
Where DTC brands lose the money between gross profit and operating profit. The cost-structure trap explained. SEC EDGAR data 2026.
Public DTC brands with great gross margins and broken operating margins. The cost-structure trap, diagnosed. SEC EDGAR data 2026.
NAB Online Retail Sales Index: $66.23B online retail spend in 12 months to Sep 2025 (+14.2%), monthly YoY growth 12.5%, 14.9% online share of retail. Category and state breakdown, plus the monthly trend that complements Aus Post's annual data.
Net proceeds = what you actually take home after a sale. Headline price minus debt, taxes, banker fees, legal, true-ups, holdback. Why headline ≠ pocket.
Exit multiple = enterprise value ÷ EBITDA (or revenue). The valuation shortcut. 2026 DTC ranges, what drives multiple expansion + what kills it.
An LOI sets price, structure, and timeline before formal M&A diligence. What's binding, what's not, and the LOI provisions that protect sellers.
A holdback is a portion of purchase price withheld in escrow to cover indemnity claims post-close. How much, for how long, what triggers release.
Klaviyo pricing by contact count and features. Why $10M+ Plus brands pay $1,700 to $15,000 per month, and how CFOs negotiate the bill down.
How long do loss-making public DTC brands have? Cash runway analysis 2026 for Honest Co, Bark, Beyond Meat, Allbirds. SEC data.
The 50 most-adopted Shopify apps and technologies in 2026, ranked by adoption across 74,777 Plus stores. Real data from Storeleads.
Exa Labs ($2.5B) and Parallel Web Systems ($2B) just raised $350M to build the AI search layer. What that means for ecom brands betting on Google rankings in 2026.
TikTok Shop says US small-business sales rose 66% in 2025 on $14B GMV. What it actually means for DTC operators deciding whether to put real money behind the channel in 2026.
Shein's acquisition of Everlane is the latest signal that the standalone DTC era is over. What it means for capital, valuations, and exit math.
Revenue-based financing = capital advance repaid as % of daily sales. Wayflyer, Settle, Clearco. Factor 1.06-1.20 = 20-35% APR. When RBF works and when it traps brands.
Inventory financing = capital secured against inventory (PO financing, ABL, RBF on inventory). 12-25% effective APR. When it makes sense for DTC brands.
FBA fee stack: referral + fulfillment + storage + reserve + ads + returns processing. Eight layers of Amazon costs that erode 25-45% of revenue on FBA SKUs.
Amazon's referral fee = the % cut Amazon takes on every sale. 8-15% typical, varies by category. The biggest Amazon cost most sellers ignore in unit economics.
Recharge vs Bold vs Loop subscription apps — pricing, integration depth, churn-prevention features, and the right pick by Shopify brand stage.
Real Storeleads data on Triple Whale adoption across Shopify. Where it over-indexes, where it under-indexes, and what's pulling brands to alternatives.
A Seattle class action says Amazon pocketed hundreds of millions in tariff costs after the Supreme Court struck Trump's IEEPA tariffs. What ecom sellers should do this week.
Parker (YC ecom charge card) filed Chapter 7 on May 7, 2026 after a $90M sale fell through. What's breaking this week if you used them, and what every ecom founder should do now.
Calculate your real ecommerce CAC + compare against 2026 vertical benchmarks. What goes in the numerator, what gets miscounted, and how to fix it.
Revenue recognition = when you book the sale, not when cash arrives. ASC 606, subscription deferral, and the rules that trip up DTC brands at audit.
Cash accounting records money when it moves; accrual records it when earned/owed. Why ecommerce brands must use accrual at $1M+ and when GAAP requires it.
Landed cost = unit manufacturing cost + inbound freight + duty + import handling. The number you should be using as COGS in your unit economics.
COGS = direct costs to make and acquire what you sold. Materials + labor + freight + duty + import handling. The denominator for gross margin.
The 60-item due diligence checklist Eightx uses on ecommerce M&A — quality of earnings, working capital, customer-concentration, channel-mix, tax exposure.
State nexus thresholds, marketplace facilitator rules, audit triggers, and the CFO playbook for ecommerce sales tax across all 50 states.
Klaviyo vs Attentive vs Mailchimp for Shopify Plus — adoption %, pricing, when to stack (Klaviyo + Attentive) and when to migrate from Mailchimp.
Afterpay vs Klarna vs Affirm — pricing, merchant fees, geography, conversion lift, and the right BNPL choice by Shopify Plus brand profile.
Contribution Margin 3 (CM3) is CM2 minus variable marketing spend. The final unit contribution to fixed costs and profit. Formula, benchmarks, why CM3 is the truth-telling number.
Public DTC inventory days expanded then compressed 2020-2026. The bullwhip effect, peak inventory glut at 2022, recovery arc. SEC EDGAR data.
Contribution Margin 2 (CM2) is CM1 minus variable fulfillment (shipping, payment processing, 3PL, returns). CM2 is the max-CAC ceiling — not CM1, not gross margin. Formula, benchmarks, common mistakes.
Contribution Margin 1 (CM1) is revenue minus landed COGS. The gross-margin layer at the unit level. Formula, what belongs in landed COGS, and where CM1 sits in the CM1/CM2/CM3 ladder.
Cash runway = cash on hand divided by monthly burn. How many months until you run out. Why operators undercount runway and the right way to model it.
Cash conversion cycle = days inventory + days AR - days payable. The single best working capital metric for ecommerce. Formula, benchmarks, levers.
Public DTC capex intensity vs revenue growth — who reinvests, who pulls back, and what the asset-light vs capex-heavy split says about the model. EDGAR 10-K data.
Contribution margin for ecommerce: CM1 vs CM2 vs CM3 math, what to include in each layer, the calculator, and the benchmark ranges by vertical.
Capex as % of revenue by DTC vertical — apparel, beauty, footwear, food/bev, outdoor. Where capital intensity comes from + the operator implications.
Australia Post 2026 report: AU online retail $82.6B / +14% YoY. Category breakdown, regional growth, what it means for DTC + ecommerce CFOs.
Dilution = your % ownership drops when new shares get issued. The math, the founder-vs-investor framing, and how to model it before you accept a round.
A cap table is a spreadsheet showing who owns what — founders, employees, investors, and the rounds that got each person to their stake.
How the public DTC cash conversion cycle has shifted 2020-2026. Inventory days, AR days, AP days, and the working-capital delta over six years.
Storeleads cross-region comparison of Shopify Plus tech stacks across US, UK, and Australia. Where the regional differences actually are — and where they aren't.
Storeleads adoption % across 19,360 apparel Shopify Plus stores. Klaviyo, Yotpo, Recharge, returns tooling, BNPL. The actual apparel stack — not the claim.
Australia Post 2026 category breakdown of $82.6B online retail. Fashion + Cosmetics 21%, Specialty Food 11%, Home + Garden 9%. Real share %.
Real Storeleads adoption % across 9,061 beauty Shopify Plus stores. Klaviyo 63%, ReCharge 2.10x over-indexed, Attentive 3.13x. Why beauty brands pick what they pick.
A rolling forecast continuously adds new periods as old ones close, keeping a consistent 12-18 month forward view. Why it beats annual budgeting for DTC brands.
A reforecast replaces your old forecast mid-year with current actuals + a revised view of the remaining year. When to reforecast and how to do it.
A driver-based forecast models the business from operating drivers (orders, AOV, conversion) instead of P&L line items. More accurate, more useful for decisions.
A 13-week cash flow forecast tracks every cash in and out for 13 weeks, refreshed weekly. The standard CFO tool for distress, turnarounds, and scaling brands.
Fractional CFO for CPG brands: trade promotion accounting, slotting fees, retail-vs-DTC margin splits, the financial leadership pattern that scales CPG.
Fractional CFO services for clean-tech and green-tech startups: grant accounting, R&D credits, hardware-vs-SaaS unit economics, runway management.
MCA = lump-sum advance repaid via daily/weekly % of sales. Factor rates 1.20-1.50, real APR 50-180%. When MCAs make sense (rarely) and when they trap DTC brands.
APR is annual interest you can compare across loans. Factor rate is a flat multiplier MCA lenders use to mask the true cost. How to convert factor rate to APR.
Food/Bev CPG Shopify Plus stack varies by model: subscription DTC favors Recharge + retention; retail-DTC favors shipping + reviews. Real adoption % from Storeleads.
Real adoption % across 74,777 Shopify Plus brands. Shop Pay 63%, Klaviyo 50%, Gorgias 13%. What the modern Plus tech stack actually looks like in 2026.
Inventory write-down = lowering the carrying value of inventory to reflect realizable value. When DTC brands take them, GAAP rules, M&A diligence.
Accrued liabilities = expenses incurred but not yet paid. Payroll between paydays, taxes not yet remitted, marketing spend with delayed invoicing.
TACoS = total ad spend / total sales. Why TACoS beats ACoS for measuring true advertising efficiency. Healthy TACoS by category + how to trend it.
ACoS = ad spend / ad-attributed sales, by campaign. Formula, break-even ACoS by category, why ACoS-only optimization fails brands at scale.
Customer acquisition cost (CAC) is total sales + marketing spend divided by new customers acquired. Formula, blended vs paid CAC, 2026 vertical benchmarks.
Blended CAC includes all customers and all marketing spend. Paid CAC is only paid-channel attributed customers. Use blended for unit economics; paid for channel allocation.
Asset-based lending (ABL) is a revolving credit line secured against inventory and receivables. 60-85% advance rate, SOFR + 250-450bps, typical $5M-$50M ecommerce range.
A line of credit gives ecommerce brands flexible draw-down capital for inventory, ad spend, and working-capital gaps. Revolving vs term, typical pricing 2026.
Days sales outstanding benchmarks for public DTC and CPG brands 2026. Pure-play DTC vs wholesale-distributed brands compared. SEC EDGAR data.
Public DTC marketing spend % of revenue 2020-2026: pre-iOS14, attribution loss, post-2023 rationalization. SEC EDGAR data.
Fractional CFO engagement size + cost by revenue stage 2026: hours/month, retainer, scope. Sub-$1M to $50M+.
From 2019 $25 IPO to -121% operating margin in 2026: the Beyond Meat P&L unwind. What private DTC and CPG founders should learn.
Asset turnover (revenue / total assets) benchmarks for public DTC and CPG brands 2026. Asset-light vs asset-heavy comparison.
Effective tax rate benchmarks for public DTC and CPG brands 2026. NOLs, jurisdictional mix, tax credits. SEC EDGAR data.
Public footwear brand benchmarks 2026: Crocs (26%+ op margin), Boot Barn, Genesco. Plus On Holding and Birkenstock context (foreign filers).
Apparel CPI +10.9%, consumer sentiment 53 (depressed), saving rate 3.6% (low). The triple stress squeezing DTC growth into 2026-2027.
USD/CNY exchange rate trajectory 2020-2026 vs how public DTC brands are diversifying sourcing away from China. Where production moved and what it cost.
Average ad spend as a percentage of revenue ranges from 7% to 35%+ depending on ecommerce stage. See 2026 benchmarks for $1M, $5M, $10M, $25M, and $50M+ DTC and CPG brands.
Days payable outstanding benchmarks for public DTC and CPG brands 2026. The supplier-terms working capital lever. SEC EDGAR data.
5 public household CPG brands 2026: Church & Dwight, Newell, Energizer, Spectrum Brands, Helen of Troy. Operating margins, FCF, working capital.
eCommerce cash runway benchmarks by revenue stage: sub-$1M brands need 12+ months, $1-5M need 9-12, $5-25M need 6-9, $25M+ run on 4-6.
The 5 public DTC and CPG brands with the longest cash conversion cycles 2026 — what is trapped, why it matters, how to fix it.
Average inventory turnover by ecommerce vertical 2026: fashion 4-7x, beauty 4-9x, supplements 8-12x, F&B 12-15x, pet 8-10x, home 3-5x, electronics 4-6x, subscription 12-18x.
Median inventory days on hand by ecommerce vertical 2026. Apparel, beauty, food/bev, footwear from public 10-K filings. SEC EDGAR data.
Beauty and personal care public benchmarks 2026: e.l.f., Olaplex, Beauty Health, Coty, Inter Parfums, Ulta, Sally, Edgewell, Honest Co. Per-brand margin profiles.
30-year mortgage rate from 2.68% pandemic low to 7.62% peak to 6.33% in 2026. Home and furniture DTC brand dynamics 2020-2026 — discretionary capacity and the 2-3 year housing-DTC lag.
When consumer sentiment falls, do DTC brands cut marketing or lean in? Cross-analysis of FRED UMCSENT vs public DTC S&M intensity 2024-2026.
An earnout is contingent purchase-price payable post-close based on hitting performance targets. Why buyers love them, why sellers should structure carefully.
WC true-up = post-close adjustment to purchase price based on delivered NWC vs target. The detail that costs sellers $100K-$2M+ when ignored.
The PROFIT Score is a six-vector project prioritization framework for $20M-$250M DTC/CPG operators. Why RICE breaks for ecom, why time is risk (not cost), and how to rank a roadmap.
AI compresses three of the six PROFIT Score vectors (P, I, T) and leaves R, O, F unchanged. The result: your project stack reshuffles, modestly but meaningfully. Here's what that looks like.
When personal saving rates dipped in 2024-2026, which DTC categories grew and which fell? Public 10-K revenue growth vs FRED PSAVERT — discretionary capacity decoded.
Did public apparel DTC brands pass through 2022-2026 input-cost inflation? Lululemon, FIGS, Stitch Fix, Revolve revenue-per-unit vs apparel CPI. Pricing power scorecard.
Free cash flow margin benchmarks for public DTC and CPG brands 2026. Why FCF beats operating margin as a quality-of-earnings test. SEC EDGAR 10-K data.
CAC payback for public DTC 2026 — gross margin x marketing spend = contribution margin after marketing. Cross-analysis of 13 SEC 10-K filings.
WTI crude oil price vs ecommerce shipping margin 2026 — how oil moves carrier fuel surcharges, last-mile cost, FedEx/UPS rate cards, and DTC shipping economics. The four-line oil-to-margin model.
Public DTC operating margin trajectory 2020-2026 — how 5 years of post-COVID volatility, inflation, and operating discipline reshaped DTC profitability. Per-year median across 11 public brands.
Apparel public benchmarks 2026 across 9 SEC issuers — Lululemon, Revolve, Stitch Fix, FIGS, Allbirds, others. Per-brand gross margin, operating margin, marketing spend, inventory days from latest 10-K filings.
e.l.f. Beauty 2026 playbook — 71.24% gross margin, 12.03% operating margin, 21% S&M intensity, $10-and-under pricing architecture. SEC EDGAR 10-K data + private brand takeaways.
RBA cash rate 4.10% as of April 2026, up 50bps in four months. Five-year history (0.10% pandemic trough to 4.35% peak), with what every AU DTC brand should be doing about financing, AUD, and working capital.
Olaplex 2026 playbook — 69.43% gross margin, professional-channel-plus-DTC mix, patent-protected actives, and why a margin machine still posts only 1.64% operating margin. SEC EDGAR 10-K data + private-brand takeaways.
SKU rationalization playbook for ecommerce 2026 — the 80/20 contribution analysis, when to cut underperformers, the inventory-turnover and CM3 framework, and the 200-SKU-to-80 case studies that lifted operating margin 4-7 points.
Food & beverage CPG public benchmarks 2026 across 8 issuers — Vital Farms, Celsius Holdings, Beyond Meat, and 5 more. Revenue, gross margin, operating margin, marketing spend, inventory days from SEC 10-K filings.
Highest revenue public DTC brands 2026 — Lululemon ($11.10B), Beyond Meat, Olaplex, Yeti, e.l.f., Vital Farms, Beauty Health. Per-brand revenue, growth rate, operating margin from latest 10-K filings.
Complete cash conversion cycle guide for ecommerce in 2026 — DIO + DSO − DPO formula, healthy ranges by stage ($1M-$50M+), three compression plays, and the $1.6M cash unlock from a 30-day CCC reduction at $20M revenue.
Public DTC gross margin trajectory 2020-2026 — how 5 years of inflation, tariffs, and freight costs reshaped DTC unit economics. Per-year median across 11 public brands plus what 2026 forward looks like.
Yeti Holdings 2026 playbook — 11.43% operating margin on $1.85B revenue, asset-light contract-manufacturing model, retail-plus-wholesale-plus-DTC channel mix. SEC EDGAR 10-K data + private-brand takeaways.
How retail gasoline prices flow into DTC shipping cost structure 2026 — fuel surcharges, last-mile delivery economics, FedEx/UPS rate cards, and the four-line shipping-margin model every $5M-$50M DTC brand needs.
Stock-based compensation as a percent of revenue across 11 public DTC and CPG brands in 2026 from SEC EDGAR 10-K filings — median, percentile bands, and what private brands should learn about equity dilution math.
Average CAC payback by DTC vertical 2026: subscription 90 days, supplements 4-6 months, beauty 4-7 months, electronics 12+ months. Plus the channel × payback math, the working capital formula (payback × monthly burn), and why subscription is a 6x cash-recovery accelerator.
Fed funds rate vs DTC cost of capital 2026 — how the FOMC rate path moves your WACC, debt cost, equity cost, and the discount rate that sets your valuation. Macro-to-WACC translation for $5M-$150M DTC.
Top 5 public DTC brands by operating margin 2026 — Lululemon (19.9%), e.l.f. Beauty, Vital Farms, Yeti, and the operating playbook that separates them from the median (1.6%).
Top fractional CFO firms for ecommerce 2026 — comparison of Eightx, Driven Insights, Pilot CFO, Bench CFO, and the senior-partner-led specialist firms by ICP, pricing, model, and onboarding speed.
Lululemon DTC playbook 2026 — 19.9% operating margin, vertically-integrated retail, and the unit economics that made it the most profitable apparel brand in the public DTC universe.
Average AOV by ecommerce vertical 2026: luxury $250-380, electronics $200+, beauty $40-90, food & beverage $30-60, supplements $40-80. Plus channel AOV (Amazon $52 vs DTC $85-95), free shipping thresholds, and the bundle math that quietly destroys margin.
Fractional CFO for Shopify brands 2026: settlement reconciliation, multi-channel revenue recognition, ShopifyQL limits, and the financial operating system every $5M-$50M Shopify brand needs.
Outsourced CFO services for ecommerce brands 2026 — when to hire, what to expect, pricing bands ($3-15k/month), and the difference between fractional, interim, and outsourced CFO models.
2026 FX volatility for cross-border DTC: CAD/USD 1.37, AUD/USD 0.72, GBP/USD 1.35. The silent margin killer most ecommerce brands don't hedge against.
Subscription DTC churn benchmarks 2026: meal kits 8-15% monthly, beauty boxes 8-12%, supplements 5-8%, pet food 6-10%, household 5-8%. Plus the gross vs net churn distinction, M1/M3/M6/M12 retention curves, the involuntary-churn recovery math (30-40% of total), and multi-channel cohort measurement.
2026 buyer's guide to fractional CFO services for Series A-D ecommerce founders. Selection criteria, pricing, top providers, and stage-specific recommendations.
Median CapEx intensity for public DTC brands in 2026 is 1.85% of revenue across 10 SEC 10-Ks — Yeti, e.l.f., Lululemon, Vital Farms. p25 0.54%, p75 5.51%, with retail vs pure-DTC cuts.
Average COGS by vertical 2026: beauty 20-40%, apparel 30-55%, home 35-55%, food & beverage 50-70%. Plus sub-vertical breakdowns, the landed-cost stack, 2025 Section 301 tariff impact, freight normalization, and how to record COGS cleanly in Xero/QBO.
Cash conversion cycle benchmarks 2026: pure DTC 30-60 days, multi-channel 60-100 days, CPG with wholesale 90-150 days, subscription often negative. Plus channel-level disbursement timing (Shopify 2-3d, Amazon 14-21d, wholesale NET 30-90) and the working capital math that determines scale ceiling.
Interim CFO vs fractional CFO comparison with 2026 numbers. Interim: $15-35k/month full-time, defined end. Fractional: $5-15k/month part-time, ongoing. Pick based on trigger, not budget.
Interim CFO for M&A diligence: $25-35k/month, 90 days through 6 months. QoE prep, integration planning, post-close 100-day cadence. PE-trained senior partner.
Median operating margin across 11 public DTC and CPG brands in 2026 is 1.6%. p25 -5.0%, p75 11.5%, with Lululemon top at 19.9%. Pulled from latest 10-K filings on SEC EDGAR.
Median SG&A as a percent of revenue for public DTC brands in 2026 is 50.3%. Cleaned 10-K benchmark across 6 US issuers — p25 39%, p75 57%. Decomposition + private-brand stage curve.
Average ecommerce bookkeeping cost 2026: sub-$1M $300-$1,200/mo, $1-5M $1,500-$4,000/mo, $5-25M $4,000-$12,000/mo, $25M+ in-house team $20K+/mo. Plus the multi-channel premium, the in-house-doesn't-beat-outsourced-until-$15M math, and what AI is actually doing to bookkeeping pricing in 2026.
DTC subscription LTV runs 3-5x higher than one-time purchase LTV at the same gross margin in 2026. The math, category-by-category benchmarks (beauty, supplements, pet, household), the churn impact on LTV, and the data hygiene most brands get wrong by 20-40%.
A 7-question decision framework for choosing a fractional CFO at a $5M-$50M DTC, ecommerce, or CPG brand. Red flags, contract terms, pricing benchmarks.
Honest comparison of major interim CFO firms in 2026: Robert Half, BluWave, PwC, Korn Ferry, McCracken Alliance, Eightx. Cost, onboarding speed, model (staffing-agency vs senior-partner-led), and ICP fit.
Median DTC days inventory on hand 2026 is 133 days across 11 public 10-K filings. p25 79, p75 169. Category cuts (apparel, beauty, food) and CCC implications.
Shopify all-in cost runs 3-4.5% of revenue for most ecommerce brands in 2026. Plan-by-plan breakdown (Basic 4.10% effective vs Plus 2.40%), the third-party gateway tax, Plus break-even at $1.27M monthly GMV, and the FX/Markets fee changes that hit April 2026.
Interim CFO for parental leave: 3-12 month coverage at $18-28k/month. Onboarding cadence, returning-CFO handover, and the planning window most founders waste.
US apparel CPI hit 135.8 in March 2026, up 14% over 5 years (FRED CPIAPPSL). The pricing-power gap that compressed apparel margins, plus the small-annual-lifts playbook for $5M-$50M fashion DTC brands.
Median net profit margin across 11 publicly-traded DTC and CPG brands in 2026 is 0.2% — with p25 at -3.7% and p75 at 8.7%. Lululemon (14.2%), Yeti (8.9%), Vital Farms (8.7%), and e.l.f. Beauty (8.5%) anchor the profitable end.
E-commerce hit 16.4% of total US retail in Q3 2025, up from 11.9% pre-pandemic. The macro trajectory every $5M-$50M DTC founder needs to plan against in 2026.
CFO quit suddenly? Hour-by-hour, day-by-day stabilization playbook for the first 30 days. From a firm running emergency interim engagements at 35+ ecommerce and CPG brands.
Interim CFO cost in 2026: $15-35k/month banded by engagement scope. Emergency 90-day stabilization $25-35k, parental leave coverage $18-28k, M&A bridge $25-35k. From a $650M+ managed-revenue fractional CFO firm.
Median cash conversion cycle for public DTC brands in 2026 is 130 days across 9 SEC 10-K filings — Warby Parker 13, Yeti 97, Olaplex 172. p25 56, p75 140.
Median DTC marketing spend is 13.3% of revenue in 2026 across 10 public 10-K filings — Yeti 7.8%, Warby Parker 12.6%, e.l.f. 21.4%, Beauty Health 31.1%. p25 9.0%, p75 19.3%.
Beauty ecommerce gross margin benchmarks 2026 from public 10-K filings: e.l.f. 71%, Olaplex 69%, Beauty Health 65%, Honest Co 33%. Median GM 69.4%, marketing spend 21–31%, plus the unit economics gap private brands miss.
Median DTC gross margin 2026 is 57% across 11 public SEC filings — Warby Parker, Olaplex, e.l.f., Yeti, Lululemon. p25 46%, p75 64%, by category and stage.
Average ecommerce CM3 ranges from 5% (electronics) to 35% (supplements). 2026 CM1, CM2, CM3 benchmarks across eight verticals plus Amazon vs Shopify channel splits.
International expansion capex for DTC brands 2026: US-to-EU $250-750K, US-to-UK $150-400K, US-to-AU $100-300K, AU-to-US $200-500K. Plus the year-1 P&L drag, the Allbirds liquidation lesson, and the four-question filter that determines whether a $500K-$2M capex commitment is the right move.
Average customer acquisition cost (CAC) by channel in 2026: Meta $212-230 fully-loaded ($38-58 platform CPA), Google $50-130, TikTok $90-129, influencer $40-300+, email near-zero. Channel-by-channel benchmarks, attribution math, and what's actually working from a fractional CFO.
The ecommerce unit economics framework Eightx uses with $6M–$60M brands: contribution margin by channel, true CAC, cohort LTV, and LTV:CAC ratios explained.
Most DTC brands run finance and marketing in silos — quietly killing their CAC. Here's the shared dashboard framework that stops cash flow surprises for good.
Most DTC founders cut ad spend when they see losses. Here is the finance-marketing framework that tells you when scaling is actually the smarter move.
Bill.com cuts eCommerce invoice costs 60%+ and speeds approvals 3x. Learn pricing ($49–$89/user/mo), the 5-step setup framework, and when to switch to Beanworks or Tipalti — from a fractional CFO who manages AP for 35+ brands.
Written by a CFO who used Beanworks across 8 subsidiaries. Learn 3-way PO matching setup, Bill.com comparison, and the 5-step implementation framework for eCommerce brands doing $10M–$50M+.
Ramp's corporate card and AP automation can save eCommerce brands 15-25 hours/month and $50K+/year. Learn the setup playbook, Ramp vs Brex vs Divvy, and how Eightx implements Ramp for DTC brands at $3M-$50M.
Highbeam gives eCommerce brands up to 4.5% yield on idle cash, instant Shopify payouts, and AI-powered treasury management. Learn AP automation best practices and how Eightx implements Highbeam for DTC brands at $3M-$50M.
Gusto payroll costs $49/mo + $6/employee for eCommerce teams. Learn how to set up Gusto, integrate with QuickBooks/Xero, avoid contractor misclassification, and optimize payroll for cash flow.
Rippling payroll starts at ~$8/employee/month for eCommerce teams. Learn setup, QuickBooks/Xero/NetSuite integration, multi-state compliance, and when to upgrade from Gusto.
QuickBooks Shopify Plus integration done right: chart of accounts setup, A2X vs native connector, clearing account reconciliation, and the weekly process Eightx uses for Shopify Plus brands doing $2M-$20M.
Stripe revenue recognition for eCommerce: ASC 606 compliance, gross vs net recording, clearing account reconciliation, subscription deferrals, and the setup process Eightx uses for DTC brands processing $2M-$20M through Stripe.
Home goods ecommerce margins run 35-55%, but freight eats 10-18% of revenue if unmanaged. Learn landed cost analysis, DIM weight optimization, and the CM1-CM2-CM3 framework to fix your margins in 2026.
Complete guide to setting up Xero for Amazon FBA sellers in 2026. Chart of accounts, A2X integration, settlement reconciliation, inventory accounting, and common mistakes to avoid.
Honest CFO assessment of ShopifyQL Notebooks ($2,300+/mo, Plus-exclusive) and Shopify Plus attribution analytics — what they're good for, what they can't do, and the financial reporting workarounds that actually matter.
Multi-channel revenue recognition for Shopify and Amazon sellers: how to record gross revenue by channel, reconcile settlements, separate marketplace fees, and build channel-level P&Ls. Framework used across 35+ ecommerce brands.
The 8 subscription box financial metrics that actually matter: MRR decomposition, churn rate benchmarks (below 5% monthly), LTV calculation, CAC payback, and contribution margin per box. Framework from a fractional CFO who has worked with subscription brands from $2M to $130M.
The complete ecommerce due diligence checklist from a former PE investor: quality of earnings, revenue quality assessment, working capital normalization, EBITDA add-backs, and the 7 red flags that kill deals.
Prepare your DTC brand for exit with this 18-month financial readiness guide. Exit multiples, EBITDA optimization, data room checklist, and earn-out strategies from a former PE investor.
ROAS measures channel efficiency, MER captures total marketing return, and blended CAC shows true acquisition cost. Learn which ecommerce marketing metric to use for every decision with worked examples and 2026 benchmarks.
eCommerce inventory management from a CFO lens: carrying costs run 22-41% of inventory value annually. Learn ABC prioritization, reorder point formulas, supplier term negotiation, and cash conversion cycle optimization.
Learn how to build a 13-week cash flow forecast for your eCommerce brand. Step-by-step framework from a fractional CFO who’s built forecasts for 35+ brands with $650M+ in combined revenue.
Learn how to calculate, benchmark, and improve your LTV:CAC ratio. Formula breakdowns, 2026 benchmarks by vertical, and the playbook a fractional CFO uses to fix unit economics for $5M–$50M eCommerce brands.
AU vs US ecommerce finance unit economics compared: GST vs sales tax, freight gaps (35% vs 18% of revenue), currency risk, and the 5 mistakes Australian founders make with US benchmarks.
Calculate landed cost for Australian ecommerce imports: customs duty, ABF tariff classification, GST, deferred GST scheme, Xero inventory tracking, and supplier payment terms.
Amazon Seller Central accounting done right: settlement reconciliation, fee categorization, returns handling, and the processes Eightx uses for Amazon sellers doing $2M–$130M.
A fractional CFO for Australian ecommerce manages GST compliance, BAS lodgment, and cash flow forecasting at 60-80% less than a full-time hire. Learn what it costs, what to expect, and how Eightx delivers results for AU brands.
Ecommerce accounting in Australia with Xero: GST codes, BAS mapping, Shopify integration via A2X, tracking categories, and the 7 most common mistakes. Practical guide from an AU ecommerce CFO.
Australian DTC brands scaling to $10M must fix 3PL costs (often 30% of revenue vs 15% benchmark), build driver-based forecasts, and manage seasonal cash flow. Real data from AU brands.
NetSuite for eCommerce costs $75K–$200K+/year. Learn when to upgrade from QuickBooks, real implementation costs, migration tips, and the 5 rules for a successful ERP rollout — from someone who’s led 3 implementations and rescued 2 failures.
Shopify Plus financial reporting misses revenue recognition, landed COGS, and multi-location inventory costs. Learn what native reports get wrong and how to build a reporting stack that gives your finance team real numbers.
Learn how to build a driver-based financial model for your DTC brand — covering revenue forecasting, unit economics, scenario planning, and monthly variance analysis. Built from 50+ real engagements.
Learn how to set up QuickBooks Online for eCommerce the right way — chart of accounts, Shopify and Amazon integrations, weekly reconciliation, and the 5 most common QBO mistakes that cost brands money.
CPG accounting requires specialized financial reporting for retail deductions, trade spend accruals, co-manufacturing costs, and channel-level contribution margins. Learn the CM1/CM2/CM3 waterfall framework, accrual methodology, and how to build a CPG financial model that works.
A complete ecommerce tax strategy covering economic nexus thresholds by state, sales tax automation tools (Kintsugi, Avalara, TaxJar, Numeral), and LLC vs S-Corp vs C-Corp entity structure for online sellers.
Amazon FBA inventory creates tax nexus in every state where your products are stored. Learn multi-state sales tax, income tax exposure, FBA deductions, entity structure (LLC vs. S-Corp), and the CPA quarterback model Eightx uses with sellers from $2M to $130M.
Average eCommerce profit margins by industry: beauty 65-85%, supplements 65-78%, apparel 50-65%, food & beverage 40-55%. See 2026 benchmarks by vertical, revenue tier, and channel with the CM1/CM2/CM3 framework.
Fractional CFO cost in 2026: $3,000–$12,000/month for most brands. Compare fractional vs full-time CFO pricing ($350K–$800K/year), see what’s included, and calculate ROI with real eCommerce case studies.
Average eCommerce CAC ranges from $53 to $377+ by vertical. See 2026 benchmarks for fashion, beauty, pet care, food & beverage, and electronics — plus LTV:CAC ratios, payback periods, and channel-level costs.
The average ecommerce return rate in 2026 is 19-20.5%. See return rates by category (apparel 25%, electronics 11%, beauty 12%), the real cost per return, and proven reduction strategies.
Learn how to calculate contribution margin for ecommerce using the CM1/CM2/CM3 framework. Includes benchmarks by category, channel, and step-by-step examples.
A fractional CFO for SaaS companies builds driver-based financial models, tracks MRR, churn, and CAC payback, and prepares investor-ready board decks — at 60–80% less than a full-time hire. Learn what to expect, what it costs, and how Eightx delivers results in 90 days.
eCommerce bookkeeping services handle multi-channel revenue recognition, landed-cost COGS, inventory accounting, and clearing account management that generic bookkeepers miss. Learn the real differences, costs, and when to upgrade.
Learn how to break down Amazon FBA settlements, map fees to the right P&L lines, reconcile deposits-in-transit, and build channel-level contribution margin reports.
A fractional CFO for Amazon FBA sellers decodes messy marketplace data, builds bottoms-up forecasts, optimizes unit economics, and prepares your brand for exit. Learn how Eightx helps FBA brands from $3M to $60M scale profitably.
A fractional CFO for CPG companies manages trade spend optimization, retail margin analysis, S&OP cycles, and multi-channel financial modeling. Learn how Eightx helped a $65M CPG brand reach EBITDA break-even in 30 days.
A fractional CFO for eCommerce builds driver-based forecasts, manages cash flow, and optimizes unit economics at 60-80% less than a full-time hire. Learn what to expect, what it costs, and how Eightx delivers results in 90 days.
Master ecommerce seasonal cash flow with a 120-day peak season framework. No credit line needed. Real numbers, supplier tactics, and Q1 recovery planning.
Upload one Shopify sales report and get a 15-page inventory strategy — SKU rankings, dead stock recovery, and a 90-day action plan. Free AI skill built by EightX, powered by Claude AI.
Discover what a fractional CFO ecommerce brands actually need—cash flow models, SKU profitability, channel unit economics, and exit prep. Real outcomes, real numbers.
Choosing the right eCommerce platform in Canada requires more than just comparing features—it demands understanding how each platform’s fee structure,...
Introduction SaaS Fractional CFO services transform subscription businesses from revenue-tracking spreadsheets into predictable growth engines. Beyond basic...
Why Forecast Misses Hurt CPG Growth Consumer packaged goods brands face a brutal reality: invalid deductions alone can cost more than 10% of revenue. Beyond...
Running a fast-scaling eCommerce brand without the right financial expertise is like driving blindfolded. Inventory decisions, cash flow management, ad spend...
1. Introduction In 2025, the financial landscape for Canadian businesses is evolving rapidly. Virtual CFO services have emerged as a game-changing solution for...
Discover how fractional CFO services help CPG brands streamline finances, boost margins, and scale smartly—from startup to Canadian market expansion.
Unlock global growth with a fractional CFO—optimize finances, manage risk, and expand your eCommerce brand with confidence and clarity.
Modern brands operate in an increasingly complex financial landscape while managing tight budget constraints12. Whether you’re scaling a startup,...
Running an online business today is tough. The market changes fast, and it’s hard to know what will happen next. As someone who helps many e-commerce...
The global ecommerce market has experienced exponential growth, expanding from $1.3 trillion in 2014 to over $6.3 trillion by 2023, driven by technological...
A fractional CFO helps ecommerce brands boost profitability, improve cash flow, and scale smart—without the cost of a full-time hire.
Tariff cuts offer relief—but de minimis exclusion leaves small ecommerce brands facing 120% duties. Fractional CFOs urge urgent strategy shifts.
As a fractional CFO serving multiple e-commerce businesses, I’ve been closely monitoring the evolving tariff situation between Canada and the United...
Discover how fractional CFO services are redefining finance in 2025—blending AI, strategy, and flexibility to drive growth for ecommerce and CPG brands.
Equity financing can be a game-changer for businesses seeking to scale, innovate, or weather volatile markets. Yet, the process is complex, with high stakes...
The current trade tensions between the United States and Canada have created significant challenges for businesses on both sides of the border. With the...
The global trade landscape shifted dramatically this week as President Trump announced a 90-day pause on most U.S. tariffs, sending shockwaves through...
Understand the real financial impact of Trump tariffs on e-commerce in 2025 and explore strategic CFO insights to protect margins and cash flow.
Is your 8-figure eCommerce brand ready for a fractional CFO or just a tactical financial fix? Learn how to decide and unlock real growth clarity.
Thinking of selling your eCommerce or CPG brand? Avoid deal-killing financial mistakes with this exit-readiness guide for founders.
Not sure if you need a CFO or controller? Here’s how to build the right finance team for your $10M–$30M ecommerce or CPG brand.
Is your financial model slowing you down? Learn how to simplify and align it with real business drivers to scale your ecommerce or CPG brand faster.
Learn how to use EOS to cut meeting overload, boost accountability, and scale your ecommerce or CPG business faster and smarter.
Stop drowning in dashboards. Learn the few metrics that truly drive profit and growth for $10M+ ecommerce and CPG brands.
Get your ecommerce or CPG leadership team to embrace metrics without pushback—simple steps to build accountability and boost growth.
Unlock smarter business decisions with scorecards—simplify complex data into 15 key metrics that fit how your brain processes information.
Generic cash flow advice fails at $10M+. Here's the weekly-to-daily forecasting, debt discipline, and inventory playbook we use with CFO clients.
Discover how new tariffs affect your ecommerce sales with our Tariff Demand Impact Calculator. Predict demand drops before raising prices.
Debt or equity? Learn how to choose the right financing to scale your ecommerce business from $10M to $30M without risking cash flow or control.
Unlock growth with key financial metrics every scaling eCommerce & CPG business must track to boost profits, cash flow, and smart decisions.
Explore top CFO priorities for 2025: AI ROI, digital skills, and strategic finance partnerships to drive profitable growth in an AI-driven world.
Align your leadership team and boost business performance with an executive scorecard that tracks key metrics and drives smarter decisions.
Align leadership teams and boost performance with an executive scorecard. Track key metrics, improve meetings, and drive proactive business growth.
Struggling to get an ecommerce loan? Discover practical tips and creative financing options to fund your business and boost growth confidently.
As a business owner, how can you stress less and forecast your cash flow so you’re still scaling? Sometimes your business plan doesn’t always follow the...
Stay sharp
One email per week. No fluff—just actionable finance strategy for eCommerce and CPG founders.
Join 2,000+ brand operators. Unsubscribe anytime.