
Insights
Always-On Supply Chains: What They Cost to Build
Always-on supply chain replenishment costs $50,000 to $2M-plus in year-one software and integration, plus $1M to $50M-plus if you add warehouse automation like AutoStore-class robotics. Two peer-reviewed studies put the savings at 19.1% to 53.89% versus periodic ordering, with payback on automation running two to three years.
Key Takeaways
- Cloud WMS software runs $100 to $1,000 per user per month, with a full first-year implementation (license, integration, training) totaling $50,000 to $2M or more depending on scale.
- Warehouse automation (AutoStore-class robotics) runs $1M for an entry-level install up to $50M or more for a large multi-national DC, with vendors quoting 2-3 year payback and 50%+ labor savings.
- Two peer-reviewed operations-research studies (2017 and 2018) put continuous-replenishment savings at 19.1% (healthcare distributor model) to 53.89% (automotive plant) versus periodic review, independent of vendor marketing.
- The periodic model you'd be replacing is itself getting more expensive to run, which is what to watch next because that cost curve keeps climbing: BLS producer prices show parcel delivery up 64.5%, warehousing up 44.5%, and trucking up 43.8% since December 2019.
- US ecommerce order volume is up 120% since 2019 while the retail inventories-to-sales ratio fell 11.6%, meaning brands are running far more volume on a thinner inventory cushion, exactly where a stockout costs the most.
If you run an ecommerce brand, July 2026 is the month the supply chain trade press stopped hedging on "always-on" replenishment and started calling it the standard. That matters because most of the coverage names the shift without pricing it, and the number that actually decides whether you should chase it, what continuous replenishment costs to build against what it saves, is the part nobody quantifies. What follows is the ledger: what always-on infrastructure actually costs by tier, what the two peer-reviewed studies say it saves, and what to expect next if you're deciding whether this is your year to build it or your year to watch.
What happened
Supply Chain Dive reported on July 16, 2026 that "always-on" supply chains, continuous replenishment run on real-time inventory, order, and shipment data instead of periodic batch cycles, are becoming the industry norm. The piece leans on a Kearney/AWS 2026 study: 67% of organizations started an end-to-end supply chain transformation in the past 12 months, but only 10% hit their top-three targets. The article also points to GE Appliances as an example already running autonomous one-mile hauls with real-time purchase-order, inventory, and shipment visibility.
| What the coverage says (Jul 16, 2026) | Figure |
|---|---|
| News event date | July 16, 2026 |
| Organizations that started a supply chain transformation, past 12 months | 67% |
| Organizations that hit their top-three transformation targets | 10% |
| Named early adopter | GE Appliances (autonomous one-mile hauls, real-time PO/inventory/shipment visibility) |
That 67%-to-10% gap is the real story. Most operators aren't debating whether always-on is directionally right, they're stuck on execution and, underneath that, on cost. Nobody in the trade coverage puts a dollar figure next to the transformation. This post does.
What "always-on" means, and why almost nobody prices it
Periodic replenishment is the model most ecommerce brands still run: you review inventory on a schedule (weekly, biweekly, monthly), forecast demand for the next cycle, and cut a purchase order. It's simple, it's how most 3PL and ERP relationships are structured, and it leaves a gap between when your inventory position actually changes and when your system notices.
Continuous replenishment closes that gap. Real-time point-of-sale, warehouse, and shipment data trigger reorders automatically when inventory crosses a threshold, instead of waiting for the next review cycle. The Kearney/AWS framing treats this as inevitable, and directionally it is: the ecommerce volume growth and margin pressure below make the case for it. But "inevitable" and "worth building right now for your brand" are different questions, and the second one is a cost-and-payback question, not a trend question.
When we talk to founders about this, the pattern is consistent: almost everyone already has an informal version of always-on running in their head, they just haven't priced what it would cost to make it systematic. One operator we've worked with ran biweekly reorders for an entire year specifically to keep inventory lean instead of chasing bulk-order price breaks. It worked, but by his own description it was "a clusterfuck of work," which is exactly the labor cost that software and automation are priced to replace.
What it costs to build: software, integration, and automation capex
Here's the ledger most coverage skips. Continuous replenishment infrastructure comes in three tiers, and the jump between them is steep.
Cloud WMS software is the entry point. SMB-tier platforms run $100 to $500 per user per month; mid-market platforms run $500 to $1,000. On-premise license models range from $2,500 to $20,000 per facility at the low end up to $200,000 at the advanced end. Layer in implementation and integration ($3,500 to $40,000) and training ($5,000 to $50,000), and a full first-year build for a mid-sized DC lands between $50,000 and $2M or more. Tier-1 enterprise suites (Blue Yonder, SAP IBP, Kinaxis, o9) start around $100,000 per year per module, and most real deployments run several modules.
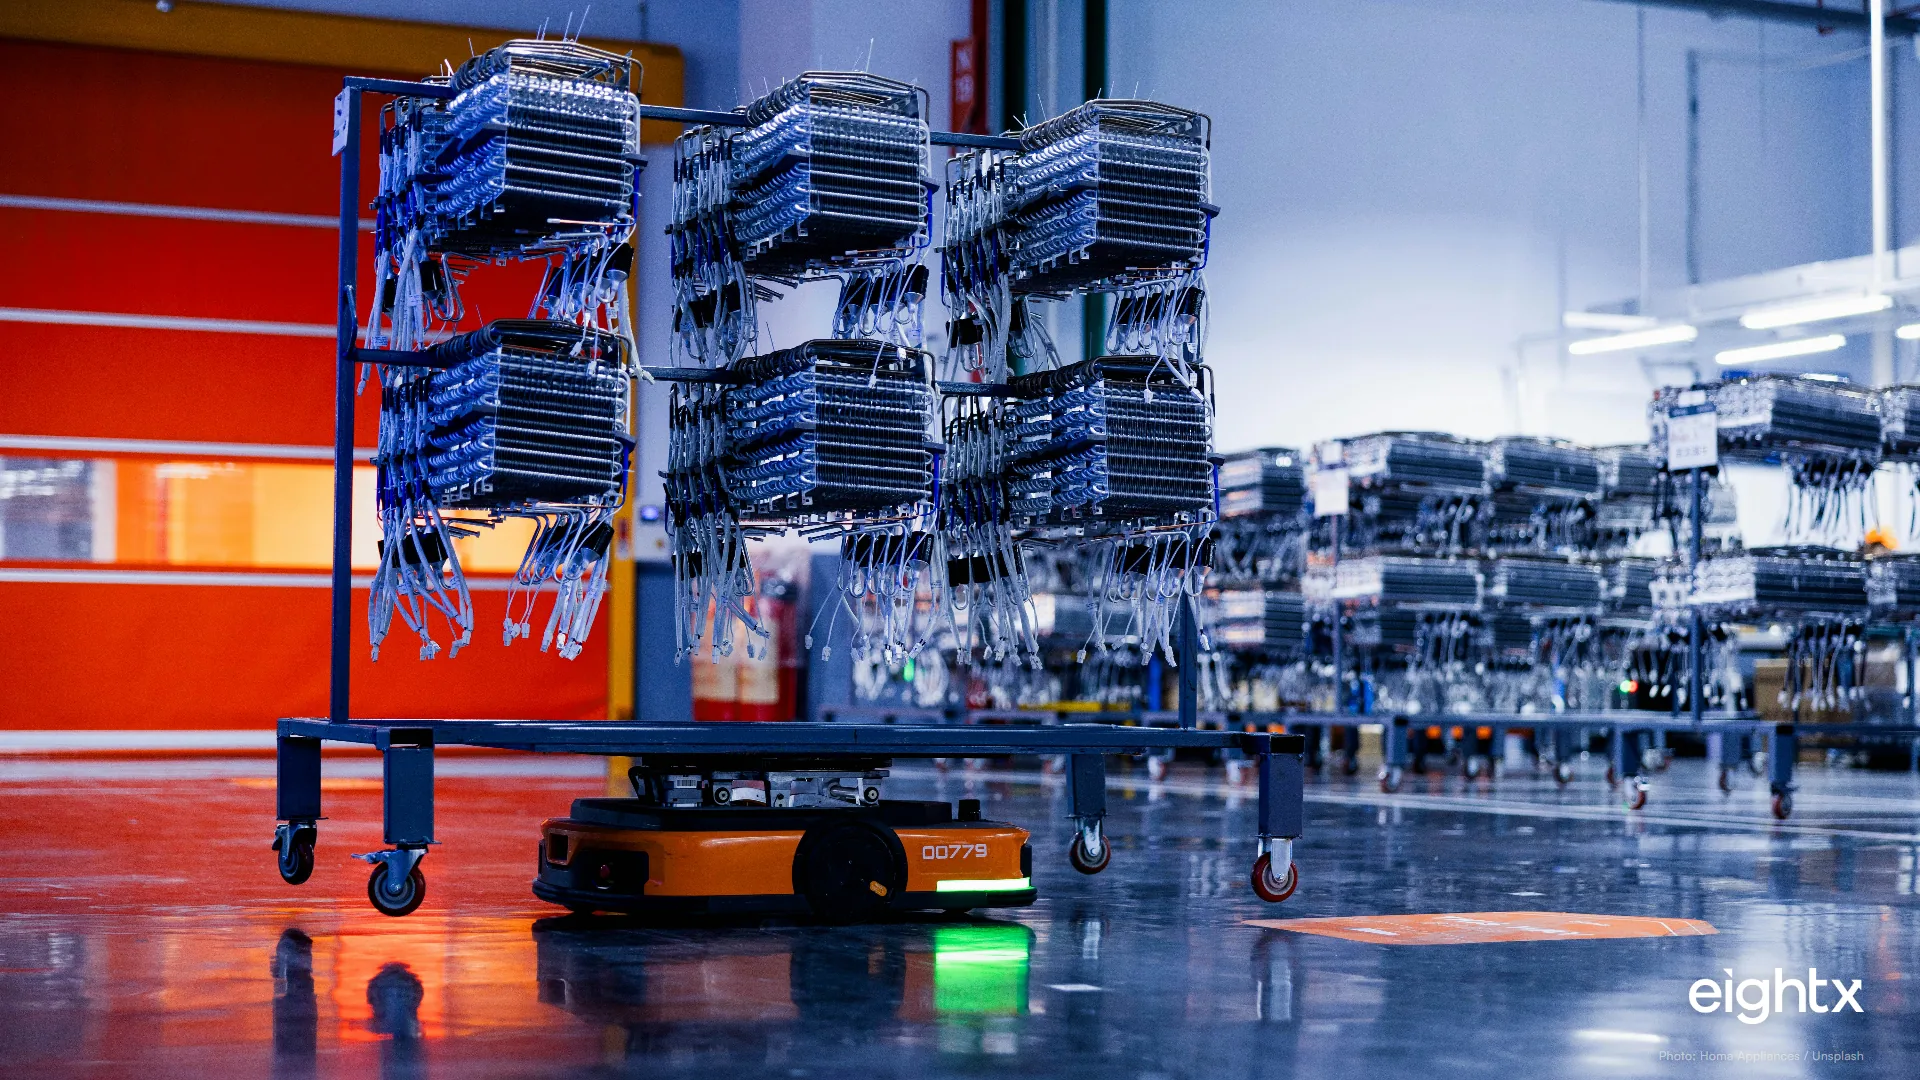
Warehouse automation is the second tier, and where the real capex lives. Goods-to-person robotics (the AutoStore-class category) runs about $1M for an entry-level small-retail install, $3M to $6M for a typical mid-market deployment, and $50M or more for a large multi-national distribution center. Walmart's automation partner, Symbotic, is deployed across all 42 of Walmart's US Regional Distribution Centers, though neither company discloses the dollar figure. Vendors quote 2-3 year payback, labor savings above 50%, and uptime around 99.7% for the automation tier, though that's vendor-reported, not independently audited.
| Category | Tier / example | Cost |
|---|---|---|
| WMS software (cloud) | SMB tier | $100-$500/user/month |
| WMS software (cloud) | Mid-market tier | $500-$1,000/user/month |
| WMS software (on-prem license) | Limited | $2,500-$20,000/facility |
| WMS software (on-prem license) | Advanced | $20,000-$200,000/facility |
| Implementation / integration | Typical benchmark | $3,500-$40,000 |
| First-year all-in (mid-sized DC) | License + integration + training | $50,000-$2,000,000+ |
| Tier-1 enterprise suite (Blue Yonder / SAP IBP / Kinaxis / o9) | Per module | ~$100,000/year, more with multiple modules |
| Warehouse automation (AutoStore-class robotics) | Entry / small retail | $1,000,000 |
| Warehouse automation (AutoStore-class robotics) | Mid-market (typical) | $3,000,000-$6,000,000 |
| Warehouse automation (AutoStore-class robotics) | Large multi-national DC | $50,000,000+ |
The vendor pricing above carries an obvious bias: it comes from cost guides the vendors themselves publish, not an independent analyst benchmark. Treat it as a directional planning range, not a quote.
Founders we work with on ERP or WMS implementations describe a cost the vendor pricing pages leave out entirely: at a certain size, you need a dedicated analyst just to run the implementation, and that headcount cost is what actually makes or breaks the ROI case, not the license fee on the pricing page.
Returns are quietly eating your margin. See by how much.
Get our Real Cost of Returns calculator: plug in your numbers, see the true hit per return.
Check your inbox. We'll send the Real Cost of Returns calculator shortly.
Why staying periodic is getting more expensive too
The chart above is the "why now" argument. Even brands that don't upgrade to continuous replenishment are paying more every year to run the periodic model they already have. BLS producer price data shows general freight trucking up 43.8%, warehousing and storage up 44.5%, and couriers and parcel delivery up 64.5% since December 2019 (latest available point: June 2026).
That's not a one-quarter spike. It's seven years of compounding. Parcel delivery, the cost line every DTC brand feels directly on every outbound order, has climbed the fastest. For an operator running the old model, the "do nothing" option isn't actually free. It's a fulfillment cost stack that keeps climbing regardless of what you do, which changes the payback math on the automation tier above: the baseline you're comparing against is getting worse every year, not staying flat.
If you're negotiating your own 3PL contract against this backdrop, our breakdown of all-in 3PL cost per order walks through where these producer-price increases actually show up on your invoice.
The volume math: twice the orders, a thinner cushion
The second half of the "why now" case is volume, and it's the more urgent half. US ecommerce order volume (Census NAICS 4541, electronic shopping and mail-order houses) more than doubled since 2019, up 120% from $55.7 billion in December 2019 to $122.5 billion in December 2025. Over the same window, the retail inventories-to-sales ratio fell 11.6%, from 1.46 to 1.29.
Brands are moving far more volume against a thinner inventory buffer relative to sales. That's exactly the operating condition continuous replenishment is built for, and exactly where a stockout or a demand-sensing miss costs the most. The 2020-2021 dip and rebound in the ratio reflects the COVID demand shock specifically, not a clean trend, but the multi-year direction since is unambiguous: less cushion, more volume.
The labor side of this tells the same story. Warehousing employment fell 3.3% from 2019 to 2025 (1,516,900 to 1,467,200 jobs) even as order volume roughly doubled, while average warehouse wages rose 28.8% ($25.77 to $33.20 an hour).
| Year | Warehousing employment (000s, Dec) | Avg. hourly wage (warehousing) | Ecommerce retail sales ($M SA, Dec) |
|---|---|---|---|
| 2019 | 1,516.9 | $25.77 | $55,679 |
| 2021 | 1,546.5 | $27.89 | $87,257 |
| 2023 | 1,535.5 | $30.89 | $107,076 |
| 2025 | 1,467.2 | $33.20 | $122,467 |
Fewer, more expensive warehouse workers are handling roughly double the order volume. That's a direct argument for the automation capex above, not against it: the labor pool this work depends on is shrinking while its price climbs, and public capital is already following that trend. Manhattan Associates, the WMS and order-management software vendor, grew revenue 84.4% and R&D spend 72.2% from FY2020 to FY2025. Symbotic grew revenue 90.9% in just two years, FY2023 to FY2025. Those are audited 10-K numbers, and they're the clearest public signal of how much capital is actually flowing into always-on infrastructure.
The payoff: what continuous replenishment actually saves
This is where the evidence quality matters, and it's worth being explicit about which figures are strongest. Two peer-reviewed operations-research studies compared continuous review against periodic review directly. Parsa et al. (2017), modeling a healthcare manufacturer-distributor relationship, found continuous replenishment cut total supply chain cost by 19.1%. Rizkya et al. (2018), modeling an automotive-component plant, found a 53.89% reduction in total inventory cost. Both are simulated/modeled results published in peer-reviewed venues, not audited company financials, which makes them the most independent evidence in this ledger, stronger than a vendor case study, weaker than an audited disclosure.
| Source | Finding | Evidence type |
|---|---|---|
| Parsa et al. 2017 (healthcare distributor model) | 19.1% lower total supply chain cost vs. periodic review | Peer-reviewed / modeled |
| Rizkya et al. 2018 (automotive component plant) | 53.89% lower total inventory cost vs. periodic review | Peer-reviewed / modeled |
| Target, Q1 2026 | Inventory turns up ~10% YoY; $30M+/year saved on last-mile via sortation centers | Company-disclosed (earnings call, fact sheet) |
| Matas (RELEX case study) | +15% inventory turnover after deploying continuous replenishment software | Vendor case study |
| AutoStore-class automation (Kardex benchmark) | >50% labor savings; 2-3 year payback; 99.7% uptime | Vendor benchmark |
Real operators back the direction, if not the exact percentages. Target reported inventory turns up roughly 10% year-over-year in Q1 2026 and says it saves more than $30M a year on last-mile delivery through its sortation-center network. Matas, a Danish health and beauty retailer, increased inventory turnover 15% after deploying RELEX replenishment software. One widely-cited figure worth a caveat: the Walmart-P&G continuous replenishment partnership's often-quoted ~30% inventory reduction and $20B-plus cumulative sales figures are secondary, widely-cited numbers, not confirmed from a primary audited release, so lead with the two peer-reviewed studies above if you need a defensible number, not the Walmart-P&G folklore.
For a sense of where your own brand sits before you model any of this, our benchmark on average inventory days by vertical is a faster starting point than building a full continuous-replenishment business case from scratch.
Which operator profiles should actually make the investment
Not every brand clears the bar, and the operators we talk to already run an informal version of this filter without realizing it. Most rank SKUs A, B, and C by volume and margin: C-tier stays drop-shipped, B-tier carries roughly eight weeks of inventory, A-tier carries roughly twelve. That's the same logic that should decide whether you invest in continuous-replenishment infrastructure at all, or just for your top SKUs.
Clear yes: high-velocity, stable-demand categories with standard SKUs and a real cost to stocking out, grocery-adjacent and fast-moving consumer staples, national multi-channel operators, brands where a stockout on a hero SKU is a measurable revenue hit, not a shrug. These are the profiles where the 19.1%-53.89% savings range and the 2-3 year automation payback both have room to actually clear.
Better off periodic, for now: long-tail catalogs, heavily promotion-driven demand, seasonal or launch-driven SKUs, or brands whose sales data is still fragmented across channels. Vendor managed inventory in these categories, per the grocery-sector precedent, tends to show inventory reductions in the 20-50% range under the best conditions, but the "best conditions" part is doing a lot of work: it assumes clean, real-time demand signal, which fragmented-data operators don't have yet. Fix the forecasting and data layer first; the infrastructure spend only pays back once the signal underneath it is trustworthy.
We've seen brands carrying 250 or more days of inventory, nearly a year of cash locked on the shelf, because they had no real-time signal for when to reorder. That's the cost that never shows up on a "what does the software cost" spreadsheet, and it's the strongest argument for at least the A-tier SKU version of this investment even at brands that aren't ready for the full build. If that cash-conversion math is where you're stuck, our cash conversion cycle benchmarks for DTC brands and our safety stock and reorder-point framework are the two places to start before you price out a WMS.
The trade press treats "always-on" as inevitable, and directionally it is. But inevitable and worth building right now for your specific SKU mix and cash position are two different questions. The ledger says $50,000 to $2M-plus for software, $1M to $50M-plus if you add automation, against savings in the 19-54% range from the two studies with the least commercial bias behind them. Run your own SKU velocity and stockout cost against that range before you sign anything.
What we're watching next
Three things to watch as this plays out over the rest of 2026. First, whether the 67%-to-10% transformation-success gap Kearney and AWS flagged narrows as more vendors publish independent (non-vendor) ROI studies rather than self-reported ones. Second, the next BLS PPI release, due in August, which will show whether the parcel/warehousing cost climb documented above is still accelerating or starting to plateau. Third, Q2 2026 earnings season through August, where we expect Manhattan Associates and Symbotic to report whether the always-on infrastructure spending trend documented in their FY2025 filings is continuing into 2026 at the same pace.
If you want help running your own brand's numbers against this ledger, that's the work a fractional CFO for ecommerce does: match the infrastructure spend to your actual SKU velocity and cash position, not the vendor's payback slide.
Sources and methodology
BLS Producer Price Index. Trucking, warehousing, and parcel-delivery cost trends are drawn from the BLS PPI program, series covering general freight trucking, warehousing and storage, and couriers and messengers. Figures are December index values for each full year, with 2026 reflecting the latest available (June) reading.
US Census Bureau Monthly Retail Trade Survey. Ecommerce order volume figures use NAICS 4541, electronic shopping and mail-order houses, seasonally adjusted. This code is a proxy for pure ecommerce volume, not identical to all DTC sales, since it excludes omnichannel retailers' online sales booked under general-merchandise codes. Treat it as directional, not an exact DTC figure.
Federal Reserve Economic Data. The retail inventories-to-sales ratio comes from FRED's RETAILIRSA series, reported as an annual average and as percentage change, not an implied dollar figure.
SEC EDGAR filings. Manhattan Associates and Symbotic revenue and R&D figures are drawn from their audited 10-K filings via SEC EDGAR's full-text search. Both companies are enterprise and mega-retailer-scale vendors, used here as public-market proxies for capital flowing into always-on infrastructure, not as evidence of what any individual DTC brand spends.
Peer-reviewed operations research. The two continuous-replenishment-versus-periodic-review comparisons are Parsa, Rossetti, Zhang and Pohl (2017), International Journal of Production Economics and Rizkya et al. (2018), IOP Conference Series: Materials Science and Engineering. Both are simulated/modeled studies, independently peer-reviewed rather than vendor-produced, which is why they anchor the savings range in this post ahead of the vendor and company case studies.
Vendor pricing and case studies. WMS and automation cost tiers are drawn from published cost guides (Descartes, Made4Net, Kardex) and vendor case studies (RELEX/Matas). These carry commercial bias, since the vendors selling the infrastructure also published the cost and savings figures, and are labeled as such throughout rather than presented as independent benchmarks.
Limitations. The Walmart-P&G continuous replenishment partnership's widely-cited ~30% inventory reduction and $20B-plus cumulative sales figures are secondary, widely-cited claims, not confirmed from a primary audited Walmart or P&G release, and are flagged rather than presented as fact. This is a living index: the BLS PPI, Census MRTS, and FRED series here update monthly and this post is scheduled for quarterly refresh; the SEC EDGAR and vendor-pricing sections update on a slower, semiannual cadence.
Frequently asked questions
what does "always-on" supply chain actually mean?
It means continuous, real-time replenishment instead of periodic batch ordering. Instead of placing a purchase order every two or four weeks off a forecast, your systems watch actual sell-through and trigger reorders the moment inventory crosses a threshold, so replenishment runs constantly in the background rather than on a calendar.
how much does it cost to build continuous replenishment infrastructure?
It depends how far you go. Cloud WMS software alone runs $100 to $1,000 per user per month, with a full first-year implementation (license, integration, training) landing between $50,000 and $2M or more. Add warehouse automation like AutoStore-class robotics and the range jumps to $1M for an entry-level install up to $50M or more for a large multi-national distribution center.
is an always-on supply chain worth it for a small ecommerce brand?
Usually not yet, at least not the automation layer. The operators who justify it have high, stable order volume, standard SKUs, and a real cost to stocking out. If you're running long-tail, promotion-driven, or seasonal SKUs on modest volume, a lighter cloud WMS with automated reorder points gets you most of the benefit for a fraction of the capex.
how much does warehouse automation like autostore or robotics cost?
Entry-level goods-to-person robotics installs run about $1 million. A typical mid-market deployment runs $3 million to $6 million, and a large multi-national distribution center can run $50 million or more. Vendors quote 2-3 year payback and labor savings above 50%, though those figures come from vendor benchmarks, not independent audits.
how long does it take to pay back a supply chain automation investment?
Vendor benchmarks put payback at 2 to 3 years for warehouse automation, driven mostly by labor savings above 50% and higher uptime. Software-only implementations (WMS, no robotics) tend to pay back faster, often inside a year, because the capex is a fraction of the size.
does warehouse automation actually cut labor costs?
The vendor claim is yes, north of 50%, and the macro data is at least consistent with that direction. Warehousing employment fell 3.3% from 2019 to 2025 even as ecommerce order volume roughly doubled and average warehouse wages rose 28.8%. Fewer, more expensive workers are handling far more volume, which is exactly the labor math automation is priced to fix.
which brands actually need always-on replenishment vs. staying periodic?
High-velocity, stable-demand brands with standard SKUs and a high cost of stocking out (grocery-adjacent, national multi-channel, fast-moving staples) get the clearest payoff. Brands with long-tail catalogs, heavy promotional swings, or fragmented sales data are usually better off staying periodic and fixing forecasting first, not infrastructure.