
Insights
Average CPG landed cost per unit by vertical (2026): the tariff stack now eats 30 to 45% of FOB
For China-origin goods in 2026, the combined tariff stack (MFN plus Section 301 plus Section 122) now consumes 21.5% of FOB cost in beauty and up to 45% in food and beverage. Total landed cost per unit has risen significantly across all verticals. If your pricing model was built on pre-2024 duty rates, your contribution margin calculation is likely stale and needs a full landed-cost rebuild.
Key Takeaways
- The duty stack, not ocean freight, is now the biggest non-FOB line in your landed cost. A $8 FOB China-origin apparel unit carries $2.84 in duties (MFN + Section 301 + Section 122) versus $0.72 in total ocean, drayage, broker, QC, and last-mile combined. Duty is 3.9x per-unit logistics.
- Duty as a percent of FOB ranges from 21.5% (beauty/skincare) to 45% (shelf-stable food and beverage) for China-origin SKUs in 2026. Supplements (43%), home goods (41%), and footwear (37.5%) sit in between. Electronics is 35%, all of it Section 301 plus Section 122 (the MFN rate is 0 on most HTS 85 lines).
- Section 122 (the 10% global ad valorem) is scheduled to sunset 2026-07-24 absent further executive or legislative action. That single line item is the biggest near-term variable in every importer's landed-cost model. Plan two scenarios, not one.
- BLS Import Price Indexes confirm the pain is 100% tariff, not supplier pricing. The China-Apparel sub-index (COCHNZ315) sat at 104.8 in April 2026, only +2.5% YoY. The China-Electronics sub-index (COCHNZ334) is at 78.3, still 22% below its 2012 baseline. The all-imports index (EIUIR) is up 5.9% over 27 months. None of that explains a 35 to 45% duty stack.
- What to do this quarter: re-classify your HTS at 10 digits, push for FOB concessions, model 70/30 base-stretch pricing, and run a non-China origin pilot. Vietnam and Mexico drop the Section 301 component and keep MFN plus Section 122 (through July 24), netting roughly 15 to 25% lower landed cost on most CPG verticals.
We get asked the same question in every brand-side CFO call we run in 2026: what is the actual landed cost per unit on my China-origin SKU, and how do I model it forward when half the duty stack is scheduled to sunset in July? This piece is the working answer. It pulls together the duty math (Section 301 plus Section 122 plus the underlying MFN rate per HTS chapter), the per-unit logistics (ocean plus drayage plus broker plus QC plus last-mile to your 3PL), and the BLS Import Price Indexes that confirm where the cost actually comes from. We refresh it quarterly when BLS publishes the next import-price release.
What "landed cost per unit" actually includes in 2026
Landed cost per unit is the all-in cost to get a single SKU from your supplier's loading dock to your 3PL's receiving dock, divided by the number of units. The line items are: FOB price paid to the factory, ocean freight (and marine insurance), customs duties (MFN plus any trade-action stacks), customs broker plus ISF fee, drayage plus chassis plus terminal charges, AQL inspection, last-mile from port to 3PL, and 3PL container-receiving plus per-pallet handling. The 3PL line is the one operators most often forget. It does not show on the freight invoice and does not show on the customs entry. It can add $0.05 to $0.20 per unit depending on cube.
Two technical points matter for the duty math. First, US customs duty is generally assessed on the FOB transaction value, not on CIF. So freight and insurance sit outside the duty base. Second, MFN (Most Favored Nation) is the underlying ad-valorem rate published in the USITC Harmonized Tariff Schedule for the SKU's HTS chapter. The Section 301 China-specific tariff stacks on top of MFN at 7.5% (List 4A) or 25% (Lists 1 to 3). Section 122 (the 10% global ad valorem) currently stacks on top of both. All three rates apply to the same duty base (FOB value). They are additive.
The duty stack is now the biggest line in your landed cost
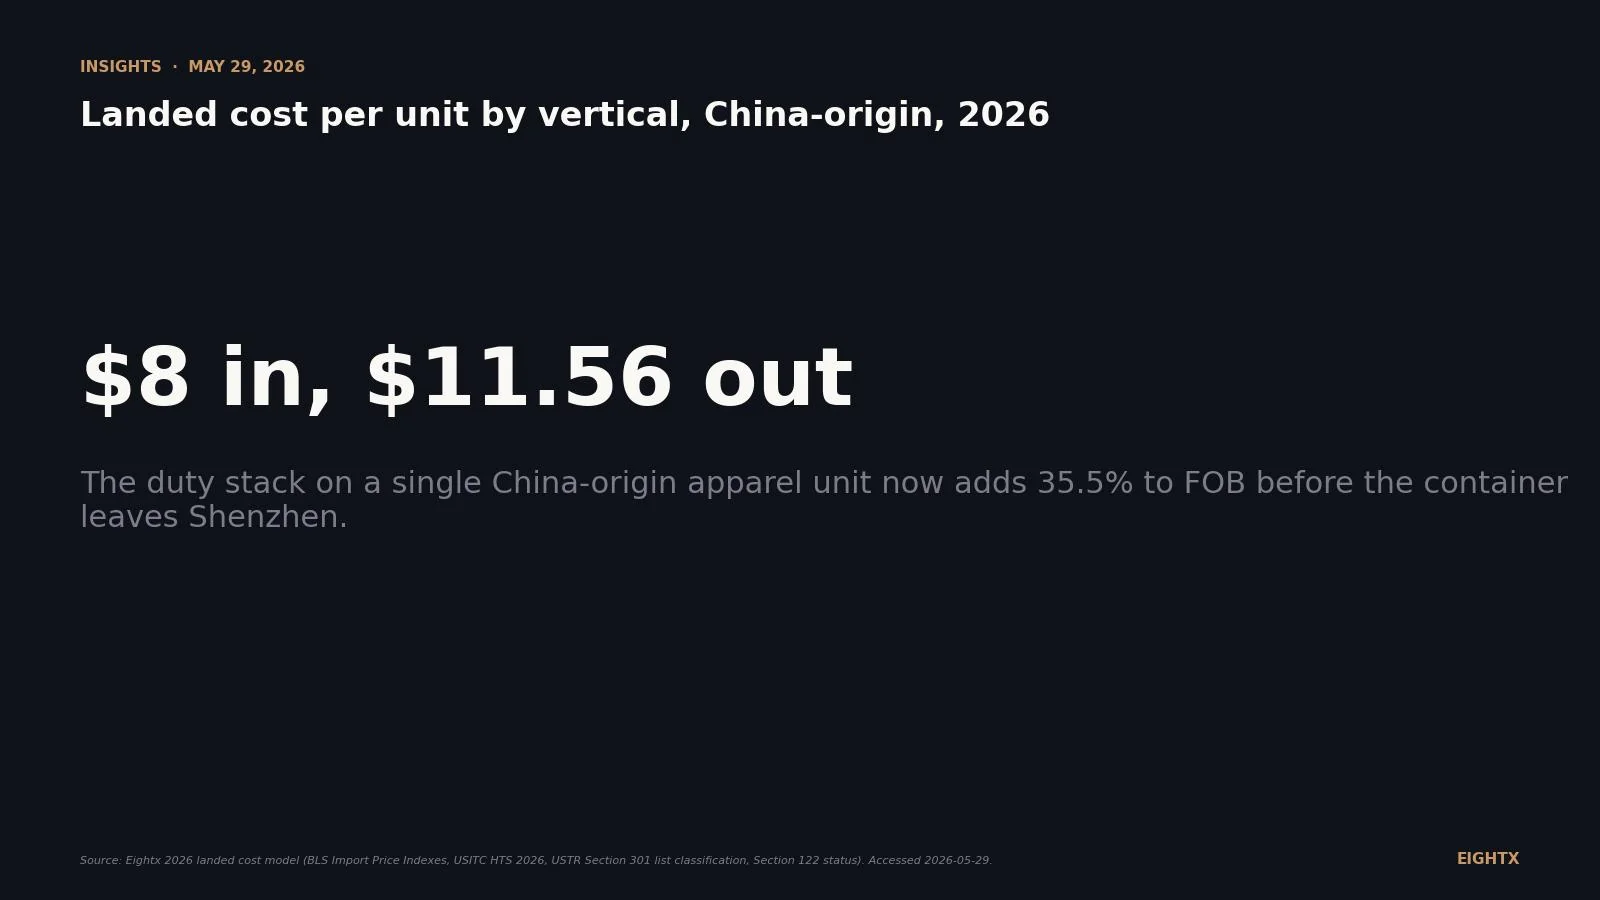
For most CPG verticals in 2026, the duty stack is multiple times bigger than ocean freight per unit. A $8 FOB apparel hoodie ships from China in an 8,000 to 12,000-unit FEU. At a Flexport-typical $4,000 to $6,000 per FEU all-in for China to US West Coast, that is around $0.50 per unit in ocean and insurance. Add drayage, broker, ISF, AQL, and last-mile and per-unit non-duty logistics totals roughly $0.72 ($0.50 ocean + $0.22 broker, drayage, QC, and last-mile, as shown in Table A). Duty on the same unit is MFN around 18%, Section 301 List 4A 7.5%, and Section 122 10%, totaling 35.5% of $8 FOB, or $2.84 per unit. Duty is 3.9x total per-unit logistics.
The pattern is consistent across every vertical we track. Supplements (HTS 21 plus 30) face MFN 8% plus Section 301 List 3 25% plus Section 122 10%, a 43% duty stack. Shelf-stable food and beverage (HTS 16 to 22) hits 45% (MFN 10% plus 25% plus 10%). Home goods (HTS 94, small organizers and the like) lands at 41%. Footwear (HTS 64) at 37.5%. Electronics (HTS 85) at 35%, all of which is Section 301 plus Section 122 because the MFN rate is 0 on most HTS 85 lines. The only vertical that escapes the 35%-plus stack is beauty and skincare (HTS 33), which carries low MFN (0 to 6.5%) and sits on Section 301 List 4A at 7.5%, giving a total stack of 21.5% on a typical SKU.
Landed cost per unit by vertical, China-origin (the table)
The chart below shows the per-unit cost build by vertical: FOB, ocean and drayage, duties, and broker plus QC plus last-mile. Duty is the dark band in every row. These figures are Eightx's working model combining real BLS Import Price Indexes, the USITC HTS schedule, and Flexport-typical FEU bands. They are not a published vendor or BLS benchmark; use them as a directional reference and re-run the math against your own 10-digit HTS classification and FOB.
The table beneath shows the line-by-line build, including MFN, Section 301, Section 122, and total duty per unit.
Vertical HTS chapter FOB ($/unit) Ocean+ins ($/unit) MFN duty (%) Sec 301 (%) Sec 122 (%) Duty total ($/unit) Broker+drayage+QC+last-mile ($/unit) Landed ($/unit) Landed as % of FOB Apparel (hoodie) 61/62 $8.00 $0.50 18% 7.5% 10% $2.84 $0.22 $11.56 144% Footwear (sneaker) 64 $12.00 $0.80 20% 7.5% 10% $4.50 $0.28 $17.58 147% Beauty (50ml serum) 33 $3.00 $0.35 4% 7.5% 10% $0.65 $0.17 $4.17 139% Supplements (60-ct) 21/30 $2.50 $0.30 8% 25% 10% $1.08 $0.17 $4.05 162% F&B (shelf-stable snack) 16-22 $2.50 $0.40 10% 25% 10% $1.13 $0.21 $4.24 170% Home goods (organizer) 94 $10.00 $1.20 6% 25% 10% $4.10 $0.38 $15.68 157% Electronics (small device) 85 $30.00 $0.80 0% 25% 10% $10.50 $0.26 $41.56 139%
A mid-market DTC operator we ran a tariff-modeling call with in Q1 2025 walked through this exact stack on their actual P&L. The point of the exercise was not to publish a single landed-cost number for the brand; it was to show how the duty pass-through (or absorption) would compress contribution margin under three pricing scenarios. The model is necessary but not sufficient. Whether you pass the cost through or absorb it changes consumer behavior, not just COGS.
What BLS Import Price Indexes are telling us about 2026
If you only read the headline import-price data, you would conclude that costs are rising slowly and the tariff narrative is overblown. The headline BLS All-Imports index (EIUIR) sat at 147.6 in April 2026, up 5.9% from 139.4 in January 2024. That is a 27-month run, so the implied annualized rate is around 2.5%. Nothing dramatic.
Underneath that headline, the sub-indices tell a more useful story.
The China-Apparel Manufacturing sub-index (COCHNZ315) is the one to watch. It fell from 107.0 in January 2025 to 98.9 in June 2025 (suppliers eating cost during the tariff-shock period) and has rebounded sharply to 104.8 in April 2026, +4.5% in four months. Apparel suppliers have started passing cost through, ahead of any other major China-origin vertical.
The China-Electronics Manufacturing sub-index (COCHNZ334) tells the opposite story. It sits at 78.3 in April 2026, still 22% below its June 2012 baseline of 100. Electronics suppliers continue to absorb cost at the FOB level. The entire 35% landed-cost stack on an electronics importer is duty, not supplier price.
The most useful series for benchmarking against your own SKU economics is the consumer-goods-ex-autos sub-index (EIUIR4), which sat at 111.0 in April 2026 versus 110.6 in April 2024. That is +0.36% year-over-year. If your supplier is asking for more than a low single-digit increase in 2026, the BLS data does not back it up.
Series Definition Apr 2024 Apr 2025 Apr 2026 YoY change (Apr 2025 to Apr 2026) EIUIR All Imports 141.7 141.7 147.6 +4.2% EIUIR4 Consumer goods ex-autos 110.8 109.8 111.0 +1.1% CHNTOT China, All Imports 100.5 98.5 98.8 +0.3% COCHNZ315 China, Apparel Mfg 106.7 102.2 104.8 +2.5% COCHNZ334 China, Computer & Electronic Products 81.1 77.6 78.3 +0.9% COCHNZ325 China, Chemical Mfg 113.7 113.4 111.9 -1.3%
The pain in your landed cost is 100% tariff, not supplier price. The headline BLS data shows China-origin FOB prices essentially flat over 22 years. The 35 to 45% duty stack is the entire story. If your landed-cost model still leads with ocean freight, it is out of date.
The Section 122 sunset question (and what to do before July 24)
Section 122 (the 10% global ad-valorem tariff) is scheduled to sunset 2026-07-24 absent further executive or legislative action. That single line item is the biggest near-term variable in every importer's model. Baker Botts and UHY Advisors both frame the renewal probability as roughly 50/50. Nobody knows.
The mistake we see operators make is picking a side. Plan both scenarios and pre-commit your response to each.
Scenario A (sunset confirmed by July 24): the duty stack drops 10 percentage points across every vertical. Apparel goes from 35.5% to 25.5%, supplements from 43% to 33%, electronics from 35% to 25%. Your landed cost per unit on the $8 FOB apparel hoodie drops from $11.56 to $10.76 (a $0.80 per unit improvement). The right move is to pre-commit a Q3 price test or a Q4 promotional reset that captures some of the relief without giving it all to consumers.
Scenario B (extension or replacement): the 10% stays. Your H2 2026 landed-cost model is essentially the H1 model, plus or minus any apparel-supplier pass-through. The right move is to pre-commit a Q3 supplier negotiation cycle and a Q4 non-China origin pilot.
The honest read is that the binary timing creates an opportunity. Brands that pre-build both scenarios will move faster than the ones who wait for the July 23 headline.
What to do this quarter if you import from China
Four concrete moves we run with brands on weekly senior-partner calls right now.
Re-classify your HTS at 10 digits. Chapter-midpoint MFN rates (the ones we use in this piece) are illustrative. Real-world duty depends on the 10-digit HTS code for each specific SKU. The difference between two HTS classifications inside the same chapter can be 4 to 8 percentage points of duty. A licensed customs broker can re-run your top-20-SKU classification list for a few thousand dollars. The payback on a single re-classified SKU often covers the engagement.
Push for FOB concessions. The BLS China sub-indices show suppliers absorbing cost. Use that as your opening data point in the renegotiation. The China-Electronics index is 22% below its 2012 baseline. The China-Chemicals index is down 1.3% year-over-year. If your supplier is asking for an increase, ask them which sub-index they are pricing against and why their move is bigger.
Model 70/30 base/stretch pricing. Build your H2 pricing plan as a 70% commit at a base ASP and a 30% reserve at a stretch ASP that you only deploy if Section 122 extends. The base scenario lets you move now. The stretch is your hedge.
Run a non-China origin pilot on one SKU. Vietnam and Mexico drop the Section 301 component (the largest single line on most stacks) and retain MFN plus Section 122 (through July 24). Net landed cost typically drops 15 to 25% versus China on the same SKU. The trade-off is longer onboarding and higher minimums. Pilot on one SKU before you re-route the catalog.
For more on how the duty stack flows through to the P&L and what it means for pricing power, see our coverage of the Amazon tariff refund lawsuit and ecom implications and our apparel CPI vs DTC pricing-power analysis. For ongoing CFO support on landed-cost modeling and supplier negotiation, our interim CFO services team runs weekly cost-of-goods-sold calls with brands going through exactly this exercise.
Sources and methodology
BLS Import/Export Price Indexes (MXP program). All import-price series were pulled directly via the BLS public API and cross-checked against FRED. Headline series EIUIR (All Imports, base December 2001 equals 100) sat at 147.6 in April 2026. Sub-series EIUIR4 (Consumer goods ex-autos) sat at 111.0. China-origin sub-series include COCHNZ315 (Apparel Manufacturing, base June 2012 equals 100) at 104.8, COCHNZ334 (Computer and Electronic Product Manufacturing) at 78.3, COCHNZ325 (Chemical Manufacturing) at 111.9, and CHNTOT (China All Imports, base December 2003 equals 100) at 98.8. All series are monthly NSA, published with a roughly six-week lag.
Tariff schedule (2026). Section 122 (10% global ad valorem) is currently in force across most imports and is scheduled to sunset 2026-07-24 absent further action, per the Baker Botts Tariff Tracker (May 2026 update) and the UHY Advisors business-leader brief. Section 301 China tariffs remain in force after the IEEPA ruling, with working rates of approximately 25% on Lists 1 to 3 (covered electronics, industrial, and consumer goods) and 7.5% on List 4A (covered consumer goods including apparel and footwear), per USTR list classification. MFN duty bands by HTS chapter were taken from USITC HTS 2026 Revision 8: apparel HTS 61/62 commonly 16 to 32%, beauty HTS 33 commonly 0 to 6.5%, supplements HTS 21 commonly 5 to 10% (HTS 30 often duty-free), F&B HTS 16 to 22 generally 0 to 20% plus, home HTS 94 commonly 0 to 6%, electronics HTS 85 commonly 0 to 2%, footwear HTS 64 commonly 10 to 37.5% depending on material.
Per-unit logistics assumptions. Ocean per FEU assumes a Flexport-typical mid-band of $4,000 to $6,000 for China to US West Coast FCL in 2026. Units per FEU assume 8,000 to 12,000 for small CPG SKUs (apparel folded, beauty, supplements, F&B, small electronics) and 3,000 to 5,000 for bulky home goods. Drayage plus chassis plus terminal is $800 to $1,400 per FEU. Customs broker plus ISF is $100 to $200 per shipment. AQL inspection is $200 to $400 per shipment. Last-mile from port to 3PL (if separate from drayage) is $300 to $700 per shipment. Per-unit figures in the table assume the mid-band of each range.
Limitations. No public dataset publishes "average landed cost per unit by vertical." This is a working model that combines real BLS Import Price Indexes, the real USITC HTS schedule, current Section 301 and 122 status, and Flexport-typical FEU bands (public commentary, not a specific paid index pull). We could not access Flexport's Q1/Q2 2026 lane-level FEU quotes, Drewry WCI weekly numeric readings, or Freightos FBX01 numeric series for May 2026 (all three are paywalled). Public commentary confirms transpacific rates rose roughly 50% from earlier 2026 lows by early May 2026. Real-world landed cost requires 10-digit HTS classification per SKU.
Update cadence. This page is refreshed quarterly when BLS releases the next Import Price Index data. Next update target: August 2026 (Q2 BLS release plus any Section 122 sunset decision).
This piece was researched and authored in line with the bundle at new-blogs/to-be-published/average-cpg-landed-cost-per-unit-by-vertical-2026/research.md.
Frequently asked questions
what is the average landed cost per unit for a dtc apparel brand importing from china in 2026?
Around $11.56 per unit on a $8 FOB hoodie. The build is $8 FOB plus $0.50 ocean and insurance plus $2.84 in duties (MFN around 18%, Section 301 List 4A 7.5%, Section 122 10%) plus $0.22 in broker, drayage, QC, and last-mile. Duty alone is 35.5% of FOB and 3.9x total per-unit logistics ($0.72). Plug your own FOB into the same ratio for a quick estimate.
how much of my landed cost is the duty stack on a china-origin supplement sku in 2026?
About 43% of FOB. On a $2.50 FOB 60-count bottle the build is $0.30 ocean and insurance plus $1.08 in duties (MFN 8%, Section 301 List 3 25%, Section 122 10%) plus $0.17 in broker, drayage, QC, and last-mile. Total landed is $4.05, of which $1.08 is duty and $0.47 is total non-duty logistics. Duty is 2.3x logistics on supplements, a steeper stack than apparel because Section 301 List 3 hits at 25% not 7.5%.
is the section 122 10% tariff really going to expire in july 2026?
It is scheduled to. Section 122 has a statutory sunset of 2026-07-24 absent further executive or legislative action. Public commentary from Baker Botts and UHY Advisors frames the renewal probability as roughly 50/50. The right move is to plan both scenarios. Build your H2 pricing model with and without the 10% line and pre-commit triggers for each.
how do i actually calculate landed cost per sku, is duty on fob or cif?
US customs duty is generally assessed on the transaction value, which is usually FOB plus any assists, royalties, and adjustments under 19 CFR 152. It is not assessed on ocean freight or insurance for US imports (CBP uses FOB-equivalent, not CIF). So your duty base is the price you pay the factory, not the price after freight. Ocean and drayage are added after duty in the landed-cost build.
what is the cheapest cpg vertical to import from china in 2026 by duty rate?
Beauty and skincare. HTS chapter 33 (essential oils, perfumes, cosmetics) carries a low MFN duty band (0 to 6.5%), and most cosmetic SKUs sit on Section 301 List 4A at 7.5% rather than List 3 at 25%. Add Section 122 at 10% and the total duty stack is around 21.5% of FOB. Every other CPG vertical we track sits at 35% or higher.
should i source from vietnam or mexico instead of china to avoid section 301?
It is the cleanest hedge available right now. Vietnam and Mexico origin drops the Section 301 component (which is the largest single line on most stacks) and retains MFN plus Section 122 through 2026-07-24. Net landed cost typically drops 15 to 25% versus China on the same SKU. Watch for the trade-offs: longer onboarding, higher minimums, less established QC infrastructure in some categories.
how have china-origin import prices changed in 2026?
Diverging by vertical. The China-Apparel sub-index rose 4.5% in the first four months of 2026 (from 100.3 in January to 104.8 in April), meaning apparel suppliers have started passing cost through. The China-Electronics sub-index sits at 78.3, still 22% below its 2012 baseline, meaning electronics suppliers are still absorbing. The headline China All-Industries index (CHNTOT) is essentially flat at 98.8.
what is the line item operators forget when they model landed cost?
3PL receiving fees. The per-container receiving charge and per-pallet handling charge from your US 3PL do not appear in any freight quote, do not show on the customs entry, and routinely add $0.05 to $0.20 per unit depending on cube. We see brands underestimate their fully-loaded landed cost by 2 to 4% because the receiving line gets dropped between the freight invoice and the COGS model.