
Insights
Average CPG lead time by vertical, 2026: 78 to 205 days inventory outstanding from 7 public 10-Ks
CPG lead times run 78 to 205 days depending on category, meaning the inventory you order today reflects a demand forecast from six months ago. If your forecast model looks back 90 days, you are always flying partially blind. The operators who win on cash flow are the ones who match their reorder cadence to their actual lead time, not their wishlist.
Key Takeaways
- Public CPG Days Inventory Outstanding (DIO) ranges from 78 days (BellRing supplements) to 205 days (Olaplex prestige beauty) for FY2025. That 127-day gap is the structural lead-time difference between a North American co-packed supplement and a China-sourced retail-channel beauty brand.
- YETI's DIO is the cleanest disclosed pandemic-era round trip. 86 days at FY2020 close, 196 days at the FY2021 peak, 133 days at FY2025 close. If your trajectory does not look like this, you either over-corrected or under-stocked.
- The US total-retail inventory-to-sales ratio is 1.26 in March 2026, still below the 1.46 pre-COVID baseline. Operators benchmarking against pre-2020 textbook numbers are over-stocking by roughly 14%.
- Supplier lead time (the headline number a vendor quotes) is not working-capital lead time. 60-day China-to-door becomes 100 to 200 days of DIO once you layer safety stock, retail-channel buffer, and the cash you tie up in WIP.
- A 30-day PO slip on a $10M brand at 40% gross margin costs you about $493,000 in cash. (Annual COGS divided by 365, times 30.) If your line of credit cannot cover that, your PO cadence outranks your CAC as a cash-risk control.
CPG operators keep asking the wrong question. "What's the lead time for my vertical?" assumes there is a public benchmark for purchase-order-to-receive days by category. There is not. Lead time is a private supplier-contract variable and it never shows up in a 10-K. But the next-best thing does. Days Inventory Outstanding (DIO), the metric that captures the entire working-capital lead time on a company's balance sheet, is disclosed every quarter by every public CPG and DTC brand. We pulled it from 7 public 10-K filings for fiscal year 2025 to give you a real benchmark grid by vertical.
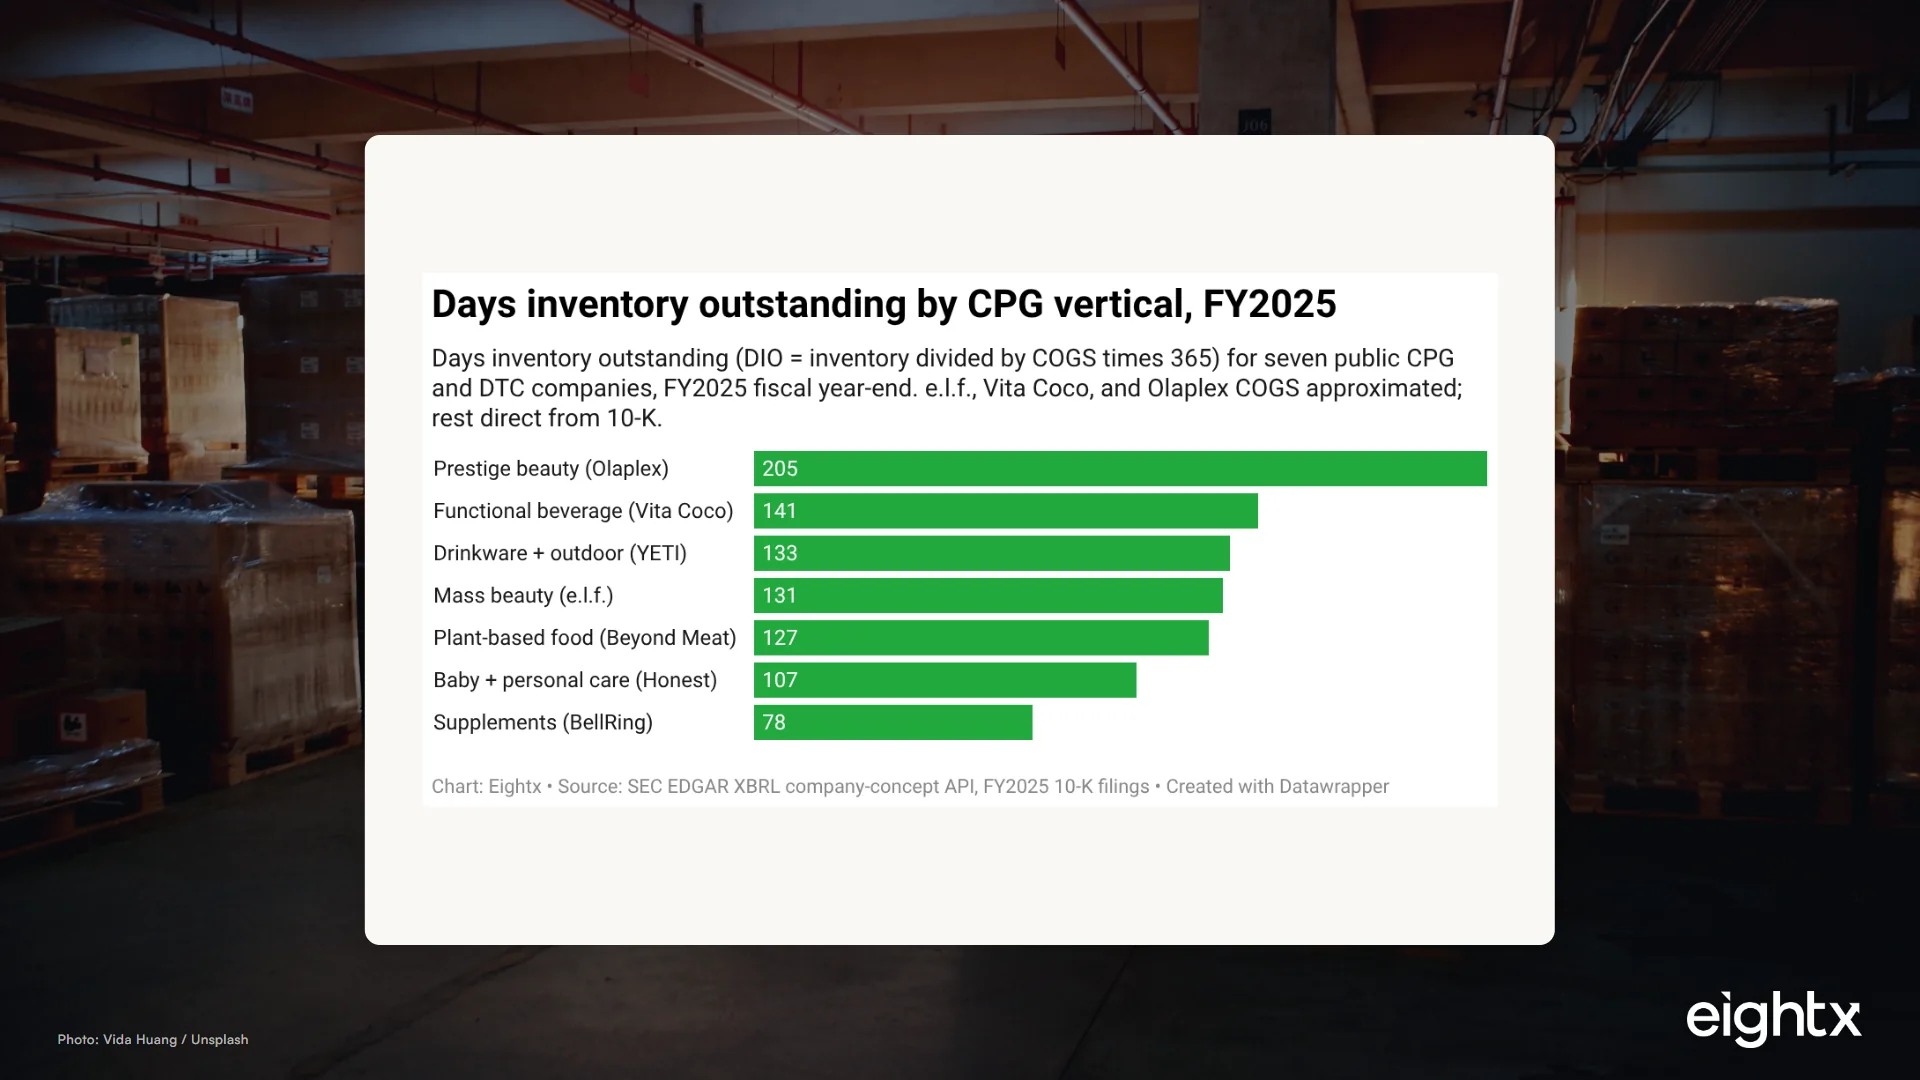
The headline: supplements (BellRing) sit at 78 days. Drinkware (YETI) sits at 133 days. Prestige beauty (Olaplex) sits at 205 days. That 127-day spread is the structural difference between a North American co-pack network and a China-sourced retail-channel beauty business. If you are running a CPG brand at $10M to $150M in revenue, this is the comp band you should be sizing your purchase-order cadence and cash plan against. Read on for the full table, the 5-year YETI trajectory (the cleanest pandemic-era lead-time round trip in public data), and the Census macro you should pair with DIO.
The lead-time question every CPG operator gets wrong
When a freight forwarder tells you "60 days China to door," your brain stores that as the lead time. It is not. That is the transit lead time. The working-capital lead time, the number that actually controls your cash, is two to three times longer.
Here is why. A 60-day transit window means you place a PO today and the container lands at your 3PL on day 60. But the moment you signed the PO, your supplier started buying raw materials, which means your cash exposure started before day 1. Once the container lands, it sits in safety stock until your DTC and retail demand pulls it through. Slow-moving SKUs sit longer. Retailers (if you sell wholesale) require channel buffer they hold on your behalf, but your accounting still treats it as receivable, not sold. Stack all of that up and your realized inventory days, DIO, lands between 78 and 205 depending on the vertical.
The metric to use is DIO, computed as ending inventory divided by trailing-12-month Cost of Goods Sold (COGS), times 365. It is in every 10-K. It is in your QuickBooks. It is the gut-check number that tells you whether your inventory and your demand plan are actually aligned, or whether you are running 60 days of phantom safety stock that your CFO has not flagged yet.
What 7 public CPG 10-Ks tell us about DIO by vertical
We pulled FY2025 inventory and COGS for 7 public CPG and DTC tickers via the SEC EDGAR XBRL company-concept API: BellRing Brands (supplements), Honest Company (baby and personal care), Beyond Meat (plant-based food), e.l.f. Beauty (mass beauty), YETI (drinkware and outdoor), Vita Coco (functional beverage), and Olaplex (prestige beauty). Where the XBRL CostOfRevenue tag was unavailable (e.l.f., Vita Coco, Olaplex use CostOfGoodsAndServicesSold or a custom tag), we approximated COGS from disclosed revenue and gross-margin band and flagged the row as an estimate.
The structural read on the bar chart: BellRing's 78 days is the floor because Premier Protein runs on a North American co-pack network with weekly cadence. Olaplex's roughly 205 days is the ceiling because small high-margin beauty SKUs with retail-channel obligations stock heavy, and Olaplex has been working through an inventory overhang since the 244-day FY2022 peak. YETI sitting at 133 days is the textbook hardgoods-sourced-from-China number for FY2025; pre-COVID it would have been closer to 86. Beverage (Vita Coco, 141 days) sits high because the Asia-to-US ocean lane plus co-packer queues stack up. Mass beauty (e.l.f., 131 days estimate) runs leaner than prestige because the SKU velocity is higher and retail buffer is lighter.
One caveat before you map yourself to these numbers: e.l.f.'s 131 days and Vita Coco's 141 days are running roughly 15 to 20 days hot versus a tariff-neutral baseline because both companies disclosed pre-tariff inventory builds in FY2025 (see the tariff FAQ below). A tariff-neutral steady-state read on mass beauty is closer to 115 days, and on functional beverage closer to 125. Adjust your benchmark accordingly if you are not also pre-building for tariffs.
Company Ticker Vertical FY2025 inventory (USD) FY2025 COGS (USD) DIO (days) BellRing Brands BRBR Supplements $330.4M $1,546.2M 78 Honest Company HNST Baby + personal care $72.5M $247.6M 107 Beyond Meat (est.) BYND Plant-based food $84.0M ~$241M 127 e.l.f. Beauty (est.) ELF Mass beauty $220.2M ~$614M 131 YETI Holdings YETI Drinkware + outdoor $290.6M $795.8M 133 Vita Coco (est.) COCO Functional beverage $111.5M ~$289M 141 Olaplex (est.) OLPX Prestige beauty $60.2M ~$107M 205
The retail inventory-to-sales ratio is the macro you should pair with DIO
DIO tells you what your peers carry on their books. The Census Monthly Retail Trade Survey inventory-to-sales (I/S) ratio tells you what the retail channel as a whole is carrying. Pair them.
The headline reading from FRED series RETAILIRSA for March 2026: total retail I/S sits at 1.26, which is 14% below the 1.46 pre-COVID baseline. That gap matters as a direction-of-travel signal. Retailers (including your wholesale partners if you sell into them) are running structurally leaner than they did before 2020. A buyer at Target or Ulta in 2026 is not stocking the same weeks of cover she was in 2019. Use the 1.26 ratio as a direction-of-travel cross-check on your wholesale forecast (retailers want lower cover than they used to), not as a level benchmark for your brand-level DIO. The retail channel and your brand sit on different scales because the retail channel holds the buffer that brand DIO does not.
Sub-vertical FRED series Pre-COVID baseline (2019) Post-COVID low (2021) Latest (March 2026) Total retail RETAILIRSA 1.46 1.09 1.26 Clothing stores MRTSIR448USS 2.40 1.79 2.09 Furniture + electronics + appliance MRTSIR4423XUSS 1.62 1.28 1.59 General merchandise stores MRTSIR452USS ~1.45 n/a 1.23
Clothing-store I/S sits on its own scale (2.09 in March 2026 versus 2.40 pre-COVID) because apparel runs structurally heavy on stock keeping units. If you are an apparel brand without a public comp in the DIO table above, use the clothing-store I/S as your macro anchor, recognizing that brand-level DIO is typically 60 to 90 days lower than the retail-channel I/S because the channel holds the buffer.
Why YETI tells the most useful lead-time story in public data
YETI Holdings (ticker YETI, CIK 1670592) is the cleanest disclosed lead-time round trip we have. The company sells hardgoods sourced primarily from China, sells through both DTC and wholesale, and has been a public filer since 2018. Its DIO history is the textbook pandemic-era arc.
The trajectory: 86 days at FY2020 year-end. 196 days at FY2021 year-end (the post-COVID peak after YETI front-loaded ocean shipments to insulate against the next supply shock). 163 days at FY2022, 172 days at FY2023, 148 days at FY2024, 133 days at FY2025 close. That is a 63-day unwind from peak to current, the result of rebuilt China-to-LA lanes plus aggressive working-capital management.
If you sell hardgoods sourced from Asia and your DIO trajectory does not look like this, one of two things is true. Either you over-corrected coming out of 2022 and have been running stock-out risk on bestsellers, or you under-corrected and are still sitting on slow-moving inventory at the FY2022 weeks of cover. Use YETI as the trajectory benchmark, not the absolute number. Your business probably runs 20 to 40 days higher than YETI's absolute DIO because YETI has scale advantages on container fill, supplier-managed inventory, and 3PL contracts that a $20M brand does not.
Supplier lead time is the days the freight forwarder quotes. Working-capital lead time is the days your cash sits in inventory. They are not the same number, and the second one is what kills brands.
What this means for your purchase-order rhythm and cash plan
Five things to do this quarter.
Compute your own DIO from QuickBooks. Take ending inventory from your last balance sheet, divide by trailing-12-month COGS from your P+L, multiply by 365. That is your DIO. Do it monthly so you have a trendline, not a snapshot.
Map yourself to the closest public comp. Supplements should be near BellRing's 78. Personal care should be near Honest's 107. Drinkware and outdoor near YETI's 133. Beverage near Vita Coco's 141. Mass beauty near e.l.f.'s 131. Prestige beauty near Olaplex's 205. Add 20 to 40 days for sub-scale (you do not have the container-fill economics public companies have). If you sit more than 30 days above your comp plus the sub-scale adjustment, you have a slow-mover or over-stock problem to diagnose.
Build the macro cross-check into your wholesale forecast. The 1.26 total-retail I/S is 14% lower than pre-COVID. Treat that as a direction-of-travel signal, not a level benchmark for your brand DIO. If your retail partner historically wanted 8 weeks of cover, they probably want 7 now. Ship to the leaner number unless they explicitly ask for more.
Stress-test cash for a 30-day PO slip. Daily COGS equals annual COGS divided by 365. A 30-day slip costs you 30 times daily COGS in unreceived inventory. For a $10M revenue brand at 40% gross margin (so $6M in annual COGS), that is roughly $493,000 of cash exposure. If your line of credit and operating cash together cannot cover it without delaying payroll or ad spend, the PO is your single biggest cash risk.
Set a PO cadence that matches your DIO target. If your target DIO is 120 days and your supplier lead time is 60, you should be placing the next PO at day 60 of the current inventory cycle, not day 90. Late ordering is the mechanical reason brands stock out on bestsellers right as the next demand cycle hits.
If you want help running the DIO math against your actuals and sizing the cash exposure on your next PO cycle, book a call with an Eightx interim CFO or read our companion piece on cash conversion cycle by DTC vertical.
Sources and methodology
SEC EDGAR XBRL company-concept API. We pulled FY2025 InventoryNet and CostOfRevenue values for each ticker via the https://www.sec.gov/edgar endpoint. CIKs used: YETI (0001670592), BellRing (0001772016), Honest (0001530979), Beyond Meat (0001655210), Vita Coco (0001482981), Olaplex (0001868726), e.l.f. (0001600033). All values pulled 2026-05-29. e.l.f., Vita Coco, Olaplex, and Beyond Meat do not report the standard CostOfRevenue tag (they use CostOfGoodsAndServicesSold or a custom extension); for those four we approximated COGS as disclosed revenue times the company's reported gross-margin band and flagged the row as estimate. Verify against the income statement directly before using for board reporting.
US Census Monthly Retail Trade Survey, via FRED. Series IDs used: RETAILIRSA (total retail inventory-to-sales ratio), MRTSIR448USS (clothing stores), MRTSIR4423XUSS (furniture, electronics, appliance stores), MRTSIR452USS (general merchandise stores). All seasonally adjusted, end of period, monthly cadence. Latest observation pulled was March 2026, released by Census on 2026-05-14.
DIO formula. Days Inventory Outstanding equals ending Inventory divided by trailing-12-month Cost of Revenue, times 365. For annual disclosure (10-K), no annualization is required because COGS is already a full-year value. For interim disclosure (10-Q), use trailing-12-month COGS rather than four times quarterly COGS to smooth out seasonal Q4 distortion.
YETI trajectory. The FY2020 baseline (86 days) was computed from the FY2020 10-K inventory of $140.1M divided by FY2020 COGS proxy of $594.9M. The FY2021 peak (196 days) reflects the FY2021 10-K disclosure of $300.8M inventory against $561M COGS, the post-COVID front-loading episode. The FY2025 closing value (133 days) is direct from the FY2025 10-K.
Limitations. Five caveats. (1) DIO is a lagging indicator of supplier lead time, not a direct measurement. The relationship is DIO roughly equals supplier lead time plus safety stock plus retail-channel buffer plus slow-moving SKU drag. (2) Public CPG companies skew larger than typical $10M to $150M DTC brands; smaller operators usually run higher DIO because they lack scale advantages on container fill and supplier-managed inventory. (3) The four COGS estimates (e.l.f., Olaplex, Vita Coco, Beyond Meat) need direct 10-K income-statement verification before being treated as board-grade figures. (4) The FRED retail I/S ratio measures retail-channel inventory, not brand-level inventory; DTC brands selling direct typically run 60 to 90 days lower than the retail-channel I/S. (5) Apparel is conspicuously absent from the public comp set because Allbirds is delisted, Warby Parker has eye-care complications, and Solo Brands has been through multiple restructurings; we cover apparel via the clothing-store I/S ratio rather than forcing a direct comp.
Update cadence. This is a living index, refreshed quarterly. Next update target: August 2026, after Q2 2026 earnings season closes and the next batch of public 10-Q filings is available.
Frequently asked questions
what is the average lead time for a cpg purchase order to land in 2026?
There is no single number. The headline supplier lead time (the days quoted on a PO) is typically 30 to 90 days for North American co-packers and 60 to 120 days for Asia-sourced finished goods. But the working-capital lead time you actually carry on your balance sheet (Days Inventory Outstanding) sits between 78 and 205 days for the seven public CPG verticals we tracked in FY2025. Use DIO, not the PO number, when planning cash.
what is days inventory outstanding and how is it different from supplier lead time?
DIO equals ending inventory divided by trailing-12-month cost of goods sold, times 365. It is the realized number of days your business sits on inventory before selling it. Supplier lead time is the quoted PO-to-receive window. DIO is always longer because it includes safety stock, retail-channel buffer, and slow-moving SKUs. The gap between them is where your cash gets trapped.
why does prestige beauty run higher inventory days than supplements?
Three structural reasons. Beauty SKUs are small and high-margin, so the cash cost of holding them is low and brands stock heavy. Beauty distribution leans on retailers (Sephora, Ulta) that require channel buffer. And contract-manufactured beauty often has minimum order quantities that overshoot true demand. Supplements (BellRing) run a North American co-pack network with rapid turn, which is why FY2025 DIO is 78 days versus Olaplex at roughly 205.
how do i benchmark my own lead time against public cpg companies?
Pull your trailing-12-month COGS from your P+L and divide ending inventory by it, times 365. That is your DIO. Then map your vertical to the closest public comp from the chart: supplements to BellRing (78), personal care to Honest (107), drinkware to YETI (133), beverage to Vita Coco (141), beauty to e.l.f. (131) or Olaplex (205). If you sit more than 30 days above your closest comp, you are either over-stocked or carrying dead inventory.
did 2025-2026 tariffs lengthen cpg lead times?
Indirectly, yes. e.l.f. Beauty's March 2026 inventory was $220 million versus $187 million a year earlier (up 18%), publicly framed as a pre-tariff stocking move. Vita Coco's inventory roughly doubled from $50 million in December 2023 to $111 million in December 2025, partly to insulate against ocean-lane and tariff shocks. Tariffs did not change the physical transit days, but they pushed operators to carry more weeks of cover, which inflates DIO.
what is the right inventory-to-sales ratio for a $10m dtc brand?
Most DTC brands at $10 million revenue run roughly 90 to 140 days of DIO depending on whether they source domestically (lower) or from Asia (higher). Translated to the retail-style I/S ratio, that is about 0.3 to 0.4 months of cover. That is structurally tighter than the 1.26 total-retail ratio because brand-level DTC does not carry the retail-channel buffer Census measures. Benchmark against public CPG DIO, not retail I/S.
how do i stress-test my cash if a po slips 30 days?
Take your annual COGS and divide by 365 to get daily COGS. Multiply that by the slip days. For a $10 million revenue brand at 40% gross margin (so $6 million in annual COGS), 30 days is roughly $493,000 of unreceived inventory you still owe the supplier on. If your line of credit and operating cash combined cannot cover that without delaying payroll or ad spend, the PO is your single biggest cash risk, not your CAC.
should i use yeti's 133-day dio as my drinkware benchmark or chase the 86-day pre-covid number?
The 133-day FY2025 number is the right benchmark. The 86-day FY2020 number was a pre-COVID artifact that almost no hardgoods brand has been able to replicate since because ocean lanes and supplier consolidation lengthened structurally. Aim for 130 to 150 days for drinkware and outdoor hardgoods. If you are below 100 you are running stock-out risk; if you are above 170 you have a slow-mover problem.