
Insights
Average customer lifetime by ecommerce vertical, 2026: months active before churn
Average customer lifetime by ecommerce vertical in 2026 ranges from 6 months for food and beverage to 20 months for supplements. Cross-category, customers remain active 12-19 months, with beauty at 7-13 months and pet at 10-17 months. All verticals experience a universal month-3 churn cliff.
Key Takeaways
- Cross-category average customer lifetime is 11.8-18.9 months in 2026 (midpoint ~15.4 months), derived from a blended 5.3-8.5% monthly churn rate. That headline number hides a 3x category spread, so use it as a sanity check, not a target.
- Supplements, coffee, and household consumables retain longest at 12.5-20 months on monthly billing. Annual prepay pushes supplements into 67-month-equivalent territory (Athletic Greens disclosed 92% 6-month retention on annual cohorts).
- Food and beverage subscriptions retain shortest at 5.6-12.5 months. Meal kits specifically run 6.7-12.5 months. Recipe fatigue plus weekly-frequency overcommit is the structural pattern, not a marketing failure.
- The month-3 cliff is the only universal pattern. 60-70% of subscribers drop between order 1 and order 3 across every category we pulled. If you want to predict your 12-month outcome, monitor month-3 cohort retention, not blended monthly churn.
- Annual prepay extends customer lifetime ~2.5x within every category. 2026 vendor cohort compilations: 28% 12-month retention on annual plans vs 11% on monthly. The trade-off is upfront discount cost vs CAC payback compression.
If you run a $5M to $50M DTC subscription brand, the question you actually need answered is not "what is my LTV" in dollars, it is "how many months do I get to amortize CAC before this customer is gone." That is the months-based version of customer lifetime, and across 2026 published benchmarks the answer ranges from about 6 months for food-and-beverage boxes to 20 months for monthly-billed supplements, with the cross-category average sitting at 12 to 19 months. The number you can use is your category midpoint, not the blended average. The pattern you have to plan around is the month-3 cliff. Both are below.
This is the months-based companion to the dollar-LTV by vertical work we keep updated, and the operator-facing read of the monthly churn benchmarks documented at average subscription churn rate by category. If you want the dollar number, that is the LTV post; this one tells you the time window you get to earn that dollar number back.
What customer lifetime in months actually measures
Customer lifetime in months is the average time a customer stays active (paying or repurchasing) before they churn. For subscription DTC it is approximated by the formula lifetime = 1 / monthly churn rate. So 6% monthly churn implies a 16.7 month lifetime, and 10% monthly churn implies a 10 month lifetime.
That shortcut hides two things. First, the formula assumes constant churn, which is wrong. Real cohorts churn fast early (the month-3 cliff) and slower later. Second, the formula is built for subscription businesses with a contractual billing cycle. For transactional ecommerce (one-shot purchases, no subscribe and save) "customer lifetime" only makes sense for the subset that makes order 2+. We flag that distinction explicitly because most of the published benchmarks (Recharge, Recurly) are subscription-only.
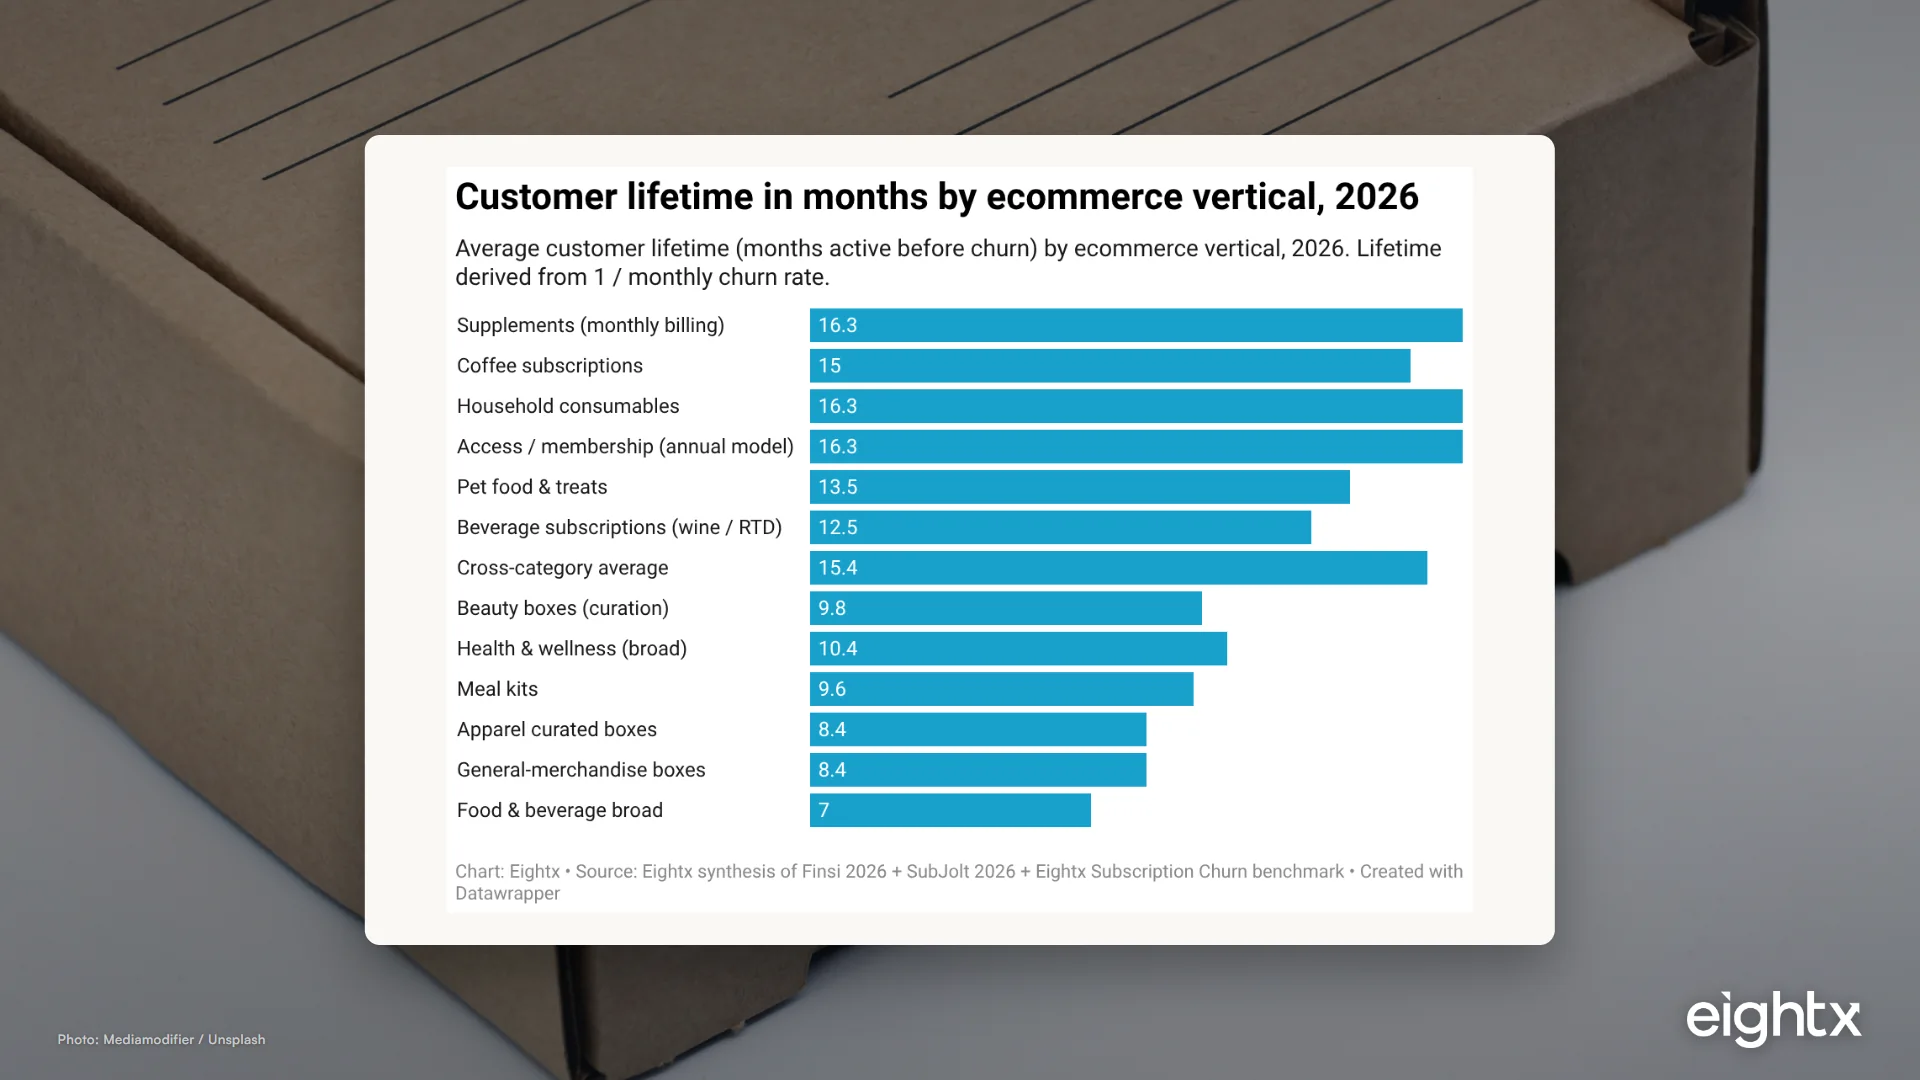
The headline ranking below uses midpoints of the published vertical ranges. The full low-high ranges sit in the table beneath. All rows are monthly-billed subscription unless flagged otherwise; transactional ecommerce (e.g. Chewy Autoship as a non-contractual repeat-purchase behavior) is not directly comparable.
| Vertical | Monthly churn rate | Avg. customer lifetime (months) | Subscription model archetype |
|---|---|---|---|
| Supplements (monthly billing) | 5-8% | 12.5-20 | Athletic Greens / Ritual |
| Coffee subscriptions | 5-10% | 10-20 | Trade / Atlas |
| Household consumables | 5-8% | 12.5-20 | Dollar Shave Club / Harry's |
| Access / membership (annual model) | 5-8% | 12.5-20 | Thrive Market / FabFitFun annual |
| Pet food & treats | 6-10% | 10-17 | Chewy Autoship / BARK |
| Beverage (wine / RTD) | 6-12% | 8.3-16.7 | Winc / Vinebox |
| Beauty boxes (curation) | 8-14% | 7.1-12.5 | Birchbox / Ipsy |
| Meal kits | 8-15% | 6.7-12.5 | HelloFresh / Blue Apron |
| Apparel boxes (curated) | 10-15% | 6.7-10 | Stitch Fix style |
| General-merchandise boxes | 10-15% | 6.7-10 | FabFitFun / Lootcrate |
| Cross-category average | 5.3-8.5% | 11.8-18.9 | Blended (Recharge + ChartMogul + ProfitWell) |
Customer lifetime by vertical: 6-month food, 16-month supplements
The 3x spread between the top and bottom verticals is the real story. Supplements, coffee, household consumables and annual-model memberships cluster at 12.5 to 20 months. Pet food sits a half-step below at 10 to 17. Beverage subscriptions land in the middle at 8 to 17. Beauty boxes drop to 7 to 13. Meal kits, apparel boxes and general-merchandise boxes run 6.7 to 12.5 months at best.
The split is binary and predictable: replenishment categories retain. Discovery categories don't.
A replenishment category is one where the product is consumed and re-needed: supplements run out monthly, coffee runs out weekly, pet food runs out on a schedule the customer's pet sets. The customer needs another box and the brand wins by default. A discovery category is one where the product is tried and replaced: a new beauty box, a new apparel curation, a new recipe set. The customer has tested the brand and either incorporates it (rare) or replaces it (common).
Beauty is the interesting middle case because it has both depending on SKU mix. Skincare is structurally replenishment (a serum runs out). Makeup is structurally discovery (a customer tries a new shade and moves on). The curation-discovery beauty-box archetype (Birchbox, Ipsy) sits on the discovery side of the split and shows up in the 7 to 13 month band as a result. Beauty brands built around pure-replenishment skincare SKUs sit closer to the supplements lifetime band than to the beauty box one.
The public-company anchors confirm the rank order but won't give you the months number directly. BARK Inc. (pet, pure-play monthly DTC subscription) reported 2.2M active subscriptions at FY25 close (2025-03-31), down from 2.4M the prior year, a 7.0% YoY decline attributed in the 10-K to "lower new subscriptions and higher cancellations." Stitch Fix FY24 disclosed 2.5M active clients, down 16.7% from 3.0M YoY. Both confirm that apparel discovery churns harder than pet replenishment, but neither company publishes "average subscriber lifetime in months" as a stand-alone KPI. The lifetime read has to be triangulated from active-base movement plus churn disclosures.
The month-3 cliff is universal and predicts everything else
There is one pattern that holds in every dataset we pulled: roughly 60 to 70% of subscribers cancel between order 1 and order 3, regardless of vertical or billing cadence. We call it the month-3 cliff and it is the most useful retention metric an operator can monitor, because it predicts the 12-month outcome better than blended monthly churn does.
The chart shows what happens after the cliff: replenishment recovers and stabilizes near 38% at month 12, while apparel and lifestyle boxes continue to bleed down to 15%. Beauty curation sits in between at 28%. Meal kits at 22%.
The operator implication is direct: retention spend should land between month 0 and month 3, not month 6+. The most common retention mistake we see at $5M to $20M DTC brands is post-cliff spend (loyalty programs, win-back flows, anniversary credits) when the curve already declared the cohort dead at month 3. The customers who survived the cliff are the cohort to retain; the customers who didn't are the cohort to never re-acquire.
One supplements operator we work with watches a single metric on a daily standup: "% of new customers who made order 3 within 75 days." That number predicts their 12-month cohort retention to within 2 percentage points. After they moved welcome-flow spend forward and pulled win-back budget out of the post-month-6 window, their retention curves materially improved and win-back spend was cut without losing reactivations. Directional read from a single client, not a benchmark, but the structural lever is timing, not amount.
The cliff also explains why two brands in the same category can show identical blended monthly churn but radically different cohort retention curves: blended monthly churn averages a sharp early drop with a flatter tail, hiding the cliff entirely. A brand with a steep cliff and a flat tail and a brand with a gentle slope all the way through can both report "6% monthly churn." Only the cohort curve tells you which is which.
Why supplements and coffee out-retain beauty and apparel by 2-3x on the same billing cadence
Replenishment beats discovery by a factor of 2 to 3x on identical billing cadence, identical price points, and (often) identical CAC. That gap is structural, not operational. The replenishment customer has a product in their hand that runs out on a schedule; the brand has to fail to lose them. The discovery customer has a product they have tested and either liked or replaced; the brand has to win every order to keep them.
This is why beauty boxes (Birchbox, Ipsy archetype) at 7 to 13 months trail supplements (Athletic Greens, Ritual archetype) at 12.5 to 20 months despite higher gross margins on the beauty side. Beauty discovery customers churn faster because the underlying job-to-be-done is "try new things," which by definition cycles to the next thing. Supplements customers churn slower because the underlying job-to-be-done is "do not run out of my routine," which by definition stays.
BARK Inc.'s 7.0% YoY active-base decline tempers the replenishment thesis a little. Even category-leading replenishment brands face a consolidation cliff once they are the dominant player and run out of net-new acquisition runway. Pet food retention is structurally strong, but the absolute subscriber base for any one brand can still shrink if it owns most of the addressable market and saturated the acquisition pipeline three years ago. The counter-anchor is Chewy Autoship, which continues to grow active customers because the category is still under-penetrated for them; same retention dynamics, different growth stage.
For the operator at $5M to $50M, the takeaway is to know which side of the split your product sits on before you invest in retention infrastructure. Replenishment brands should be obsessed with subscribe-and-save penetration rate (% of orders on autoship) and consumption window accuracy. Discovery brands have to either lean into a curation moat (a recommendation engine the customer will not get elsewhere, like Stitch Fix's stylist data flywheel) or accept that the lifetime ceiling is real and re-engineer the unit economics around it.
The billing-cadence multiplier: annual prepay extends customer lifetime ~2.5x
The second-biggest lever inside any category is billing cadence. Annual prepay customers retain at roughly 2.5x the rate of monthly customers over a full year (28% vs 11% at month 12, per 2026 vendor cohort compilations). Quarterly billing sits in the middle at ~18%. The McKinsey-via-Ordergroove read is that 45% of "subscribe and save" replenishment members keep their subscription at least one year, about 10 percentage points higher than curation and membership models.
The math works in every category we tested. Supplements stretches from 16.3 months on monthly billing to roughly 67 months equivalent on annual prepay (because the 6-month retention on annual cohorts is disclosed at 92% for the Athletic Greens archetype, and extrapolating to the cross-category 28% 12-month retention implies that annual customers who renew are extremely sticky). Pet food stretches from 13.5 to ~33 months. Beauty stretches from 9.8 to ~24. Meal kits from 9.6 to ~22.
The trade-off is real and operator-specific. Annual prepay costs you cash upfront in the form of the discount (typically 15 to 25%) you have to offer to convert. What you gain is CAC payback compression: a monthly customer pays back CAC at month 6 to 12; an annual prepay customer pays back CAC at month 0 because they paid the year upfront. For a brand at 8% monthly churn and a 4 month CAC payback target, switching even 20% of new customers to annual prepay rewrites the working capital story.
The two cautions. First, annual cohorts have a hard renewal cliff at month 12; the 67-month-equivalent number is months equivalent, not contractual renewals. Most brands see roughly 28 to 35% of annual customers renew at the natural anniversary, which is why the chart frames annual as months-equivalent. Second, annual prepay only works in categories where the customer can credibly forecast 12 months of consumption. Supplements (a routine), coffee (a habit), pet food (a recurring need) all qualify. Apparel boxes (a discretionary curation) and meal kits (where the customer's calendar dictates demand) usually do not.
How to set your own customer-lifetime target (and when published benchmarks lie)
The right way to use this post is as a benchmark for your category midpoint, not a target for your brand. Three steps to set the target:
Step 1: Pull your real 3-month, 6-month and 12-month cohort retention. Recharge, Stay AI, Loop, Chargebee and most subscription engines export this directly. If you are on Shopify with a transactional repeat-purchase model (no subscription engine), pull cohort retention from Klaviyo or Lifetimely. The number you want is "% of customers acquired in month X who are still active in month X+3, X+6, X+12."
Step 2: Compute your effective monthly churn from the curve, not from billing-cycle gross cancels. The shortcut formula gives you the wrong answer if you feed it gross-cancellation rate from one billing cycle, because gross cancellation rate ignores reactivation and the post-cliff flat zone. The right number is implied churn from your 12-month cohort retention: monthly churn = 1 - (cohort_retained_at_M12) ^ (1/12).
Step 3: Compare to your category midpoint and to your CAC payback. If your category midpoint is 15 months and your real lifetime is 8 months, that is a product-fit or onboarding problem, not a benchmark problem. If your category midpoint is 15 months and your real lifetime is 18 months, congratulate yourself and check whether your CAC payback target is taking advantage of the runway you have earned.
The worked example: a supplements brand with a $45 average order value (AOV) and 6% monthly churn has an implied lifetime of 16.7 months and an implied LTV of $751 (16.7 × $45) before contribution margin and assuming flat order frequency. If your CAC is $90 (a healthy 8:1 LTV-to-CAC ratio at the gross level), your CAC payback hits at month 2 and the rest of the runway is contribution to your operating model. The same brand with a $25 AOV and 12% monthly churn has an 8.3 month lifetime and an LTV of $208; if CAC is still $90 you have a 2.3:1 ratio and a 3.6-month payback, which is workable but thin. The math is exactly the same; the category and the unit economics drive the answer.
For the CAC-payback view, our LTV-to-CAC ratio guide walks the dollar math, and the average CAC by ecommerce vertical post gives you the cost side of the ratio. The churn-rate companion lives at average subscription churn rate by category.
The cross-category average is 15 months. The category spread is 3x. The cliff is universal. If you can monitor one metric on your retention curve to predict your 12-month outcome, watch month-3 cohort retention; it carries the signal that blended monthly churn averages away.
Sources and methodology
This post synthesizes the published 2026 subscription benchmark literature with two public-company anchors from SEC EDGAR, weighted toward subscription DTC where the data is cleanest. Source list and how each one was used:
Eightx Average Subscription Churn Rate by Category 2026. Our internal canonical benchmark of monthly churn rates and tenure (in months) across 10 subscription categories. Tenure derived from monthly churn via the 1 / churn shortcut. Source cohort: Recharge 2025-2026 data, Birchbox / Ipsy historical disclosures, Athletic Greens / Ritual operator disclosures, BARK 60%+ 12-month retention reference, Dollar Shave Club / Harry's archetypes, Stitch Fix 10-K active-client trend.
Compiled ecommerce churn benchmarks by industry 2026. Six-vertical monthly churn benchmark (subscription boxes 10-15%, health and wellness 8-12%, food and beverage 12-18%, beauty and personal care 8-14%, DTC blended 6-10%, B2C digital 4-7%). Used to corroborate the Eightx tenure numbers and as the primary source for the annual-prepay 28% vs monthly 11% 12-month retention figure used in the billing-cadence chart.
Cross-vendor churn aggregation 2026. Aggregation of Recharge + ChartMogul + ProfitWell subscription data; corroborated the subscription-box and DTC blended monthly churn benchmarks. Used as the third independent source on cross-category average.
BARK, Inc. Form 10-K, fiscal year ended March 31 2025. Public-company pet-subscription pure-play disclosure. 2.2M active subscriptions at FY25 close, down 7.0% YoY from 2.4M, with the 10-K narrative citing "lower new subscriptions and higher cancellations." Provides the most concrete public-company subscription pure-play anchor for the pet category but does not publish "average subscriber lifetime in months" as a stand-alone KPI.
Methodology caveats the operator should weigh. The 1 / monthly churn formula assumes constant churn over the customer's life, which is wrong (the curve is steep early because of the month-3 cliff). Cohort retention curves are the truer picture; the formula is the operator's quick math. The benchmark numbers here are weighted toward subscription DTC and do not translate directly to transactional ecommerce. Public-company 10-Ks do not publish lifetime as a stand-alone KPI; the read is triangulated from active-base movement plus churn disclosures. Categories overlap (supplements skincare is also beauty replenishment; pet food is both pet and consumables), so an operator should pick the closest archetype, not force a category match.
Update cadence. This post is a living index, refreshed quarterly when Recharge and Recurly publish updated benchmarks and after any new public-company subscription 10-K with active-base disclosures. Next refresh target: August 29 2026.
Frequently asked questions
what is the average customer lifetime in months for a dtc ecommerce store?
Across 2026 subscription benchmarks the blended cross-category average is roughly 12 to 19 months, with a midpoint near 15 months. That number is derived from a blended monthly churn of 5.3 to 8.5%, using the 1 divided by churn shortcut. The honest read is that the cross-category number hides a 3x spread, so the right benchmark is your category midpoint, not the blended average.
how long does the average supplements subscriber stay before they churn?
On monthly billing the average supplements subscriber stays 12.5 to 20 months, implied by a 5 to 8% monthly churn rate (Athletic Greens and Ritual archetype). On annual prepay the same customer behaves like a 50 to 70 month subscriber because the disclosed 6-month annual-prepay retention sits near 92%. The category retains longest in DTC because supplements are structurally replenishment.
how long does the average meal kit customer stay before they cancel?
Meal kits run 6.7 to 12.5 months on monthly billing, derived from 8 to 15% monthly churn. The shorter end is closer to the operator reality because of the month-3 cliff. Recipe fatigue, weekly-frequency overcommit and commodity competition keep meal kits at the bottom of the lifetime ranking.
is 12 months a good average customer lifetime for my brand?
It depends on your category. 12 months is at or below the median for replenishment (supplements, coffee, consumables, pet food) and at or above the median for curation and discovery (beauty boxes, apparel boxes, meal kits). The real question is whether your CAC payback fits inside that window. If your CAC payback is 9 months and your category lifetime is 9 months you do not have a brand, you have a treadmill.
why is the month-3 cliff so universal across categories?
Two reasons. The first is that DTC subscription purchases concentrate buying intent at the moment of acquisition. People sign up for the promo, not the relationship. The second is that the first two boxes are usually enough to test the product. By order 3 the customer has either incorporated the product into a habit (replenishment wins) or decided to move on (discovery loses). The cliff predicts the 12-month outcome better than blended monthly churn does.
how do i calculate customer lifetime from my churn rate?
The classic shortcut is lifetime in months equals 1 divided by your monthly churn rate as a decimal. So a 6% monthly churn implies a 16.7 month lifetime. The shortcut assumes constant churn over the customer's life, which is wrong (the curve is steep early). It is fine for a sanity check but the cohort retention curve is the truer picture. Pull your real M3, M6 and M12 cohort retention and read the lifetime from the curve.
is annual prepay actually worth offering or do i just lose monthly revenue?
Annual prepay extends customer lifetime by roughly 2.5x within every category we tested. The trade-off is the discount you give up upfront vs the CAC payback compression you gain. If your monthly customer pays back CAC at month 9 and your annual customer pays back CAC at month 0 (because they paid 12 months upfront at a 20% discount), the annual cohort is the better business almost always, even before you count the retention lift.
should i benchmark against monthly churn or 12-month cohort retention?
Use both for different decisions. Monthly churn is the metric for trend monitoring and quick benchmarks. 12-month cohort retention is the metric for ad-spend and CAC payback decisions because it tells you what fraction of an acquired cohort is still paying you at the moment your CAC payback target is supposed to hit. If you can only watch one number, watch month-3 cohort retention; it predicts the 12-month outcome.