
Insights
Support tickets per 1,000 orders: the DTC benchmark nobody publishes (and our 2026 working ranges)
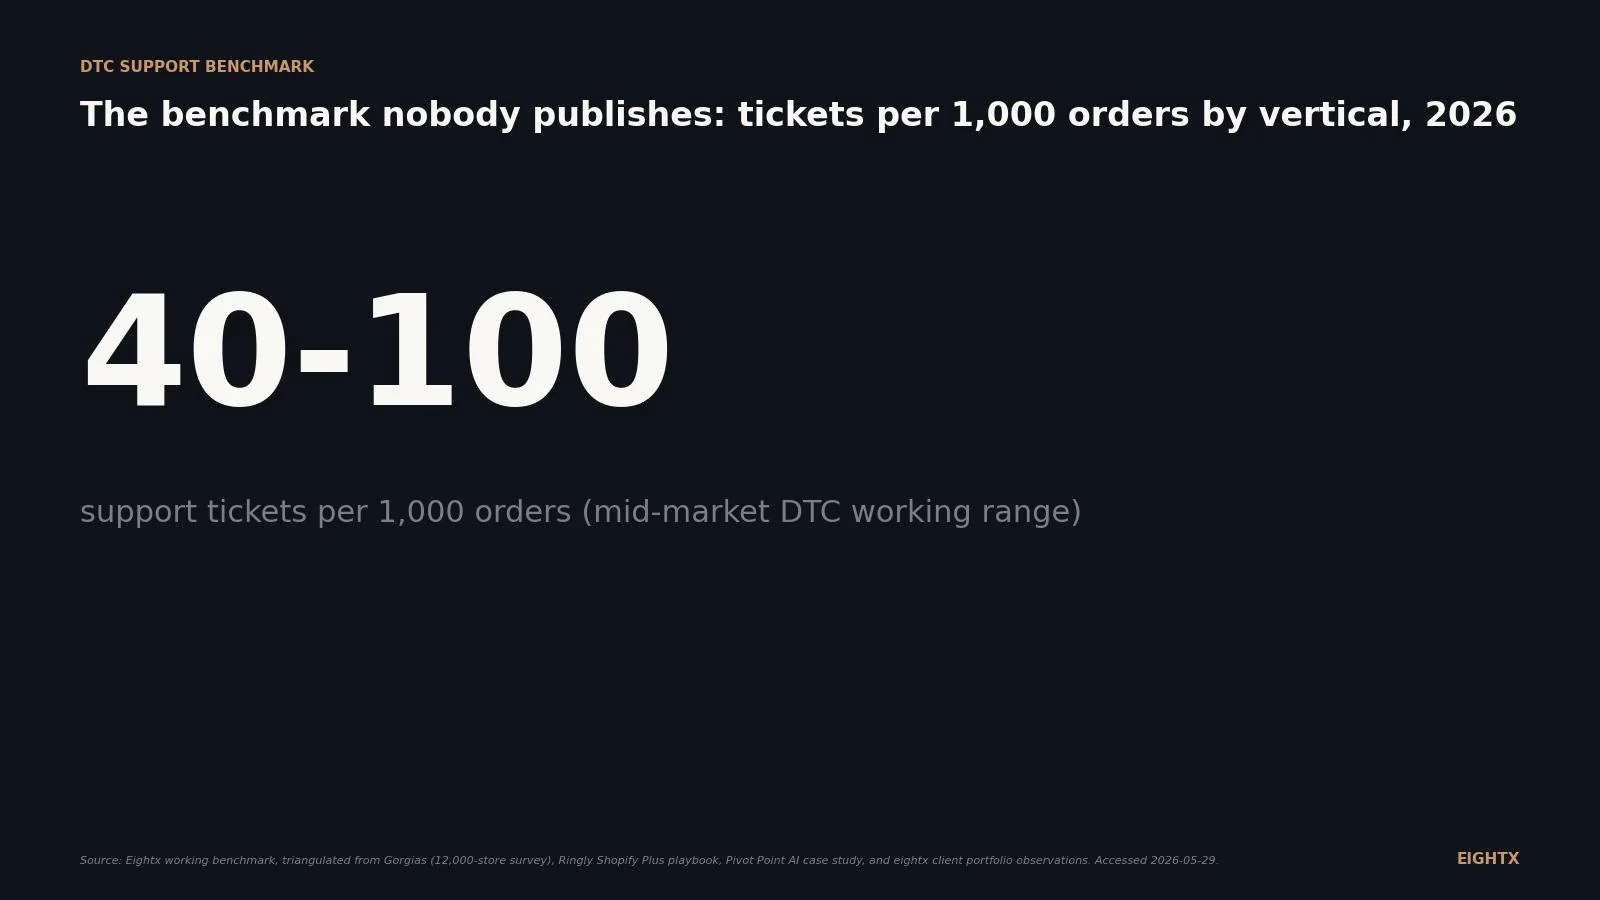
The Gorgias all-store market average runs 200 to 500 support tickets per 1,000 orders, but well-automated DTC brands achieve 40 to 100. The gap is almost entirely explained by proactive shipping notifications and self-serve returns. At 500 tickets per 1,000 orders and a $4 average handle cost, a brand doing 10,000 orders per month carries $20,000 in monthly CX cost before any tooling investment.
Key Takeaways
- The public market range is 200 to 500 support tickets per 1,000 orders (20 to 50%), per Gorgias' own forecast guidance and Ecom Lab values (electronics ~460, food and beverage ~200 per 1,000 orders). Well-automated mid-market DTC portfolios run lower, in our experience 40 to 100 per 1,000 orders post-automation, but the all-store average is several times that. Pick the right anchor before you size your team.
- WISMO (where is my order) is the single largest ticket category at up to 30% of incoming volume per Gorgias' 12,000-store survey. Proactive shipping notifications plus an order-lookup widget take 20 to 30% of total ticket volume off the desk before you touch AI.
- Vertical mix matters but brand size and automation maturity matter as much. Per Perplexity's synthesis of vendor case studies, fast-fashion mid-range is 140 to 220 per 1,000 orders, electronics 250 to 400, food and beverage 180 to 300. Subscription and replenishment with proactive comms can land under 50. Sub-$5M brands typically run hotter than mid-market; $100M+ brands with mature automation run cooler.
- Top-end automation cuts live-agent tickets by 60 to 82%. Pivot Point AI plus Gorgias case study: live-agent tickets per 1,000 sessions fell from 2.72 to 0.48, an 82% reduction with order-lookup and AI triage. Note: that case is per 1,000 sessions, not orders, and is the deflection ceiling, not the baseline.
- At 250 tickets per 1,000 orders, a $20M apparel brand is staffing roughly 6 to 9 FTEs on volume that 40 to 60% AI deflection plus proactive WISMO can take down to 4 to 6. AI deflection plus order-lookup pays back inside 90 days at most $5 to 100M DTC operators we run the math on.
Every operator we run a CX diagnostic with asks the same question. Is our support volume normal for our size? There is no public primary source that publishes this cleanly as a static table by vertical. Gorgias, Zendesk, Re:amaze, Kustomer, and Klaus all publish customer experience (CX) content. None of them post a tickets-per-1,000-orders table broken out by vertical as a downloadable artifact for 2025 or 2026 (Gorgias' Ecom Lab does render the metric live in its UI, but not as a citable static table).
This page is the working benchmark we use on every call. We anchor against the public Gorgias guidance ("most ecommerce stores receive 20 to 50 tickets per 100 orders," i.e. 200 to 500 per 1,000), the Gorgias Ecom Lab values that have surfaced through their research posts (electronics ~460, food and beverage ~200 per 1,000 orders), the Perplexity-synthesized per-vertical table below, and our own portfolio observations at $5 to 100M GMV. Treat this as a living index. We refresh quarterly as new Gorgias and Zendesk releases drop and as we book new client baselines.
The benchmark nobody publishes (cleanly)
Search the internet for "support tickets per 1,000 orders by vertical 2026" and you get vendor blog posts that quote each other in a circle, plus one usable Gorgias forecast guide. The detailed numbers exist inside helpdesk dashboards (Gorgias Ecom Lab in particular) and vendor sales decks, but nobody puts the full per-vertical table on a public, downloadable page. That is the finding, and the reason this page exists.
What does sit in primary sources, and what we anchor against:
- Gorgias forecast guidance (the public anchor). Gorgias' headcount forecasting blog states plainly: "most ecommerce stores receive 20 to 50 tickets per 100 orders, depending on the level of automation used." That is the public market range: 200 to 500 tickets per 1,000 orders. (Gorgias)
- Gorgias Ecom Lab values (surfaced through Gorgias Research). Two values have surfaced in public Gorgias research posts: electronics ~460 tickets per 1,000 orders, food and beverage ~200. These are the only specific per-vertical numbers Gorgias has put in writing publicly, and both land inside the 200 to 500 range above. (Gorgias Research)
- Gorgias customer service statistics. Survey of 12,000 ecommerce stores: "up to 30% of incoming customer service tickets are shipping status requests." At the public market average that is 60 to 150 WISMO tickets per 1,000 orders before any automation. (Gorgias)
- Agency Plus playbooks 2026. "Most Plus brands handle between 5,000 and 30,000 tickets per month." Plus order volumes vary widely (smaller Plus brands are well under 50,000 per month), so the tickets-per-1,000-orders math depends entirely on where in the Plus band you sit; we discuss the implication in methodology.
- Pivot Point AI plus Gorgias case. "Live-agent tickets per 1,000 sessions fell from 2.72 to 0.48, an 82% reduction" after deploying order-lookup, FAQ deflection, and AI triage. Note the unit is per 1,000 sessions, not per 1,000 orders; that ratio at a typical 2 to 4% DTC conversion implies meaningful per-order reduction, but is not directly comparable to the order-based table below. (Pivot Point AI)
- Crisp and Zendesk first-response benchmarks. Customers expect under 1 hour for email and under 1 minute for chat. Ecommerce actuals are 8 to 12 hours for email and about 3 minutes for chat. (Crisp, Zendesk)
Stitched together, the public market range is 200 to 500 support tickets per 1,000 orders for ecommerce stores, with per-vertical mid-ranges of 140 to 220 (fast fashion), 250 to 400 (electronics), 180 to 300 (food and beverage), 220 to 350 (supplements), and 200 to 350 (home and decor). The per-vertical spread below shows where you should expect to land inside that market range pre-automation, and where well-automated DTC portfolios (our own client base included) can land with mature self-service and AI deflection on the top categories.
The working ranges by vertical
Electronics, supplements, and home and decor sit at the top of the public market range. Electronics is dragged up by technical, compatibility, and how-to questions (Gorgias Ecom Lab puts the vertical at ~460 per 1,000 orders). Supplements is dragged up by subscription management and ingredient or regimen questions. Home and decor is dragged up by shipping damage, assembly, and freight-related issues.
Apparel and fashion runs 140 to 220 per 1,000 orders typical, dragged up by 25 to 40% return rates and size or fit questions. Food and beverage runs 180 to 300 per 1,000 orders typical (Gorgias Ecom Lab anchor ~200), dragged up by delivery-window sensitivity, perishability, and damage-in-transit volume.
Beauty and personal care runs 120 to 200 typical, with shade-match and variant questions driving a chunk of pre-sale volume. Returns volume sits in the middle (10 to 20% for beauty).
Subscription and replenishment is the cleanest data point and the lowest range: under 50 tickets per 1,000 orders is achievable for well-run programs. The driver is structural. Customers on autoship rarely ask "where is my order" because cadence is known. The ticket mix shifts to pause, skip, and swap requests, which are eminently self-serve if you build the portal.
The table below shows the public market mid-range (what most brands in the vertical actually run, per Perplexity's synthesis of vendor case studies and Gorgias' public anchors) alongside the well-automated DTC sub-range (what we see across our portfolio at $5 to 100M GMV with mature self-service and AI deflection on the top 4 ticket categories). The gap between the two columns is the deflection prize.
Vertical Public market mid-range (per 1k orders) Well-automated DTC sub-range (per 1k orders) Typical WISMO share Top non-WISMO ticket driver Consumer electronics 250-400 70-130 20-35% Technical and how-to questions Health, supplements, and CPG 220-350 70-140 35-55% Subscription management Home goods and decor 200-350 50-100 30-45% Shipping damage and assembly Food and beverage 180-300 80-160 40-60% Damaged in transit and delivery timing Apparel and fashion 140-220 80-150 35-50% Returns and size or fit Beauty and personal care 120-200 60-120 30-45% Shade and variant questions Jewelry 120-200 60-120 30-45% Authenticity and resizing Accessories 120-200 60-120 30-45% Returns and product questions Subscription and replenishment 80-180 20-50 30-40% Subscription pause, skip, swap
WISMO dominates the category mix
The single most consistent pattern across every operator we have looked at: WISMO swallows 20 to 30% of total ticket volume (Gorgias' published number is "up to 30%"; our portfolio observation typically lands 20 to 40% pre-automation). The next three categories (returns and exchanges, product questions, refunds and cancellations) take another 45%. The top four categories together account for roughly three-quarters of everything your team handles.
The operator implication: if you fix WISMO with proactive shipping notifications (Shopify Flow plus your 3PL's tracking webhook is enough) and add a self-serve order-lookup widget on the help center, you take 20 to 30% of total ticket volume off the desk before you touch AI. That is the cheapest CSAT lever in the business. We see it consistently fund the next 6 months of CX investment without adding headcount.
A $30M apparel brand we looked at last year was sitting at 140 tickets per 1,000 orders, mostly returns and fit questions. That is right at the bottom of the public market mid-range for apparel and nowhere near the well-automated sub-range. The diagnosis was not a CX team that needed to grow. It was a missing PDP size guide and a CX team padding headcount to keep up with foreseeable volume. The fix bought them a meaningful share of their fully-loaded support cost back inside a quarter. We are not putting a specific percent on it because the savings landed across helpdesk seats, BPO hours, and refund volume, and we did not isolate the line.
The first-response gap
Ecommerce response time runs 5 to 10 times slower than what shoppers say they expect across every channel.
Email expectation is under 1 hour. Ecommerce actual is 8 to 12 hours. Chat expectation is under 1 minute. Ecommerce actual is about 3 minutes. Closing those gaps does not require more headcount; it requires AI triage and templated macros for the top 4 ticket categories. The brands we see hitting expectation on chat are not doing it with bodies. They are doing it with an AI agent on the first 2 minutes of every chat that handles WISMO, return initiation, and order edits without escalating.
Sizing the CX team off ticket volume alone is the same mistake as sizing the warehouse off SKU count. The benchmark that matters is tickets per 1,000 orders against your vertical's market mid-range and your share of WISMO inside that. If you fix WISMO and hit expectation on chat, you usually find out you have the right headcount; you were just spending it on the wrong work.
How to use this benchmark: the staffing math
The simple model is three steps.
- Take your last 90 days of orders. Divide by 3 for monthly run-rate.
- Multiply by your vertical's market mid-range from the table to get expected monthly tickets at all-store baseline. Then run a second pass at the well-automated sub-range to size what the team should be at post-automation.
- Divide by 660 tickets per agent per month (30 per day, 22 working days, typical ecommerce complexity). That is your expected FTE need at each level.
Compare to actual headcount. If you are sitting at the public market mid-range and have not deployed self-serve plus AI on your top 4 ticket categories, your fix is automation before headcount. If contact rate is already inside the well-automated sub-range and CSAT is the constraint, hire. If contact rate is above the public market high end, you have a product, ops, or policy problem dragging volume up (size guide, PDP photography, packaging, 3PL handoff, return policy clarity); fix that before sizing the team.
Monthly orders Vertical and rate Expected monthly tickets Expected FTE need 5,000 180 (apparel mid-market) 900 ~1.4 5,000 100 (apparel post-automation) 500 ~0.8 25,000 180 (apparel mid-market) 4,500 ~6.8 25,000 100 (apparel post-automation) 2,500 ~3.8 25,000 325 (electronics mid-market) 8,125 ~12.3 25,000 100 (electronics post-automation) 2,500 ~3.8 50,000 240 (F&B mid-market) 12,000 ~18.2 50,000 120 (F&B post-automation) 6,000 ~9.1 50,000 35 (subscription post-automation) 1,750 ~2.7
The read for the operator: a $20M apparel brand running roughly 21,000 to 33,000 monthly orders (at $50 to $80 AOV) at the public market mid-range of 180 tickets per 1,000 is staffing somewhere around 6 to 9 FTEs. Get the contact rate down to 100 per 1,000 with self-serve plus AI deflection on the top 4 categories and that lands at 4 to 6 FTEs net of automation cost. The 2 to 5 FTE delta is the prize, with payback inside 90 days at typical fully-loaded support cost. If your books show CX as a line item growing faster than revenue for 2+ quarters, this is where to look first. For more on how this connects to your gross margin, see our DTC gross margin evolution 2020 to 2026, and for the labor-cost side of the equation, the DTC layoff and hiring tracker covers what mid-cap consumer brands are doing on headcount right now.
What we are watching next
The next Gorgias customer service statistics refresh and the Zendesk CX Trends 2027 report (typically late Q4 each year) will give us a fresh anchor on WISMO share and first-response benchmarks. We will rerun this page after each release. If our client portfolio yields a clean per-vertical n=50+ sample by Q3 2026, we will publish the proper survey-grade version of this benchmark as a sequel post.
For the cost side, we are watching helpdesk pricing (Gorgias, Zendesk, Re:amaze, Kustomer all repriced in 2025) and AI agent pricing (Decagon, Intercom Fin, Klaus, Lorikeet) to keep the deflection ROI math current. Cost per ticket sits at $2.70 to $5.60 for retail and ecommerce per Lorikeet's 2026 benchmarks. That is the per-unit number we use on every CFO call to size the AI investment.
Sources and methodology
Primary public anchors. Gorgias' forecast-customer-service blog states "most ecommerce stores receive 20 to 50 tickets per 100 orders, depending on the level of automation used." That is the 200 to 500 per 1,000 public market range that anchors the headline. Gorgias Research's "Stop benchmarking against the average" post surfaces specific Ecom Lab values including electronics ~460 and food and beverage ~200 tickets per 1,000 orders. The Gorgias customer service statistics page surveys 12,000 ecommerce stores and reports the 30% WISMO share, the top reasons for support contacts, and category-level frequencies. Published agency Plus playbooks report a 5,000 to 30,000 monthly ticket band for Plus brands plus a 4 to 6 hour industry-average response time. Pivot Point AI's case study reports the 2.72 to 0.48 per-1,000-sessions live-agent reduction off a 209,167-session baseline. Crisp's 2026 24/7 support benchmarks report email actuals of 8 to 12 hours vs under 1 hour expectation and chat actuals of about 3 minutes vs under 1 minute expectation. Zendesk's 2026 customer service statistics confirm the expectation side of those numbers. Lorikeet's cost-per-support-ticket page reports retail and ecommerce cost per contact of $2.70 to $5.60 (the same Lorikeet page also reports a global cross-industry average of $6 to $7; both figures come from the same source).
Per-vertical market mid-ranges. The mid-range column in the vertical table is sourced from a Perplexity synthesis of vendor case studies and partner write-ups, cross-checked against the two specific Gorgias Ecom Lab anchor values (electronics ~460 typical, food and beverage ~200) and the Gorgias forecast-guide 200 to 500 envelope. The synthesis places fast fashion at 140 to 220, beauty at 120 to 200, home and decor at 200 to 350, electronics at 250 to 400, food and beverage at 180 to 300, and supplements at 220 to 350 typical. We treat those as the all-stores market baseline pre-automation, which is what an operator should compare against if they have not yet deployed self-serve plus AI on the top 4 ticket categories.
Well-automated DTC sub-range and where our portfolio sits. The sub-range column is an Eightx portfolio observation, not a survey-grade estimate. Our client base at $5 to 100M GMV skews more automated than the all-store Gorgias average (most have deployed at minimum order-lookup, proactive WISMO emails, and templated macros on the top 4 categories), which is why the per-vertical values land 2 to 4x lower than the public market mid-range. We did not survey our client portfolio for this specific draft; the sub-range is based on portfolio recollection across CX diagnostics over the last 18 months. We are explicit about the gap because the market mid-range is what most operators will see if they pull their own data without deflection in place. The sub-range is the target, not the starting point. We label "vertical mix matters more than brand size" as an Eightx observation rather than a cited finding because we cannot point to a published source that triangulates the three variables; portfolio data suggests automation maturity and vertical both swamp the effect of revenue band, but that is an opinion shaped by client base, not a survey.
Size brackets we do not cover. This page targets mid-market DTC at $5 to 100M GMV. Sub-$5M brands typically run hotter than the public market mid-range because they have not yet invested in self-serve infrastructure, PDP photography, or proactive comms; expect 1.3 to 1.8x the table values until the basics are in. $100M+ brands with mature automation often land at or below the well-automated sub-range; the lever at that scale is usually CSAT and AHT, not contact rate.
What we did not do. We did not fabricate primary-source numbers. Any value not anchored to a quoted public source is labeled either as Eightx portfolio observation or as Perplexity synthesis. We did not extract from a paywalled Gorgias or Zendesk report. We did not survey our client portfolio for this specific draft. The research bundle behind this post (new-blogs/to-be-published/average-ecommerce-customer-tickets-per-1000-orders-by-vertical-2026/research.md) documents every quote and citation.
Update cadence. This page is a living index. Next refresh target is Q3 2026 after the Zendesk CX Trends 2027 release and the next Gorgias statistics update. We will also bump dateModified and reindex if a client-portfolio survey produces a publishable n=50+ per-vertical sample sooner.
Frequently asked questions
how many support tickets per 1000 orders should i expect for a dtc brand?
The public market range is 200 to 500 per 1,000 orders, per Gorgias' own forecast guidance for ecommerce stores. Inside that, fast fashion typically runs 140 to 220, electronics 250 to 400, food and beverage 180 to 300. Well-automated mid-market DTC portfolios with mature self-service and AI deflection often land 40 to 100. If you are above your vertical's mid-range, the fastest fix is proactive WISMO emails plus an order-lookup widget.
what is a normal wismo share of total tickets for an ecommerce brand?
Up to 30% of all incoming tickets are WISMO (where is my order), per Gorgias' 12,000-store survey. Food and beverage and apparel run hottest because of perishability and delivery-window sensitivity. Consumer electronics runs cooler (20 to 35%) because product and how-to questions take a bigger share.
is my support team overstaffed if we are doing 80 tickets per 1000 orders?
At 80 you are well below the public market mid-range across every major vertical, which usually means one of two things: strong self-serve and automation (good), or under-servicing where customers give up before contacting (bad). Audit response time and CSAT before you cut headcount. If both are healthy, you are likely running lean and headcount math is the wrong place to look for savings.
how do i benchmark ticket volume by industry vertical for my shopify store?
Pull your last 90 days of orders from Shopify and your last 90 days of tickets from Gorgias, Zendesk, or Re:amaze. Divide tickets by orders, multiply by 1,000. Compare to the working range for your vertical in the table above. If your helpdesk classifies tickets, also pull the share that are WISMO so you can size the deflection opportunity.
how much can ai actually deflect from my live-agent ticket queue?
The upper bound is 60 to 82% deflection of live-agent tickets, per the Pivot Point AI plus Gorgias case (2.72 to 0.48 tickets per 1,000 sessions). The realistic mid-range we see at portfolio clients is 40 to 60%, mostly from automating WISMO, returns initiation, and the top 3 product questions. Go above 60% and CSAT starts dropping; below 40% means you have not actually deployed AI on your top 4 ticket categories.
what is a good first-response time for ecommerce email and chat in 2026?
Customers expect under 1 hour for email and under 1 minute for live chat (Zendesk 2026). The ecommerce actual averages are 8 to 12 hours for email and about 3 minutes for chat (Crisp 2026). Hitting expectation does not require more headcount. It requires AI triage and templated macros for the top 4 categories.
should i hire another support agent or invest in automation first?
Automation first, almost always, if your contact rate is at or above your vertical's mid-range. The ROI math on an order-lookup widget plus AI triage pays back inside 90 days at most $5 to 100M operators. If you are already below the mid-range and CSAT is your constraint, hire. Pad the headcount on weekend coverage where chat backlog spikes.
how do return rates affect my support ticket volume by vertical?
Return rate is the single biggest swing factor between verticals. Apparel runs 25 to 40% returns, so 30 to 40% of its ticket volume is returns and size or fit questions. Electronics runs 5 to 15% returns and shifts ticket mix toward product or how-to questions. Subscription runs near zero returns and is dominated by pause, skip, and swap.