
Insights
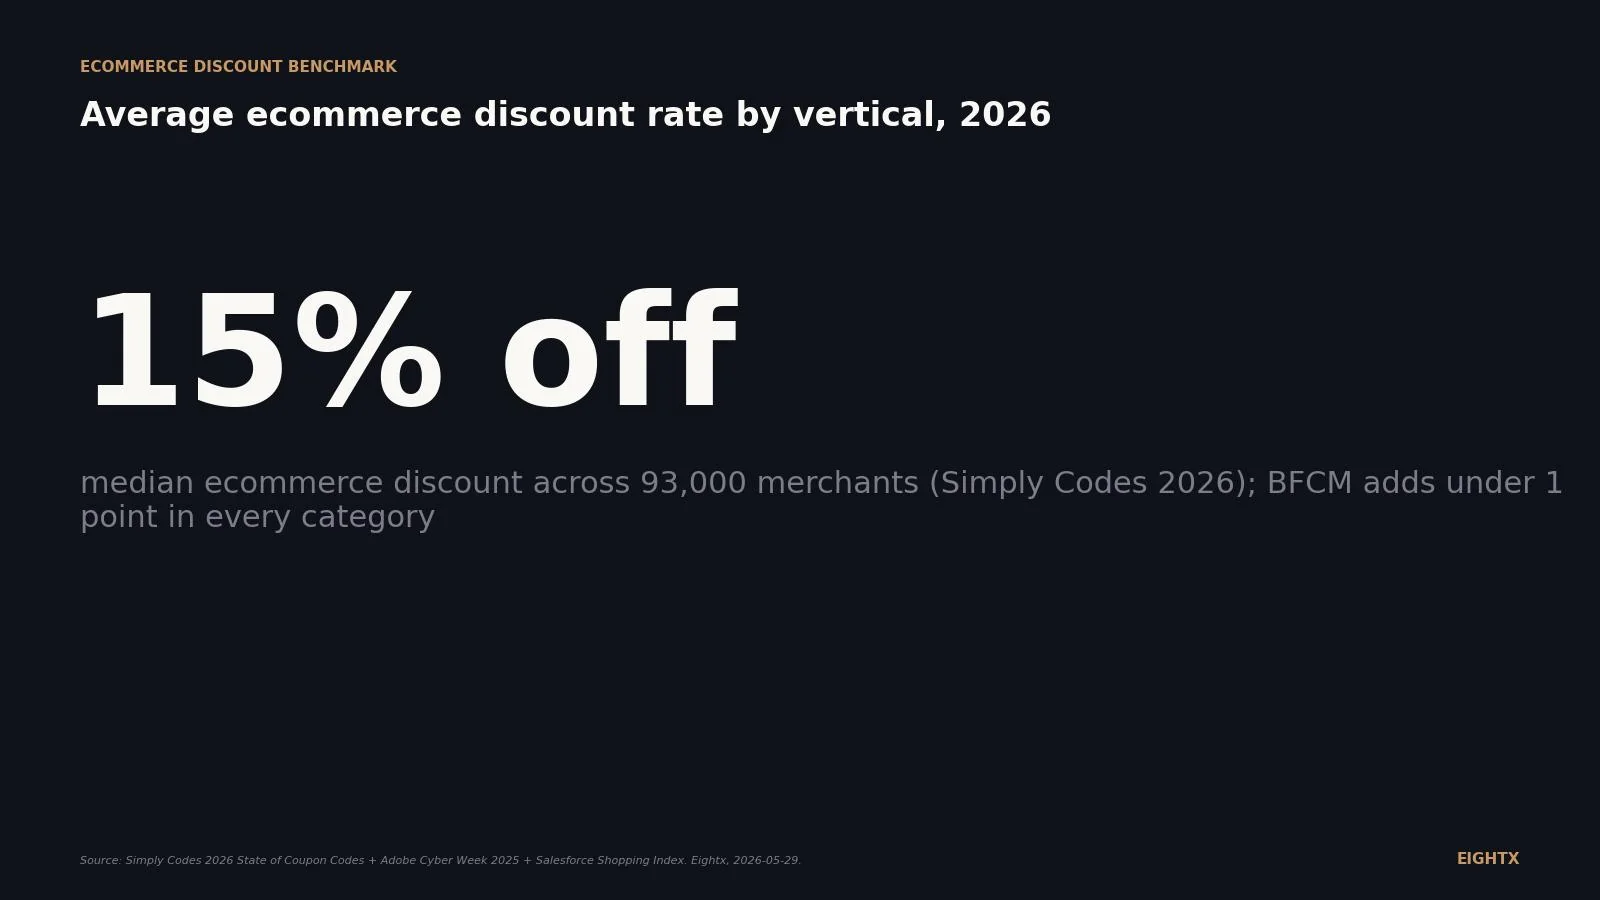
Average ecommerce discount rate by vertical, 2026: median 15%, average 19.5%, Cyber Week peak 23%
The median ecommerce discount rate across 93,000 merchants is 15% in 2026, with an average of 19.5% and a Cyber Week peak of 23%. BFCM adds less than one percentage point above the trailing run rate in every category. Brands running persistent discounts above the median are training their customer base to wait for sales, which compresses AOV and gross margin simultaneously throughout the year.
Key Takeaways
- The 2026 ecommerce discount median across 93,000 merchants is 15% off. The average is 19.5%. Most operators benchmark against Cyber Week peak coverage and conclude they're not promotional enough. The trailing-12-month data says otherwise.
- BFCM adds less than 1 percentage point of depth in every category tested. Electronics 0.0pt, apparel +0.1pt, beauty essentially flat, home/garden 0.0pt, sports/outdoors +0.8pt. Brands matching competitor BFCM depths are overpaying for orders they could have won at their normal offer.
- Salesforce Shopping Index pegs the cross-channel blended average discount rate at 22%, flat year-over-year. The aggregate level has stabilized, not climbed. The discount-fatigue narrative is louder than the data.
- Adobe Cyber Week 2025 peak depths: electronics 30.1%, toys 27.8%, apparel 23.2%, grocery 12.3%. These are 6-day peak measurements, not the year-round average. The gap between peak and average runs 1.5-2x.
- 1 added point of average discount depth at 60% gross margin costs ~1.7 points of contribution. Routine sitewide cadence above 20-25% flips first-purchase cohorts unprofitable for most DTC brands (median net margin 3-10%).
Discounting is the line on a DTC P&L that nobody owns. Operators track average order value, customer-acquisition cost (CAC), and conversion rate weekly but rarely benchmark their average discount depth (the percentage off across discounted orders) against the vertical they actually compete in. The 2026 reality is more compressed than most operators assume: the median best-available promo-code depth across 93,000 merchants is 15% off, the average is 19.5%, and Black Friday/Cyber Monday (BFCM) adds less than 1 percentage point of depth in every category tested. The 30-50% headlines that dominate holiday marketing copy reference long-tail outliers, not the structural average. This page is a living index of the 2026 by-vertical benchmark, refreshed quarterly.
The 2026 discount-rate headline: three numbers operators keep confusing
There are three "average discount rate" numbers floating around 2026 ecommerce coverage, and they measure three different things.
Simply Codes (the coupon-code dataset, ~93,000 merchants tracked). Median best-available percentage-off code per merchant: 15%. Average: 19.5%. The middle 50% of merchants sit between 10% and 25%. Numbers are remarkably stable across years (18.8% in 2023, 19.7% in 2024, 19.5% in 2025). What this measures: the depth of the deepest code offered per merchant per month, then averaged.
Salesforce Shopping Index (the blended cross-channel rate). Average discount rate across Salesforce Commerce Cloud merchants (1 billion+ shoppers): 22%, flat year-over-year. What this measures: a weighted blend across all transactions, both full-price and discounted, in the Salesforce dataset. This is the highest-quality single number for "discount rate across the industry."
Adobe Digital Economy Index (the Cyber Week peak). Peak discount depth measured during the November 27 to December 2 window: electronics 30.1%, toys 27.8%, apparel 23.2%, computers 22.6%, grocery 12.3%. What this measures: peak depth in a 6-day window at a subset of larger Adobe Analytics retailers. Not a year-round average.
Operators routinely take the Adobe Cyber Week numbers and cite them as "the apparel average" or "the electronics average." That is the most common framing error in 2026 promo planning. Adobe peak depths run roughly 1.5-2x the Simply Codes trailing-12-month average. If you use the peak as your year-round target, you will over-discount by ~10 points.
In a recent CFO call with a DTC operator working through cost-of-goods variance, the operator asked us to pull discounts out of COGS so they could actually see what the depth was doing. That P&L hide is structural: most Shopify and 3PL accounting setups bury merchant discount inside cost-of-goods or net revenue netting, so the discount line never appears as its own variance. Until you unbundle it, you cannot manage it.
Vertical Avg depth (T12M) Median BFCM lift vs baseline AI & software ~30% 25% Not reported separately Apparel & fashion ~19-20% 15% +0.1pt Beauty & personal care ~19-20% 15% Essentially flat Home & garden ~19-20% 15% 0.0pt Sports & outdoors ~19-20% 15% +0.8pt (largest in sample) Consumer electronics 17.9% 15% 0.0pt All-merchant blended 19.5% 15% Nov avg 19.2% (below annual)
The BFCM myth: less than 1 point of depth lift in every category tested
The counterintuitive finding in the Simply Codes 2026 data: BFCM does not move category-level depth. Electronics lifted 0.0 points during BFCM, apparel lifted +0.1 point, beauty was essentially flat, home and garden lifted 0.0 points, sports and outdoors lifted +0.8 points (the largest move in the sample, and still under a single point). November's all-merchant average depth came in at 19.2%, slightly below the annual norm of 19.5%.
The only month where the median moves is December, when median depth ticks from 15% to 20%, driven by the share of merchants offering 30%+ off rising from 17% to 22.6% of the dataset. That December lift is real, but it is concentrated in the post-Christmas clearance window, not in the BFCM peak.
The operator implication: brands that match competitor BFCM depths are paying for orders they could have won at their normal offer. The data says the depth was not what got the order. Penetration was (more shoppers used a code, even if the code did not change), creative was, calendar timing was. The "we need to go 5 points deeper than last year" debate that runs in most marketing channels every October is not supported by the trailing data.
A multi-category DTC operator on a December 2025 review call summed it up: "BFCM kicked in, IGP on ecommerce dropped two points." Even when depth holds, blended margin still hits during BFCM because penetration moves. More orders use the same code. Volume times depth times penetration is the real margin equation. Depth alone tells a third of the story.
Adobe Cyber Week peaks vs the trailing-12-month average
Adobe Analytics published vertical-level peak discount depths from Cyber Week 2025 (November 27 to December 2). These are the peak measurements that drive most "the average discount rate is 30%" headlines. They are real, but they describe a 6-day window at larger retailers, not the trailing-12-month average across all merchants.
Vertical Peak depth (Cyber Week 2025) Electronics 30.1% Toys 27.8% Apparel 23.2% Computers 22.6% TVs 19.9% Furniture & bedding 19.7% Sporting goods 18.8% Appliances 16.9% Personal care 12.5% Grocery 12.3%
The framing rule for operators: Adobe peaks tell you what the deepest 6 days looked like at the biggest retailers in your category. Simply Codes trailing-12-month tells you what the median merchant in your category does for the other 359 days. The two numbers are both true. They are not interchangeable.
Practical use of the Adobe peaks: as a ceiling for your Cyber Week planning, not a baseline. If apparel peaked at 23.2% in 2025 across Adobe's customer base, that is the depth your biggest peers ran for 6 days. Your normal offer in February through October should sit closer to the Simply Codes 15-20% band.
Public-company 10-K disclosures: 25 reference filings, mid-single-digit AUR moves
We pulled SEC EDGAR full-text search results for "promotional environment," "elevated promotional activity," "discount depth," and "average unit retail" across 10-K and 10-Q filings from January through May 2026. Twenty-five DTC and consumer filings flagged the promotional environment in their MD&A narrative. None disclosed 30-50% headline discount depth. The actual disclosed average unit retail (AUR) and markdown rate movements are mid-single-digit.
Vertical Reference 10-K filings (2026) Disclosed narrative theme Apparel Gap, AEO, Carter's, Abercrombie, Ralph Lauren, Urban Outfitters, Buckle, Children's Place, Zumiez, Tilly's, Duluth, Oxford, J.Jill "Elevated promotional environment"; mid-single-digit AUR declines Home & furniture Bob's Discount Furniture, Floor & Decor, Bed Bath & Beyond "Comparable-sales driver from promotions"; sitewide events Electronics Best Buy Promotional intensity; tariff-driven clearance Beauty/personal care Honest Company Promotional intensity (lower depth than apparel peers) CPG/F&B Utz, Vita Coco, Once Upon a Farm Trade promotion and shopper marketing intensity Luxury/jewelry Capri Holdings, Signet Jewelers Promotional environment cited as margin pressure Athletic Nike (10-Q Q3 FY2026, accession 0000320187-26-000037) Explicit elevated promotional activity; inventory clean-up
The pattern across all 25 filings: apparel and home brands flagged the "elevated promotional environment" as a margin pressure but reported AUR declines and markdown rate movements in the mid-single-digit range, not the 30-50% the holiday marketing implies. Nike's Q3 FY2026 10-Q is the strongest single narrative in the dataset (filed 2026-04-01), explicitly sequencing the inventory clean-up and the gross margin impact. CPG brands (Utz, Vita Coco, Once Upon a Farm) used the term "trade promotion" but described the same dynamic from the retailer-funded side. Luxury (Capri, Signet) cited promotional intensity as the reason for tighter operating margin guidance.
If you run a $5-150M DTC brand and want to benchmark your AUR or markdown rate year-over-year, the 25 filings above are your starter peer set. Compare your year-over-year AUR change to theirs. A bigger negative gap than the public peers means you are over-discounting. A smaller gap means you have headroom to hold price.
The CPI macro angle: stickers rose, net AUR widened the gap
Apparel CPI (BLS series CUUR0000SAA) hit 138.07 in April 2026 vs 132.54 in April 2025, a +4.2% year-over-year rise. Furniture and bedding CPI (CUUR0000SEHF) ran 295.7 vs 280.6, a +5.4% year-over-year rise. Both are the first sustained year-over-year rises since the post-COVID inflation wave broke in 2023.
The mechanism behind the numbers: brands raised stickers to absorb tariff and wage cost increases (the CPI rise) and expanded promo depth so the net average unit retail did not pass the full sticker increase through to the consumer at the same rate. The same dynamic is visible in the public DTC gross-margin trend, where reported GM compressed alongside promo depth expansion across 2025-2026. The CPI rise plus the disclosed 10-K AUR pressure together imply discount-depth expansion in 2026, but at single-digit points, not the 30-50% the marketing copy suggests. The promo line is doing the work the sticker cannot.
US ecommerce GMV (Census MRTS, NAICS 4541) hit $128.4 billion in March 2026, up 10.6% year-over-year. The volume context matters: a 1-point deeper promo across the industry equals roughly $1.3 billion in monthly revenue ceded to discount. Even modest depth changes show up as real margin drag at industry scale.
October 2025 BLS data is missing from the chart due to the 2025 federal appropriations lapse. The two-month gap does not change the trend.
The CFO math: 1 point of depth equals 1.7 points of contribution at 60% gross margin
Worked example. A $20M revenue DTC brand at 60% gross margin runs average discount depth of 22% on its discounted orders. The team debates pushing depth from 22% to 23% to match a competitor's BFCM ad.
The math at flat unit volume:
Scenario Revenue GM% Avg discount depth Net AUR impact Contribution margin Base $20.0M 60% 22% baseline 60% +1pt depth $20.0M (flat units) (unchanged COGS) 23% -1.0% net revenue per order ~58.3% +5pt depth $20.0M (flat units) (unchanged COGS) 27% -5.0% net revenue per order ~57.9%
One point of average depth costs ~1.7 points of contribution. The linear approximation holds for small moves; past 1-2 points the COGS-vs-shrinking-net-revenue math compresses the hit (the table shows 5 points lands at ~57.9% on net revenue, not 51.5%). The directional read still stands: every added point of routine depth eats into the entire DTC median net margin band.
Then layer the cohort economics. Discount depth and return rate are the two invisible margin lines that operators rarely manage in tandem; both show up as net-revenue erosion after the sale is booked. DTC median net margin runs 3-10%. Routine sitewide cadence above the 20-25% band flips first-purchase cohorts unprofitable because discount-acquired customers repeat at lower rates than full-price-acquired ones. On a 2025 customer-economics call, the framing we use is: "If I'm not canceling for the next six months, OK, I'll lose money on the first time. But I acquire you, and the LTV is going to go up." That works if the customer actually comes back at full price. Discount-acquired cohorts come back less often, at lower AOV, with shorter retention. The depth times penetration times cohort-LTV equation is where the real margin lives, not the headline depth.
The Simply Codes 2026 data compresses every category to 15-25% average depth with sub-1-point BFCM lift, the Salesforce Shopping Index pegs the cross-channel blended rate at 22% flat year-over-year, and the public 10-K disclosures confirm mid-single-digit AUR moves. The 30-50% headlines reference long-tail outliers. If you run your category against the actual benchmark, your normal sitewide cadence should sit in the 15-25% band, not above it.
What this means for your business at $5-150M revenue
Three actions for this quarter.
Stop matching competitor BFCM depths blindly. The Simply Codes 2026 data is clear: BFCM adds 0-1 point of depth in every category. The brands you are matching are not running 40% off across the board; they are running their normal 15-20% offer with deeper penetration. Build the offer (bundle, gift-with-purchase, subscriber-only, free shipping threshold) rather than push the headline percentage. A multi-category beauty/wellness DTC founder we work with put it simply on a 2025 strategy call: "we never discount that deep. Ever, ever." That brand outperforms category margin without matching peer headlines, because the offer carries the perceived value.
Run your normal cadence at 15-25% off and scale higher only with guardrails. Treat 25-30% sitewide as the ceiling, not the baseline. Reserve deeper offers for high-margin SKUs, lapsed-customer winback, low-LTV cohorts, or specific subscriber segments. Use minimum order value, exclusions, new-customer-only, and usage caps as guardrails so the depth does not bleed into the full-price baseline. A flat 30% promo with no guardrails becomes your normal cadence within a quarter.
Benchmark against the actual peer set, not the marketing copy. Pull AUR and markdown disclosures from 3-5 public 10-K peers in your category (Table 3 is your starter list). Compare your year-over-year AUR change to theirs. Refresh the comparison quarterly. The 25 public filings in this post all reported mid-single-digit AUR moves in 2026, not the 30-50% the BFCM coverage implies. Anchoring on the disclosure pulls your cadence back to the band the data actually supports.
Sources and methodology
Simply Codes 2026 State of Coupon Codes. Tracks the best-available percentage-off promo codes across roughly 93,000 retailers in 2023-2025 trailing data, reporting median, mean, percentile distribution, and category cuts. Key 2026 numbers: median 15% off (all months, all categories), mean 19.5%, middle-50% range 10-25%. Category-level BFCM lifts: electronics 0.0pt, apparel +0.1pt, beauty essentially flat, home and garden 0.0pt, sports and outdoors +0.8pt. December moves the median from 15% to 20%. AI and software category averages roughly 30% (the deepest category but with the lowest code inventory). The strongest single primary source for "average discount rate by vertical" because it is category-tagged at merchant scale.
Salesforce Shopping Index. Blended average discount rate across Salesforce Commerce Cloud transactions (1 billion+ shoppers, top retailers). Latest quarter: 22%, flat year-over-year. Used as the cross-channel blended number to contrast with the Simply Codes best-available code number. The two measure different things: Salesforce blends every transaction (full-price and promo) and Simply Codes measures the deepest code per merchant.
Adobe Digital Economy Index, Cyber Week 2025 wrap. Adobe Analytics measures discount depth as (1 minus net price divided by list price) across the Adobe Analytics customer base (top retailers). Cyber Week 2025 covered November 27 to December 2. Vertical-level peak depths: electronics 30.1%, toys 27.8%, apparel 23.2%, computers 22.6%, TVs 19.9%, furniture and bedding 19.7%, sporting goods 18.8%, appliances 16.9%, personal care 12.5%, grocery 12.3%. Methodology limitation: Adobe DEI skews to larger retailers, so the peak numbers run deeper than median Shopify-store reality.
BLS Consumer Price Index, apparel and furniture/bedding. Pulled via the BLS public API, series CUUR0000SAA (apparel, 1982-84=100) and CUUR0000SEHF (furniture and bedding, 1982-84=100). Date range January 2024 through April 2026. April 2026 apparel CPI was 138.07 vs 132.54 a year earlier, +4.2% YoY. April 2026 furniture CPI was 295.7 vs 280.6, +5.4% YoY. October 2025 BLS data is unavailable due to the 2025 federal appropriations lapse. CPI measures sticker price, not net AUR; the gap between CPI growth and net AUR (where reported in 10-K filings) is the implied discount-depth expansion.
US Census Monthly Retail Trade Survey (MRTS). Series category_code=4541 (electronic shopping and mail-order houses, NAICS 4541), data_type_code=SM (sales in millions), seasonally adjusted. Endpoint https://api.census.gov/data/timeseries/eits/mrts. Pulled January 2024 through March 2026 (27 months). March 2026 was $128.4B vs $116.0B a year earlier, +10.6% YoY. Used as volume context: discounting at scale on bigger numbers.
SEC EDGAR full-text search. Two queries: (1) "promotional environment" OR "elevated promotional activity" OR "discount depth" with forms=10-K/10-Q, 2026-01-01 to 2026-05-29, returning 28 results filtered to 14 DTC and consumer-relevant filings; (2) "average unit retail" AND "discount" with same date range, returning 23 results mostly in apparel and home. Cross-referenced and de-duplicated to 25 reference filings retained in Table 3. EDGAR does not publish discount depth as a structured field; these are narrative MD&A disclosures, so the data is qualitative ("elevated," "promotional environment remains challenging") except where AUR or markdown rate is disclosed numerically.
Limitations. No single primary-source dataset publishes "average discount depth by vertical" as a structured number. Every figure in this post traces to either (i) Adobe DEI peak measurement (specific window), (ii) public-company markdown rate disclosed in 10-K MD&A (specific brand), or (iii) multi-source synthesis (Simply Codes plus Salesforce plus EDGAR narrative). "Average discount depth" can mean two things: depth on discounted orders, or weighted average across all orders. Adobe uses the first; the worked example in the Table 4 scenario uses the second. The two are not interchangeable. BLS CPI is a sticker-price index, not an ecommerce-specific discount measure; used here as macro context only. This post is refreshed quarterly. The bundle drafted from new-blogs/to-be-published/average-ecommerce-discount-rate-by-vertical-2026/research.md. Next refresh target: 2026-08-29.
Frequently asked questions
what's the average discount rate in ecommerce right now and how does my vertical compare?
The 2026 trailing-12-month median across 93,000 merchants is 15% off, the average is 19.5%, and the cross-channel blended rate from Salesforce is 22% (flat year-over-year). Your vertical sits within a few points of that band: apparel, beauty, home, and sports all cluster around 19-20% average depth; electronics runs lower at 17.9%; AI and software runs deepest at ~30%. If you are above 25% sitewide as your normal cadence you are running deeper than your category.
is apparel really running 30-50% off as the structural average or is that just bfcm?
Just BFCM and Cyber Week peaks, and even those numbers are softer than they sound. Simply Codes' trailing-12-month apparel average is ~20% off with a 15% median. Adobe's Cyber Week 2025 apparel peak was 23.2%. The 30-50% numbers in marketing copy reference long-tail offers (a minority of merchants hitting deeper discount), not the structural average. If you cite Cyber Week peaks as your year-round benchmark you will over-discount by roughly 10 points.
how much margin do i actually lose for each point i add to my average discount depth?
Roughly 1.7 points of contribution per added point of depth at a 60% gross margin, for small moves. The math: a 1% drop in net revenue per order with COGS unchanged drops contribution from 60% to ~58.3%. The linear approximation compresses past 1-2 points (COGS stays fixed against a shrinking net-revenue base): 5 added points of average depth on a $20M brand at 60% GM lands contribution near 57.9% on net revenue, not 51.5%. Either way the cash drag is meaningful versus the DTC median net margin band of 3-10%.
should i be matching competitor promos in my vertical or holding margin and accepting flat top-line?
Hold the depth and fix the offer instead. The Simply Codes data shows BFCM adds less than 1 point of depth in every category tested, which means the brands you are trying to match are getting the orders at their normal offer, not at the headline 40%. Build a bundle, a gift-with-purchase, or a subscriber-only offer that carries the perceived value without breaking your net average unit retail. Match the perceived offer, not the percentage.
what's the difference between promo depth and promo penetration and why does it matter?
Promo depth is the percentage off when a code is used. Promo penetration is the share of orders that use any code. The Simply Codes data measures depth (flat year-round); the gross-margin hit operators feel during BFCM is mostly penetration moving (more orders use the code, even if the code itself is the same). When you plan your November P&L, model both: depth times penetration times average order value times unit volume. Depth alone underestimates the margin hit by half.
is subscribe-and-save 10-15% a discount i should count against gross margin or a customer-acquisition cost?
Count it against gross margin in your unit economics, then map it to retention not acquisition in your cohort model. Subscribe-and-save buys you predictable repeat revenue and lower CAC over time, but the 10-15% comes off contribution every order forever. If your full-price cohort throws off a 60% contribution and your subscriber cohort throws off 48-50%, the difference is real cash and needs to clear a higher repeat-rate hurdle to be worth it.
how often should i re-benchmark my discount rate against the vertical?
Quarterly. Simply Codes refreshes annually, Salesforce monthly, Adobe at Cyber Week, public 10-K filings rolling. A quarterly cadence catches structural shifts (the 2026 tariff-driven sticker rise plus expanded promo depth) without overreacting to month-to-month noise. The exception is November and December: re-check your category against Simply Codes and Adobe holiday data within 48 hours of the wrap so your January cadence reflects what your peers actually ran.
how do i benchmark my discount depth against public dtc brands in my vertical?
Pull the 10-K MD&A from 3-5 public peers in your category and search for "average unit retail," "markdown rate," or "promotional environment." The 25 filings in Table 3 (Gap, AEO, Carter's, Abercrombie, Ralph Lauren, Capri, Signet, Bob's Discount Furniture, Honest Company, Vita Coco, others) all disclosed mid-single-digit AUR or markdown movements in 2026. Compare your year-over-year AUR change to theirs. Bigger gap than the public peers means you are over-discounting; smaller gap means you have headroom.