
eCommerce
Average ecommerce loyalty program adoption by vertical (2026): supplements, beauty, and food lead; electronics and home goods don't
Supplements, beauty, and food brands see the highest loyalty program adoption because repurchase cycles are short and product switching costs are low. Electronics and home goods show low adoption because customers do not repurchase often enough for points to matter. Before building a loyalty program, check your repurchase rate. If fewer than 30% of customers buy twice, a loyalty program is a retention distraction, not a retention solution.
Key Takeaways
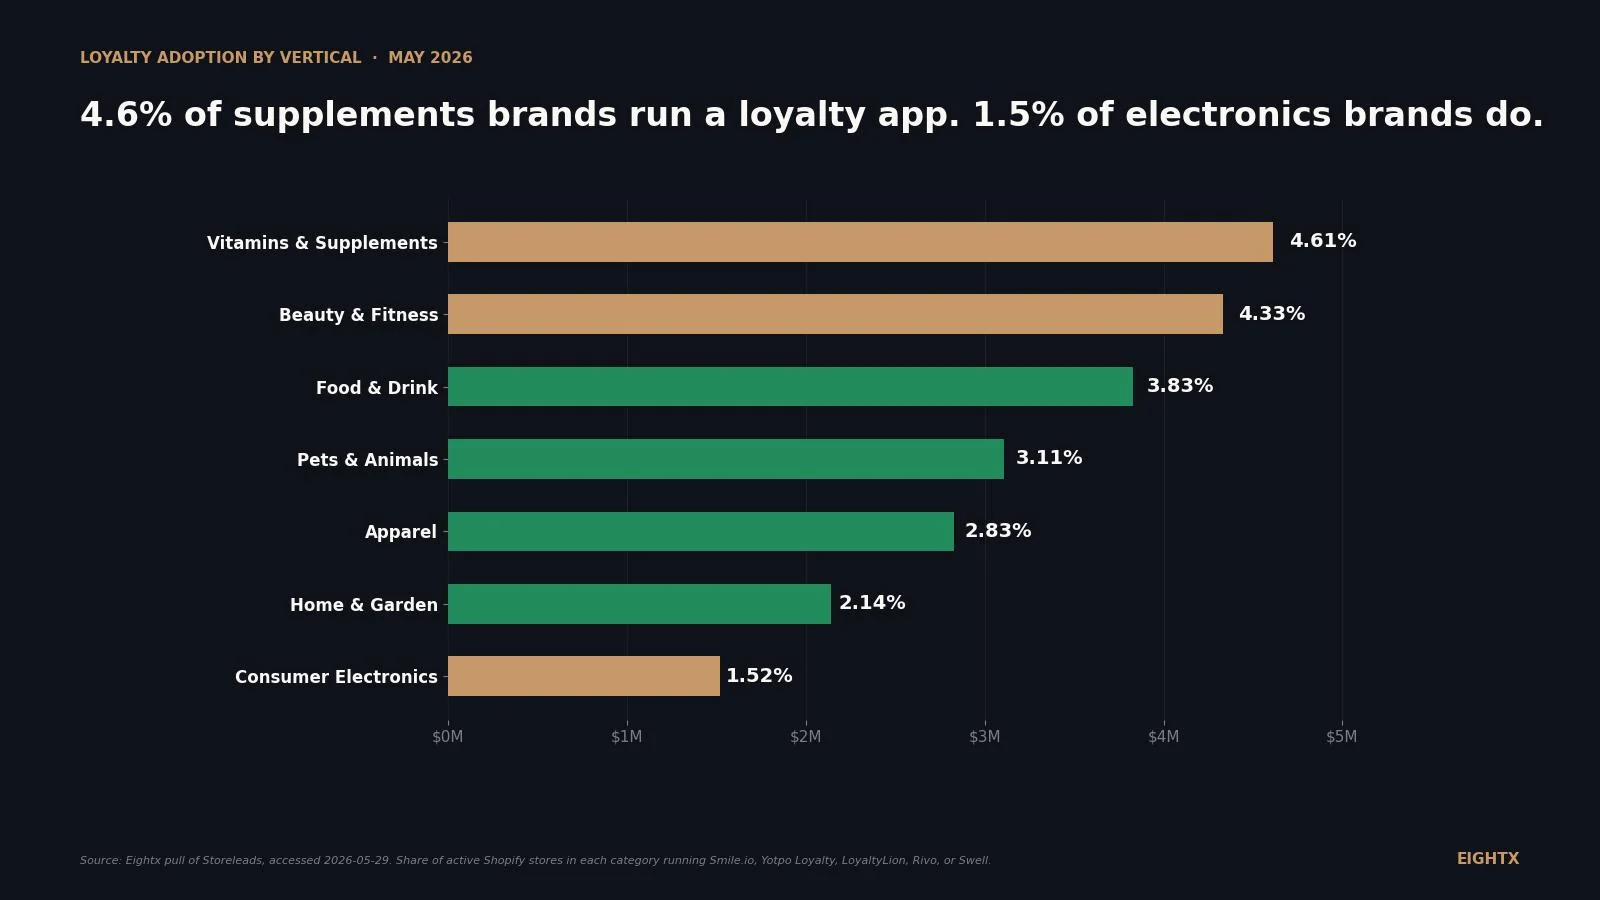
- Only 1.5% to 4.6% of Shopify brands run a loyalty app, depending on vertical. Storeleads (3.59M stores, accessed 2026-05-29) shows Vitamins & Supplements at 4.61%, Beauty & Fitness at 4.33%, Food & Drink at 3.83%, Apparel at 2.83%, Home & Garden at 2.14%, and Consumer Electronics at 1.52%. The operator-side market is far less saturated than the consumer-side narrative suggests.
- Consumer enrollment is saturated. Brand install is not. 92% of US consumers belong to at least one program (EY 2025). 100% of LoyaltyLion's surveyed consumers actively engage with at least one program in 2026, up from 91% in 2025. Your real lever isn't whether shoppers are enrolled in anything. It's whether your brand earns one of their 1 to 4 active slots.
- Loyalty lifts repeat-purchase rate 9 to 17 percentage points, but the absolute gain is biggest in consumables. Health & supplements: 42% to 58%. Pet: 40% to 56%. Food & beverage: 38% to 55%. Beauty: 35% to 52%. Apparel: 25% to 38%. Electronics: 15% to 24% (the relative lift looks high but it's on a tiny base).
- Beauty members spend 66% more revenue in 90 days. Health members 57%. Apparel 50%. (Yotpo, 2022 to 2023 cohort.) e.l.f. Beauty's Beauty Squad alone drives ~80% of elfcosmetics.com revenue from 4.8M members (8-K, FY2024 Q3). The 80/20 rule is empirically real in beauty.
- In supplements and pet, the loyalty mechanic is shifting from points to auto-ship. 52% of US pet parents now use subscriptions (up from 46% in 2023). Chewy runs ~78% of revenue through auto-ship. If you're in a consumable category, a points program installed on top of a working subscription is double-loyalty; pick one.
The most-quoted loyalty stat on the internet ("92% of US consumers belong to at least one loyalty program," EY 2025) is the wrong baseline for an operator deciding whether to install Smile.io or Yotpo Loyalty next quarter. The right cut splits two ways: how many consumers in your category are enrolled in any program (saturated, north of 80% in most retail categories), and how many brands in your vertical actually run one (between 1.5% and 4.6% on Shopify, depending on category). The second number is the operator number. Almost no one publishes it.
We pulled it ourselves. Across 3.59 million active Shopify stores tracked by Storeleads (accessed 2026-05-29), we counted brands running one of the five major loyalty apps (Smile.io, Yotpo Loyalty, LoyaltyLion, Rivo, Swell) by vertical. Vitamins & Supplements lead at 4.61%. Beauty & Fitness 4.33%. Food & Drink 3.83%. Apparel 2.83%. Home & Garden 2.14%. Consumer Electronics 1.52%. That's the install penetration story. Pair it with what loyalty actually returns by category, and the decision tree gets sharp.
Two numbers, not one: the operator vs. the consumer view
When loyalty research gets reported, it almost always reports the consumer side. "90% of US online adults belong to at least one retail loyalty program" (Forrester 2024). "100% of consumers surveyed actively engage with at least one program in 2026, up from 91% in 2025" (LoyaltyLion 2026). The average consumer is enrolled in 17 programs and active in roughly half (Clarus Commerce 2025).
That's the consumer baseline. It is saturated. It is also the wrong number for an operator deciding whether to install a points app, because it includes grocery cards, credit-card cashback, hotel loyalty, and airline programs that don't compete for your installable-app decision. The number that matters is what percent of brands in your vertical actually run a loyalty program, because that's the install-rate benchmark you'd be measuring yourself against.
That brand-side cut is what nobody publishes. It's also what we calculated below.
Brand install penetration on Shopify, by vertical (Storeleads, 2026)
Across 3.59M active Shopify stores, fewer than 1 in 20 run a major loyalty app in even the highest-penetration vertical. Vitamins & Supplements leads at 4.61%. Consumer Electronics trails at 1.52%, three times less.
The raw counts are below. This is the dataset behind the chart.
Vertical Stores with loyalty app Total Shopify stores Install rate Vitamins & Supplements 2,268 49,255 4.61% Beauty & Fitness 14,223 328,508 4.33% Food & Drink 8,093 211,257 3.83% Health (all) 4,644 137,831 3.37% Pets & Animals 2,257 72,484 3.11% Apparel 23,489 829,687 2.83% Sports 2,924 113,557 2.58% Home & Garden 7,542 352,479 2.14% Consumer Electronics 830 54,488 1.52%
Two reads. First, the operator-side market is far less saturated than the consumer-side narrative implies. Even in beauty (the highest-engagement vertical for loyalty), 96% of Shopify brands don't run one of the five major apps. The category is open. Second, the spread across verticals is real and predictable: consumables (supplements, beauty, food, pet) install at 2.5x to 3x the rate of low-frequency categories (electronics, home goods). Purchase frequency is the gating factor.
A limitation worth disclosing upfront. The Storeleads dataset is Shopify-only, which is roughly 30% to 35% of global ecommerce by store count. It misses Magento, BigCommerce, WooCommerce, and headless brands. The five apps we tracked also exclude subscription tools (Recharge, Loop, Skio, Smartrr) and BNPL "loyalty" (Affirm rewards). If you add subscription apps to the denominator, supplements and pet install rates rise meaningfully because most of their retention runs through subs, not points.
Consumer enrollment by vertical: the 2024 baseline most people quote
This is where most "loyalty by vertical" benchmarks live. Consumer surveys ask: what percent of category shoppers are enrolled in any program in that vertical? The synthesis below aggregates Forrester, Statista, and Visa survey data.
Vertical Consumer enrollment Source Clothing / Fashion 54% Forrester Consumer Benchmark 2024 Grocery / Supermarket (global) 47% Visa / Statista 2023 Beauty / Skincare 42% Forrester Consumer Benchmark 2024 CPG 40% Forrester Consumer Benchmark 2024 Restaurant / Food delivery 35-48% Forrester / PYMNTS 2025 Tech / Electronics 32% Forrester Consumer Benchmark 2024 Travel / Hospitality 24% Forrester Consumer Benchmark 2024 Sports / Recreation 21% Forrester Consumer Benchmark 2024 Car rental (global) 8.7% Visa / Statista 2023
Two things to note. Fashion / apparel has the highest consumer enrollment (54%) but only a 2.83% brand install rate on Shopify. That gap (high consumer demand, low brand supply) is the largest operator opportunity on this page if you're an apparel brand. The flip side: electronics has 32% consumer enrollment but the brands themselves install at 1.5%, mostly because the underlying repeat economics don't support the program cost.
What loyalty actually returns: the 90-day revenue uplift
Yotpo's Loyalty Program Benchmarks report is the most-quoted operator-side benchmark on per-vertical revenue uplift. Members who redeem at least once spend materially more in the 90 days post-enrollment than non-redeeming customers in the same cohort.
The number to anchor on. Beauty members spend 66.3% more in 90 days. Health members 56.7%. Apparel members 50.2%. Yotpo's public benchmark only covers those three verticals, but the directional finding (consumables and high-frequency categories see the largest 90-day uplift) holds across other vendor benchmarks.
The single best public-company anchor in this dataset is e.l.f. Beauty. From their Q3 FY2024 8-K filing: Beauty Squad members grew 30% year-over-year to 4.8 million, and the program drives approximately 80% of elfcosmetics.com sales. A loyalty program with 4.8M enrolled members producing 80% of channel revenue is the proof point for beauty as a category. Yotpo's benchmark cohort runs 2022 to 2023 and has not been refreshed publicly for 2024, so treat the +66% beauty number as the directional ceiling on what a working program can return rather than the precise 2026 number.
What it actually lifts: repeat-purchase rate, with vs. without
The Yotpo 90-day uplift answers "how much do members outspend non-members." The repeat-purchase comparison answers "does the program move the channel-level repeat rate." Both matter.
The operator read. Health & supplements lifts from 42% to 58% (+16 percentage points). Pet from 40% to 56% (+16). Food & beverage 38% to 55% (+17). Beauty 35% to 52% (+17). Apparel 25% to 38% (+13). Electronics 15% to 24% (+9). The absolute and the relative lift are both largest in consumables. The lift in electronics is small in absolute terms because the base is so low; the relative move (60% increase) is real, but on a 15% base it doesn't move the unit economics enough to fund the program.
The mental model. Loyalty is a multiplier on whatever repeat behavior already exists in your category. If consumers already come back, loyalty compounds. If they don't (electronics, home goods, luxury), loyalty doesn't manufacture frequency that the product can't earn.
The verticals where loyalty doesn't work, and what to do instead
Three categories sit below the threshold where a standard points program returns enough to justify the install: luxury fashion (9.9% Shopify repeat-customer rate per Rivo 2026), home goods and furniture (14.7%), and electronics (18.0%). In these categories, only 30% of furniture retailers offer any loyalty or membership program vs 71% in retail overall (Annex Cloud / Home Accents Today 2024). That gap is real and structural.
If you're in one of those verticals, the playbook isn't "install Smile.io anyway." It's:
- Referrals over points. A high-AOV, low-frequency purchase makes the next purchaser more valuable than the current one. Referral-driven CAC is the right mechanic. ReferralCandy, Friendbuy, or Refersion are the usual stack.
- VIP service over discounts. Crate & Barrel reports +18% spend from members; Wayfair reports 2.5x member spend; IKEA Family drives 58% of sales. The mechanic in furniture is usually concierge / membership / financing, not points.
- Financing over redemption. Affirm, Affirm Adaptive, and Klarna integrations move the needle in high-AOV categories because they remove the AOV friction, which is the actual conversion blocker.
You can still run a basic referral or store-credit program on Smile.io's free or starter tier. Just don't expect the 50% to 66% 90-day uplift Yotpo reports for beauty. The category won't return it.
The 2026 shift: points giving way to subscriptions in consumables
The interesting structural shift in 2025 to 2026 is that in supplements and pet, the loyalty mechanic is moving from points to auto-ship. The end state (recurring revenue from a retained customer) is the same. The mechanic is cleaner.
The numbers. 52% of US pet parents now use subscription purchasing (Pet Food Processing 2024, up from 46% in 2023). Chewy reports roughly 78% of sales come through auto-ship and ~90% of revenue from existing customers in their 10-K filings and IR materials. Pet subscription grew 35% to 45% year-over-year in 2024. In supplements, the dominant retention mechanic for $5M+ DTC brands is now Recharge or Skio subscription, with a tier program layered on top to gate extras (sample drops, member-only flavors).
What that means for an operator in a consumable category. If you're choosing between launching a points program and tightening your subscription program, fix the subscription first. The 9 to 17 point repeat-rate lift from a points program is real, but it doesn't stack neatly on top of an auto-ship that already drives 60% to 80% repeat behavior. The math is double-counting the same returning customer. Points work best where subscription doesn't fit (apparel, beauty drops, accessories), or as a thin tier-benefit layer that rewards subscription members for staying enrolled.
The consumer-side loyalty story is saturated. 92% of US consumers belong to a program; nearly half belong to more than five. The operator-side story isn't. Fewer than 5% of Shopify brands in any vertical run a major loyalty app, and the spread by category (1.5% electronics to 4.6% supplements) maps directly to repeat-purchase economics. Pick the category-correct mechanic (points in apparel and beauty, subscription in consumables, referrals in furniture) and the math works. Default to points everywhere and you'll under-perform the benchmark.
What to do this quarter if you're between $5M and $50M GMV
Three moves.
Check your category's install rate against the Storeleads benchmark above. If you're in supplements at $5M GMV and your peer set is at 4.6% install, you're not "early," you're behind. If you're in electronics or home goods, the benchmark is 1.5% to 2.1%; the absence of a program is the median, not a gap.
Pressure-test your repeat-purchase rate before installing. The Shopify cross-industry average is 28.2% (Rivo 2026). If you're below your vertical's baseline (beauty 35%, supplements 42%, pet 40%), fix the retention drivers first. Loyalty is a multiplier; it doesn't manufacture base demand. Reasons customers don't come back: product-fit gaps, post-purchase experience, weak onboarding. None of those are solved by points.
Match the mechanic to the category. Apparel, beauty, accessories: points and tiers (Smile, Yotpo, LoyaltyLion). Supplements, pet, food: subscription first (Recharge, Skio, Loop), with a thin tier layer for non-consumable drops. Electronics, home, furniture: referrals + financing, not points.
For more on retention math by vertical, see our average subscription churn rate by category and the average LTV: subscription vs one-time post. If you're stress-testing whether your current LTV justifies the program install, the LTV:CAC ratio guide is the companion post.
Sources and methodology
Storeleads (original data). For each vertical (Beauty & Fitness, Apparel, Food & Drink, Vitamins & Supplements, Pets & Animals, Health, Sports, Home & Garden, Consumer Electronics), two store-search queries were run. The first filtered platform=shopify plus category= to return total active Shopify stores in that category. The second added app_name=shopify.smile-io,shopify.swell,shopify.loyaltylion,shopify.rivo-loyalty-rewards-referrals,shopify.yotpo-loyalty-and-referrals with app_name_op=or, returning stores running at least one of the five major loyalty apps. Install rate equals the second total divided by the first. Stores running multiple loyalty apps are counted once (Storeleads dedupes at the store level). Storeleads category assignment is automated from store metadata; some stores carry multiple categories, so vertical totals are not strictly additive. Pull date 2026-05-29.
Consumer enrollment by vertical. Sourced from a 2025 loyalty-statistics aggregation, which synthesises Forrester Consumer Benchmark Survey 2024, Statista, Visa's April 2023 global loyalty survey, Clarus Commerce, and the National Restaurant Association. The Forrester per-vertical numbers (clothing 54%, beauty 42%, CPG 40%, electronics 32%) are from a US online-adult survey. The Visa numbers (grocery 47%, car rental 8.7%) are global.
Shopify repeat-customer rate by vertical. Rivo's "Shopify Customer Retention Rate: 2026 Benchmarks by Industry," which synthesises Shopify Enterprise, Envive AI and UpCounting data. Sample sizes not disclosed; treat as directional. Cross-industry average 28.2%.
90-day revenue uplift per redeeming customer. Yotpo Loyalty Program Benchmarks Report, last updated August 2023, covering the 2022 to 2023 customer cohort. Beauty +66.3%, Health +56.7%, Apparel & Accessories +50.2%. Yotpo customers only; sample size not disclosed.
Repeat-purchase rate with vs without loyalty. easyappsecom "Shopify Rewards Program Statistics 2026," aggregating Bond Brand Loyalty 2025 plus multiple loyalty vendor benchmarks. The Bond 58% prompt-to-join figure and the +72% enrollment lift from instant signup bonuses are cited from the same aggregator. Treat as directional.
Company anchors. e.l.f. Beauty FY2024 Q3 8-K (Beauty Squad 4.8M members, ~80% of elfcosmetics.com revenue). Chewy 10-K / IR materials (~78% auto-ship, ~90% revenue from existing customers). Pet Food Processing 2024 (52% of US pet parents use subscription, up from 46%). Annex Cloud / Home Accents Today 2024 (30% of furniture retailers run loyalty vs 71% retail overall; IKEA Family 58% of sales; Crate & Barrel +18% member spend; Wayfair 2.5x member spend).
Limitations. Storeleads is Shopify-only (roughly 30% to 35% of global ecommerce by store count). The five tracked loyalty apps cover the major points-based mechanic; subscription loyalty (Recharge, Loop, Skio, Smartrr) and BNPL rewards (Affirm) are not in the denominator, which understates retention-tooling penetration in consumable categories. Consumer-enrollment numbers from Forrester include retailer-card and grocery programs that don't compete for an installable-app decision, which overstates the "should I bother" signal for a Shopify operator. Yotpo's 90-day uplift figures are from the 2022 to 2023 cohort and we couldn't confirm whether a 2024 refresh changed them.
Update cadence. This is a living index, refreshed quarterly. The Storeleads pull, consumer-enrollment table, and repeat-rate uplift cuts are all candidates for refresh on the next cycle. Next update target: August 2026.
Frequently asked questions
is launching a loyalty program even worth it for my vertical?
Depends on whether you're in a consumable. Beauty, supplements, pet, and food / beverage see 13 to 17 percentage points of repeat-purchase lift from a working program. Apparel sees 13 points but on a lower base. Electronics sees 9 points on a 15% base, which is usually not worth the integration cost. Use Storeleads to check your category's install rate first. If you're in supplements at $5M GMV and your peer set is at 4.6% install, you're behind.
what's the average loyalty program enrollment rate by industry in 2026?
Two numbers. Consumer-side, ~58% of customers accept enrollment when prompted at checkout (Bond Brand Loyalty 2025). Active engagement after enrollment is ~31% of those members. Brand-side install penetration on Shopify ranges from 1.5% (consumer electronics) to 4.6% (vitamins and supplements) per Storeleads. The headline 'X% of consumers belong to a loyalty program' stat overstates the operator opportunity because it counts grocery and credit-card programs that don't compete for your installable-app decision.
should i use smile.io, yotpo, or loyaltylion if i'm at $5m to $50m on shopify?
At under $5M GMV, Smile.io is usually the answer because it's Shopify-first, sub-$200/month at most tiers, and integrates without dev work. From $5M to $25M, Yotpo is the typical pick because it bundles reviews, SMS, and loyalty so you're consolidating tools. Above $25M with custom needs, LoyaltyLion is the enterprise pick. None of these will outperform a working subscription program in a consumable category, so check Recharge / Skio / Loop economics before installing points.
why is loyalty adoption so much higher in beauty than in electronics or home goods?
Purchase frequency. Beauty customers reorder in 30 to 90 days, supplements in 30 to 60. Furniture and electronics reorder in 2 to 7 years. A points program rewards cumulative spend, which only compounds when there's a next purchase to compound. The category sets a ceiling on what loyalty can return. That's why Storeleads shows electronics at 1.5% brand penetration and supplements at 4.6%.
what's a good benchmark for percent of revenue from loyalty members?
The cleanest public anchor is e.l.f. Beauty Squad at ~80% of elfcosmetics.com revenue (Q3 FY2024 8-K). Beyond that, vendors don't publish per-vertical revenue-share benchmarks. Rough cuts from our client base: beauty top-quartile sits 50 to 80%, apparel 35 to 55%, supplements 60 to 80% when loyalty and subscriptions run together. Treat those as operator cuts, not surveyed benchmarks. If you're under 25% of revenue from your loyalty members on Shopify, the program isn't earning the integration.
is paid loyalty (like amazon prime style) actually worth charging for a dtc brand?
Increasingly yes for high-frequency categories. 70% of consumers paid for at least one loyalty program in 2024 (up from 53% in 2023, Clarus Commerce). Paid members have ~68% active engagement vs ~31% for free programs. The right candidate brand has weekly to monthly purchase frequency, an exclusive perk that costs you under 10% of LTV to deliver, and enough scale to amortize the fulfillment promise. Don't ship a paid program if your repeat-purchase rate is still below the cross-industry 28% benchmark.
why are pet brands moving from points-based loyalty to subscriptions instead?
Auto-ship solves the same problem (recurring revenue from a retained customer) without the redemption-rate leakage of points. 52% of US pet parents now use subscription purchasing (Pet Food Processing 2024, up from 46% in 2023). Chewy runs about 78% of revenue through auto-ship and ~90% of revenue from existing customers. If your category's repeat purchase is consumable and predictable, subscription is the simpler mechanic. Reserve points for non-consumables and tier benefits.
what repeat purchase rate should i be hitting in my vertical before i bother with loyalty?
The Shopify cross-industry average is 28.2% (Rivo 2026). If you're below your vertical's baseline (beauty 35%, food and beverage 38%, supplements 42%, pet 40%), fix the retention drivers first. Reasons people don't come back: product fit, post-purchase experience, or onboarding. Loyalty doesn't fix any of those. It compounds returns when those are already working.