
eCommerce
Average ecommerce returns processing cost per item by vertical, 2026: $25-35 for soft goods, $55-90+ for large furniture
All-in returns processing cost per item runs $25 to $35 for apparel, $35 to $55 for electronics, and $55 to $90 or more for large furniture in 2026. These figures cover inbound freight, inspection, repackaging, and disposition. Optoro, Pitney Bowes, and BLS warehousing data anchor the ranges. At a 20% product return rate on a $60 item, apparel brands absorb up to $7 in returns cost per unit shipped.
Key Takeaways
- Modeled all-in cost per returned item by vertical, 2026: apparel and beauty $25-35, electronics $35-55, small home goods $35-65, large home and furniture $55-90+, luxury $40-80. Built from the Optoro 27%, Pitney Bowes 21% and Coresight-Optoro 66% published anchors.
- The 66% benchmark applies to apparel, not everything. Coresight Research plus an Optoro estimate puts apparel returns processing at roughly 66% of product price. ShipBob's $33 on a $50 apparel item lands at the same ratio. Cross-vertical, the Optoro 27% of purchase price and Pitney Bowes 21% of order value are the right anchors.
- Furniture flips the cost stack. Apparel returns are two-thirds labor and customer service. Large furniture returns are roughly half freight and one-quarter damage write-off. Same line item on your P&L, very different drivers.
- BLS warehousing PPI is up 54.6% since 2019; warehouse wages up 39.8%; employment 5.6% off peak. Your 3PL's input costs reset higher in 2022-2023 and have not come back. That is the structural reason your returns processing fee will go up at renewal even if your volume is flat.
- NRF and Happy Returns put 2024 US returns at $890B at a 16.9% return rate; the 2025 update prints $849.9B at 15.8% with online returns at 19.3%. Apply the 21-27% Optoro/Pitney processing ratio to the $890B macro and US industry-wide returns processing is roughly $187B to $240B per year ($890B × 21-27%). The line item is structurally underbudgeted in DTC under $20M ARR.
No public source publishes a clean, vertical-by-vertical dollar-per-returned-item cost table for 2026. The closest things in market are four anchors that all roughly agree on order of magnitude but diverge based on what is counted: the Optoro 27% of purchase price (Returns Unwrapped, 2024), the Pitney Bowes BOXpoll 21% of order value (US online retailers, medium and large brands), the Coresight Research + Optoro 66% of product price (apparel-focused), and the ShipBob illustrative $33 on a $50 item (also 66%). This post fills the gap operators reach for at board prep: a vertical-by-vertical mid-band cost table built from those anchors plus the BLS warehousing PPI and wage series, with the line-item math underneath. Modeled benchmark, not a directly published dataset. Numbers anchored to sources, gaps stated openly.
The three published anchors and why none of them is the whole answer
There are three anchors in the public conversation. The Optoro Returns Unwrapped 2024 figure says it costs an average of 27% of purchase price to process a returned item, erasing as much as 50% of sales margin. That is the cleanest cross-vertical ratio in market; multiply it against your average selling price and you get a single all-in cost number. A brand with $80 AOV runs roughly $21.60 in all-in returns cost per returned order at the Optoro ratio, before any recovery offset from secondary-market resale.
The Pitney Bowes BOXpoll number from medium and large US online and omnichannel retailers comes in at 21% of order value. That figure sits lower than Optoro's 27% because it captures the operator's reported processing line, not Optoro's broader purchase-price ratio that includes recovery offset. Treat 21% as your floor and 27% as your central case for cross-vertical modeling.
Coresight Research's 2023 apparel-focused work cites an Optoro estimate at 66% of product price for processing a returned apparel item. Coresight cross-checks that figure against its own apparel math: $155.8B US online apparel and footwear 2023 × 24.4% return rate = $38.0B returned merchandise, against $25.1B processing cost, equals 66%. ShipBob's reverse logistics FAQ uses the same 66% in dollar form: $33 to process the return of a $50 apparel item (a worked example, not survey data). Two independent sources at the same ratio is reasonable validation for the apparel upper bound. Optoro's Returns Unwrapped product is the lead anchor here; Optoro was acquired by Blue Yonder in August 2025 and there is no 2026 Optoro publication yet, so the 27% figure is from the 2024 release and is the most current cross-vertical anchor in market.
A note on denominators: these three published ratios are not on the same base. Optoro's 27% is of purchase price, Pitney's 21% is of order value (which includes shipping and tax across multi-item baskets), and Coresight's 66% is of product price (apparel-only). Order value, product price and purchase price diverge for any brand with shipping, tax or multi-item carts, which is part of why the published ratios differ. Hold the denominators distinct when you map any of them to your own P&L.
The cross-vertical Pitney 21% and Optoro 27%, the apparel-specific Coresight + ShipBob 66%, and NRF + Happy Returns' macro framing ($890B in 2024 US retail returns at a 16.9% return rate) all triangulate to the same underlying picture. Your central case sits at roughly 21-27% of order value cross-vertical, with apparel pulled higher by size-fit bracketing. The 2025 NRF + Happy Returns (UPS) update has total returns at $849.9B at 15.8% of sales, with online returns at 19.3%. That 2025 print is the freshest macro number; the $890B 2024 figure is still the most-cited anchor across operator coverage.
Anchor Published figure Scope Best-fit use Optoro 27% of purchase price 27% Cross-vertical retailer average Board-level cross-vertical benchmark Pitney Bowes BOXpoll 21% of order value 21% Medium and large US online + omni Floor for operator self-reporting Coresight + Optoro 66% of product price 66% Apparel-focused, gross processing cost Apparel and size-fit-heavy verticals ShipBob $33 on $50 $33 (66%) Single-SKU illustrative Sanity-check apparel modeling NRF + Happy Returns 2024 macro $890B / 16.9% US retail total, not processing cost TAM framing only
The vertical-by-vertical table that does not exist publicly
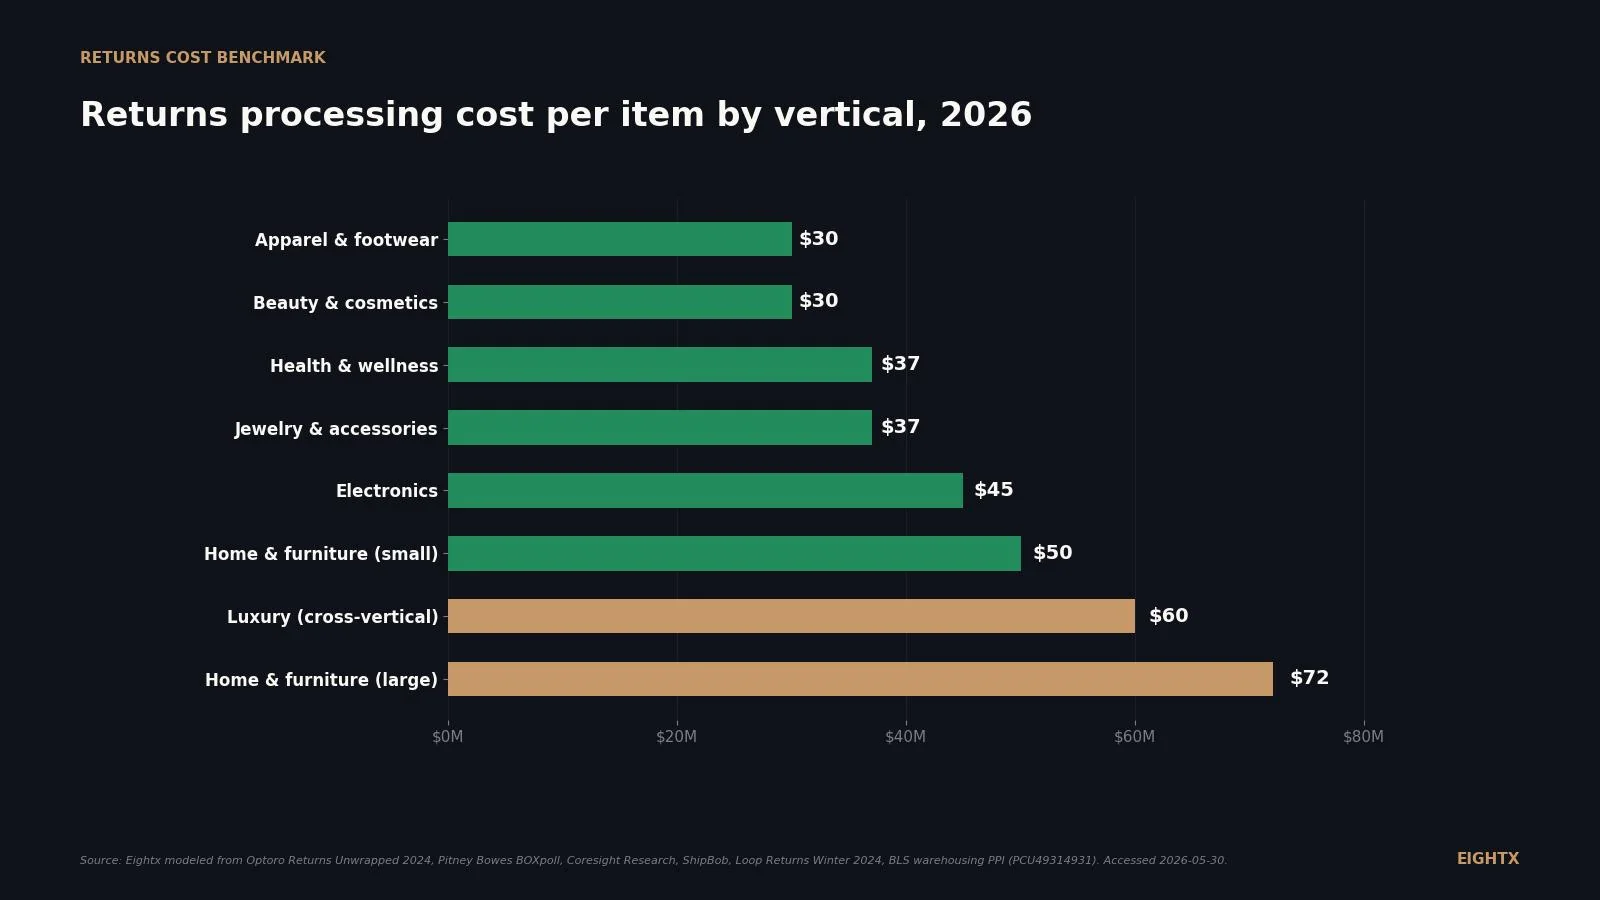
What operators need, and what nobody publishes, is the table below: mid-band all-in processing cost per returned item by ecommerce vertical for 2026, with the why-it-sits-there reasoning. The chart below visualises the mid-band. The data table below it gives the low, mid and high range plus the primary cost driver.
Vertical Cost-per-item low Cost-per-item mid Cost-per-item high Primary cost driver Apparel & footwear $25 $30 $35 Labor + size-fit bracketing Beauty & cosmetics $25 $30 $35 Hygiene write-off Health & wellness $30 $37 $45 Mixed (hygiene + device) Jewelry & accessories $30 $37 $45 Authentication + cleaning Electronics $35 $45 $55 Two-way freight + refurb Home & furniture (small) $35 $50 $65 Bulky soft goods Luxury (cross-vertical) $40 $60 $80 High ASP × moderate ratio Home & furniture (large) $55 $72 $90+ LTL freight + damage write-off
A few notes on how to read this table. The low band assumes a lean 3PL contract, parcel-friendly SKUs, high resellability, and low refund-fee retention. The high band assumes premium freight, write-down-prone inventory, and lower disposition recovery. The mid is what we see most often at $5-50M DTC brands working with mid-market 3PLs. Per-item dollar costs are sensitive to AOV: the mid-bands above assume representative AOVs by vertical of apparel $45, beauty $35, electronics $80, large furniture $300, jewelry $75, luxury $400, health and wellness $50. If your AOV diverges materially from these (a $120 AOV apparel brand or a $30 AOV jewelry brand), recalibrate against the relevant ratio (66% of product price for apparel, 21-27% of order value for cross-vertical) before you anchor planning to the mid-band.
The vertical with the most spread is large home and furniture. Loop Returns reported a 144% year-over-year jump in home goods return rate in its 2025 update, and Loop's 2024 Winter Benchmark put home goods handling fees at 17% of order value, the highest of any vertical in their dataset. Damaged inbound furniture often cannot be resold at full price; that write-down ends up in your COGS, not your shipping line, and is the most-missed component when a $25M home brand decomposes its returns P&L for the first time.
Inside one returned item: where the dollars actually go
The previous section was the cross-section. This one is the cost stack: where the dollars go inside a single returned item, by component, for apparel versus large furniture.
A few patterns to flag. Reverse shipping is the largest line in both cost stacks but its share inverts: 33% of apparel cost ($10 of $30) versus 44% of furniture cost ($32 of $72). The 3PL receive + inspect + restock line is roughly the same dollar amount on both ($7 vs $12), but a much smaller share of the furniture stack because freight and write-down dominate it. The unsellable or markdown write-down line is the one operators consistently underbudget: $4 on a $30 apparel return, $18 on a $72 furniture return. Branvas's 2026 cost benchmark decomposes the operational portion as reverse logistics $8-12, restocking labor $5-8, depreciation and storage $2-4, customer service $2-5, summing to $17-29 per return before write-down. Our $30 apparel figure sits at the upper end of Branvas's operational band, $72 furniture sits above it because the write-down line carries most of the difference.
Apparel returns are two-thirds labor and customer service. Large furniture returns are roughly half freight and one-quarter damage write-off. Same P&L line, very different drivers. If you book returns as one number, you cannot tell which lever to pull.
Why your processing cost will not fall back to 2019: the BLS warehousing data
The structural reason your 3PL fee resets higher each renewal sits in three BLS series.
The Producer Price Index for warehousing and storage (FRED series PCU49314931) hit 167.858 in April 2026, up 4.0% year-over-year and up 54.6% from January 2019. That index measures what the warehousing industry charges its customers, which is what your 3PL passes through to you. A return that cost $20 to process in 2019 costs roughly $30.90 today at full pass-through (real 3PL contracts typically pass through 50-80% of PPI, so treat $30.90 as the ceiling and the 50-80% band as the realistic range), before any category-specific cost layered on top.
The average hourly wage for warehousing production and nonsupervisory workers (BLS CEU4349300008) hit $25.83 in March 2026, up 5.7% YoY and up 39.8% from January 2019 ($18.47). Warehouse employment (BLS CES4349300001) sits at 1,830,700 jobs in April 2026, down 2.7% YoY and 5.6% below the April 2022 peak. Labor is more expensive AND scarcer than 2019.
The three series moving together is what gives 3PLs pricing power on your returns line. They are not gouging you. Their input costs are up structurally. Push back at renewal but expect the new floor to sit roughly 30-40% above 2019 quotes.
Series April 2026 value YoY Cumulative since Jan 2019 PPI Warehousing & Storage (PCU49314931) 167.858 index +4.0% +54.6% Warehouse avg hourly wage (CEU4349300008) $25.83 (Mar 2026) +5.7% +39.8% Warehouse employment (CES4349300001) 1,830,700 jobs -2.7% -5.6% off April 2022 peak NRF + Happy Returns 2024 US returns $890B (16.9% of sales) n/a +19.8% vs Optoro 2023 $743B
What this means for your P&L: the operator decision tree
Five things to do this quarter if your returns line has been creeping up.
Decompose returns into a five-line P&L row, not a single COGS-reserve estimate. Reverse shipping, 3PL receive + inspect + restock, write-down, payment-processor refund fee retention, customer service. Book monthly. From our client work (anonymized synthesis across ~13 operator segments, not a published benchmark), operators consistently discover the real cost is roughly twice their accounting estimate when they decompose the line this way for the first time.
Apply the right anchor by vertical. Apparel: 66% of product price (Coresight 2023 + Optoro). Cross-vertical and DTC blends: 21-27% of order value (Pitney Bowes / Optoro). Large furniture: build cost from freight ($25-35) + damage write-down ($15-25) + labor + CS, do not anchor to a ratio. Remember the denominators differ: don't mix Coresight's product-price ratio with Pitney's order-value ratio on the same brand without restating to one base.
Renegotiate the 3PL contract with BLS data, not gut. The PPI is up 54.6% since 2019, employment is below peak, wages are still climbing. Your 3PL has pricing power on inputs but has lost margin on volume. Push for line-item rate transparency at renewal (cost per receipt, cost per inspect, cost per put-away) and benchmark against 2-3 peer brands the same size.
Invest in sizing tech if you sell apparel. From our client work (anonymized synthesis across ~13 operator segments, not a published benchmark), operators that ship fit predictors typically see 15-25% return-rate reduction on sized SKUs within six months. Payback is typically inside four months at $5M+ ARR. Same as last year: highest-ROI returns lever we see in soft goods.
Charge a return fee if you are over $3M revenue (with category-mix caveat). Loop's 2025 update has roughly 70% of merchants charging fees at $9 average. From our client work (anonymized synthesis across ~13 operator segments, not a published benchmark), switching from free to paid returns drops return rate 12-25% inside 60 days with a 2-5% conversion-rate hit on the way in, net P&L positive at scale. The lever does not work the same across verticals: Loop's 2025 update flagged electronics return rates dropping 28% YoY while apparel rose 8%, so paid returns bites harder on electronics + home and softer on apparel where bracketing is structural. Test on your category mix first; under $3M still building repeat behaviour, hold the free-returns position.
For more on related operator levers and benchmarks, see our average ecommerce return rate pillar (return rates by vertical and channel), our DTC layoff and hiring tracker (same BLS warehousing series, labor lens), and our fractional CFO for ecommerce overview for how we work through returns P&L decomposition on weekly calls.
Sources and methodology
Cross-vertical anchors. The Optoro Returns Unwrapped 2024 release published the 27%-of-purchase-price figure as a cross-vertical retailer average. The Pitney Bowes BOXpoll investor news release reported 21% of order value for medium and large US online and omnichannel brands. The Coresight Research apparel report cites an Optoro estimate at 66% of product price for apparel returns, cross-checked against Coresight's own math of $155.8B US online apparel 2023 × 24.4% return rate = $38.0B returned merchandise versus $25.1B processing cost. ShipBob's Reverse Logistics FAQ cites the same 66% ratio in dollar form: $33 to process a returned $50 apparel item.
Macro framing. The NRF + Happy Returns 2024 Consumer Returns in the Retail Industry report puts US retail returns at $890B at a 16.9% return rate. The 2025 update from NRF + Happy Returns (UPS) forecast $849.9B at 15.8% of sales with an online return rate near 19.3%. Apply the 21-27% Optoro/Pitney ratio against the $890B macro number and US-wide returns processing cost is roughly $187B to $240B annually.
BLS macro inputs. Warehousing producer prices are from FRED series PCU49314931 (Producer Price Index by Industry: Warehousing and Storage, NSA, Index Dec 2006=100), 167.858 in April 2026, +4.0% YoY, +54.6% since January 2019. Warehousing average hourly earnings are from BLS series CEU4349300008 (production and nonsupervisory employees), $25.83 in March 2026 preliminary, +5.7% YoY, +39.8% since January 2019. Warehousing employment is from BLS CES4349300001, 1,830,700 in April 2026 preliminary, down 2.7% YoY and 5.6% off the April 2022 peak.
Component decomposition. The cost-stack figures in Chart 3 are modeled from Branvas's 2026 ecommerce returns benchmark (reverse shipping $8-12, restocking labor $5-8, depreciation and storage $2-4, customer service $2-5, total $17-29 per return blended), cross-checked against ShipBob's $33 illustrative apparel return and ReverseLogix's 20-65% of item value range. Furniture LTL freight and damage write-down ratios are calibrated against Loop Returns Winter 2024 Benchmark home goods handling-fee data (17% of order value, highest of any vertical Loop tracks) and Loop's 2025 update noting a 144% YoY rise in home goods return rate.
Triangulation cross-check. A Parallel.ai deep-research run (run_id trun_6bebc15578ef4c38b1d999a7f88a6908, 2026-05-30) synthesized per-vertical figures from Optoro State of Retail Returns 2024, Happy Returns 2025 NRF report, Revize 2026 ($10-$45 per return blended), and ReturnZap Shopify benchmarks. Parallel's vertical synthesis: apparel $26, beauty $22, electronics $80, homewares/furniture $52, health/wellness $25.50, jewelry $29, luxury $144. Our mid-band sits below Parallel's electronics ($80 vs our $45) and well below their luxury figure ($144 vs our $60); the difference is Parallel loads refurb-heavy electronics returns and full brand-protection destruction cost on the luxury cell, while our band assumes resale recovery on luxury and a typical electronics return mix rather than refurb-skewed. Use our mid-band for budgeting and Parallel's electronics and luxury figures for upper-bound stress testing.
Limitations. This is a modeled benchmark, not a directly published dataset. The vertical table anchors against published sources at every cell, but the per-vertical dollar values are interpolated, not surveyed. Per-item costs are sensitive to your specific AOV, 3PL contract, freight zones, return mode (mail-in vs box-free) and disposition policy. Treat the mid-band as your planning case and the low/high as your scenario bounds, then decompose your actual line items and compare. The Optoro Returns Unwrapped product was acquired by Blue Yonder in August 2025; if there is no 2026 Optoro publication for the next refresh, this post falls back to FRED + BLS + NRF + Loop as the update sources.
Update cadence. This is a Group A living-index post. Quarterly refresh expected: re-pull FRED PCU49314931, BLS CEU4349300008 and CES4349300001, check for new NRF, Optoro/Blue Yonder, Loop and Happy Returns releases, and update Chart 1 and the table if any vertical-specific anchor moves materially. Next refresh target: August 2026.
Frequently asked questions
how much does it actually cost to process a returned item in 2026?
Cross-vertical mid-band is roughly $25-50 per returned item. Apparel and beauty land around $30. Electronics sit around $45. Large home and furniture run $55-90+. Use the Optoro 27% of purchase price benchmark as a cross-vertical sanity check and the Pitney Bowes 21% of order value figure as your floor.
why is the apparel returns processing cost so much higher per item than the optoro 27 percent average suggests?
Apparel buyers bracket. One customer orders three sizes, keeps one and returns two. Revenue books once but you process two returns per order, each with shipping, labor and a chance of write-off. That is why Coresight's apparel-specific math and ShipBob's $33-on-$50 anchor both land near 66 percent of product price for apparel, even though the cross-vertical average is 27 percent.
what is included in returns processing cost: is it just shipping or also labor and write-offs?
All-in. Reverse shipping is usually the biggest line. Then the 3PL receive plus inspect plus restock fee. Then customer service overhead. Then unsellable or markdown write-down (this is the line operators under $20M ARR consistently miss). Finally payment processor refund fee retention and packaging. Branvas decomposes the operational portion as $17-29 per return blended; lost margin sits on top.
how much does it cost to process a returned furniture or home goods item vs apparel?
About 2.4 times more for large furniture. Apparel mid-band is $30, large furniture mid-band is $72. The gap is two things: LTL or oversize freight on the inbound (often $25-35 alone) and damage write-down (Loop's 2024 benchmark puts home goods handling fees at 17 percent of order value, the highest of any vertical they track).
why are returns processing costs going up even when my volume is flat?
Your 3PL's input costs are up. BLS warehousing PPI is up 54.6 percent since January 2019. Warehouse hourly wages are up 39.8 percent. Industry employment is still 5.6 percent below its April 2022 peak. Labor is more expensive and scarcer than 2019, so the 3PL passes through fee inflation at renewal regardless of your volume.
should i charge a return fee to offset processing cost?
Most brands above $3M revenue should, with a category-mix check first. Loop's 2025 update shows roughly 70 percent of merchants now charge return fees at an average of $9 per return. From our client work (anonymized synthesis across ~13 operator segments, not a published benchmark) switching from free to paid drops return rate 12 to 25 percent inside 60 days with a 2 to 5 percent conversion-rate dip on the way in. The lever bites harder on electronics and home and softer on apparel where bracketing is structural. Under $3M still building repeat behaviour, hold the free-returns position.
is the optoro 66 percent of product price benchmark right for my brand?
Only if you sell apparel or another size-fit-heavy vertical. The 66 percent figure is Coresight's apparel-focused number citing an Optoro estimate, cross-checked against ShipBob's $33-on-$50 illustration. For non-apparel verticals use the cross-vertical Optoro 27 percent figure or the Pitney Bowes 21 percent BOXpoll number.
how do i build a returns processing cost line in my P&L if i am under $10m revenue?
Start with five components per returned order: reverse shipping ($8-18), 3PL receive plus inspect plus restock ($5-15), unsellable or markdown write-down ($2-30 by category), payment processor refund-fee retention ($0.30-1.50), and customer service touch ($2-5). Sum, multiply by your monthly return count, and book monthly instead of in the COGS reserves line. You will see the real number jump from your accounting estimate.