
Insights
The 2026 CPG white-space map: Shopify saturation vs US manufacturer base
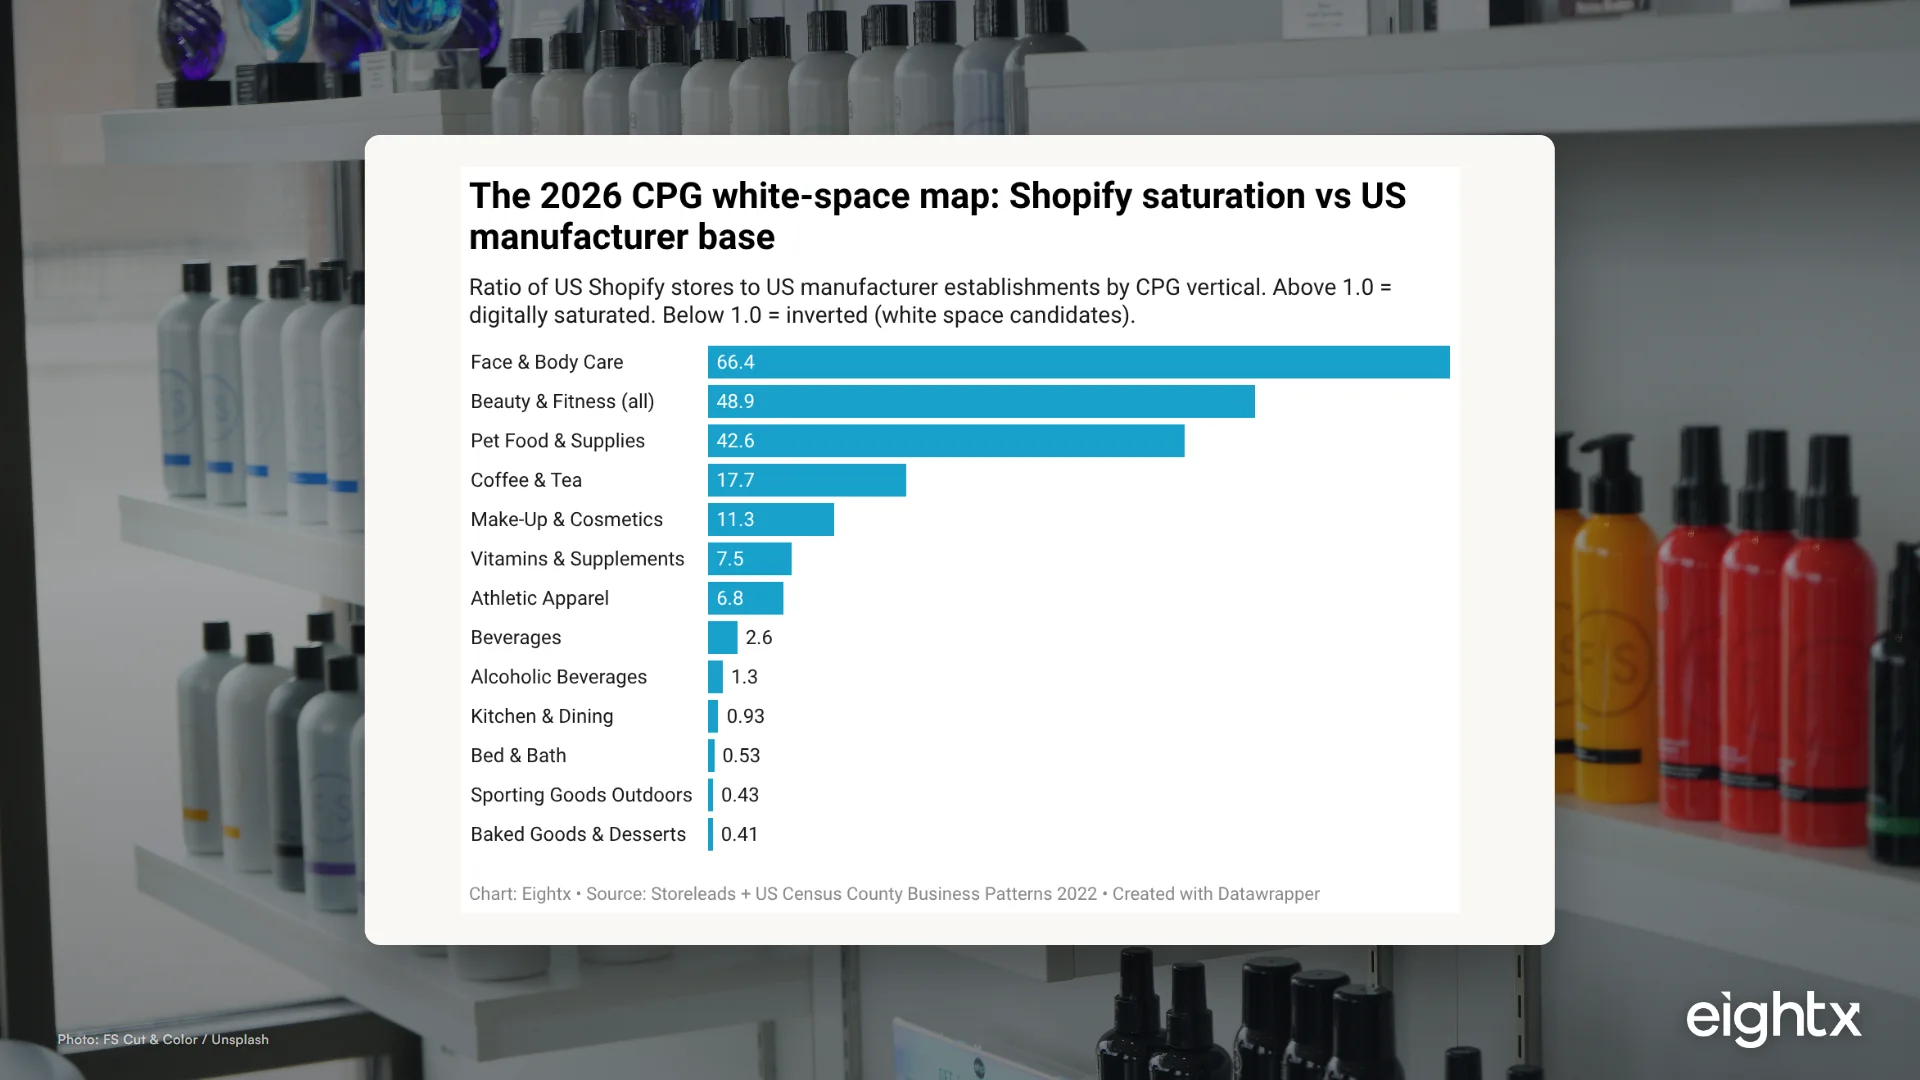
The 2026 CPG white space lies in categories with a stores-per-manufacturer ratio below 1.0, indicating more physical manufacturers than Shopify storefronts. While beauty has 74,677 Shopify face and body stores, categories like toilet preparations (NAICS 325620) with 1,124 US manufacturers present untapped potential, avoiding current digital saturation.
Key Takeaways
- Face and body care has 66 Shopify stores for every US manufacturer (74,677 stores vs 1,124 NAICS 325620 toilet-preparation manufacturers). Pet food is 43:1. Coffee and tea is 18:1 against NAICS 311920 coffee and tea manufacturing. These are the saturated lanes.
- Baked goods is inverted at 0.41 Shopify stores per US bakery (5,397 stores vs 13,210 NAICS 3118 establishments). Sporting goods outdoors is 0.43. Bed and bath is 0.53. The physical-to-digital ratio is flipped.
- Pure-play e-commerce hit $128.4B in March 2026, up 10.4% YoY (US Census MRTS, NAICS 4541, seasonally adjusted). 27 monthly observations from January 2024 through March 2026 trending upward at a 10.4% YoY pace. Channel expansion is not the constraint.
- Retail contribution margin is 30-40%, DTC is 20%. The wholesale-margin counter-argument matters most in inverted-ratio categories where retail-first is the realistic build path, not Shopify-first.
- This is a saturation map, not a launch-velocity map. Storeleads creation-date filters returned zero results for 2026 months, so the numbers count active stores. Refresh quarterly.
We built this map because the question we keep getting from founders is "what category should I launch in?" and the leaderboard answers (beauty, supplements, athletic apparel) are exactly where the supply-side density makes the unit economics worst. So we cross-referenced active US Shopify store counts from Storeleads against US Census County Business Patterns (CBP) manufacturer establishment counts by NAICS code, and produced a stores-per-manufacturer ratio. Above 1.0 means digitally saturated. Below 1.0 means inverted: more physical manufacturers than Shopify storefronts. The pattern surprised us in a few places.
This is the June 2026 version. We refresh it quarterly because Storeleads counts move and Census CBP releases annually.
How to read a CPG white-space map
The map has two axes you have to read together.
Axis one is Shopify category density. We pulled active US Shopify store counts from Storeleads by Google product taxonomy on June 1, 2026. The numbers are: face and body care 74,677 stores, beauty and fitness overall 124,978, vitamins and supplements 19,207, athletic apparel 7,307, pet food and supplies 18,611, baked goods and desserts 5,397, beverages 31,672. These are active storefronts, not new launches. We tried filtering for 2026 launch dates and the Storeleads creation-date filter returned zero results for every single 2026 month, which we read as a data lag rather than a real signal. So this is a stock map, not a flow map.
Axis two is US manufacturer establishment count from Census CBP 2022, by NAICS code. NAICS 325620 (toilet preparations, which is the closest manufacturing code for face and body care) has 1,124 paid-employee establishments. NAICS 3118 (bakeries and tortilla manufacturing) has 13,210. NAICS 311111 (dog and cat food manufacturing) has 437. CBP only counts paid-employee establishments, so Etsy-style sole proprietors are excluded. The number is the upstream supply base.
Divide axis one by axis two and you get the Shopify-stores-per-manufacturer ratio. Face and body care is 74,677 / 1,124 = 66.4. Baked goods is 5,397 / 13,210 = 0.41. The ratio tells you how many brands are competing for the same upstream supply, which is a decent proxy for how saturated the channel is on the brand side.
The chart sorts 13 verticals from most saturated to most inverted. Everything above the 1.0 line is digitally crowded. Everything below is structurally under-built on the Shopify side.
Where the saturation actually is
The top of the ratio chart is where most founders launch and where the customer acquisition math is hardest.
Face and body care sits at 66 Shopify stores per US toilet-preparation manufacturer. Even assuming most storefronts share co-packers, that means the brand layer has been picked over. Beauty and fitness as a whole category (which includes face and body care, fitness gear, vitamins, and adjacent) is 49:1 against the broader NAICS 3256 supply base. Pet food is 43:1, with only 437 US dog and cat food manufacturers feeding 18,611 Shopify stores. Coffee and tea is 17.7:1 against the 1,090 US coffee and tea manufacturers in NAICS 311920.
The mid-band, still saturated but less extreme: make-up and cosmetics at 11.3, vitamins and supplements at 7.5, athletic apparel at 6.8. These categories still have enough density that a generic brand cannot break out without a real product or distribution edge.
| Shopify category | US Shopify stores | US manufacturer establishments (NAICS) | NAICS code | Stores per manufacturer |
|---|---|---|---|---|
| /Beauty & Fitness/Face & Body Care | 74,677 | 1,124 | 325620 | 66.4 |
| /Beauty & Fitness (all) | 124,978 | 2,558 | 3256 | 48.9 |
| /Pets & Animals/Pet Food & Supplies | 18,611 | 437 | 311111 | 42.6 |
| /Food & Drink/Beverages/Coffee & Tea | 19,299 | 1,090 | 311920 | 17.7 |
| /Beauty & Fitness/Face & Body Care/Make-Up & Cosmetics | 12,756 | 1,124 | 325620 | 11.3 |
| /Health/Nutrition/Vitamins & Supplements | 19,207 | 2,558 | 3256 | 7.5 |
| /Apparel/Athletic Apparel | 7,307 | 1,076 | 316 | 6.8 |
A practical read for an operator: if your category sits above ~5:1, your customer acquisition cost is set by an auction where the marginal bidder is venture-backed. You need a structural product or distribution edge, not a positioning edge.
Where the inversion is: the bakery, beverage and outdoor white space
The bottom of the chart is the interesting story.
Baked goods and desserts: 5,397 Shopify stores against 13,210 US bakery establishments. That is 0.41 Shopify stores per manufacturer, or roughly one storefront for every 2.4 physical bakeries. Sporting goods outdoors sits at 0.43. Bed and bath at 0.53. Kitchen and dining is close to parity at 0.93. Beverages overall is 2.6, but breweries (NAICS 312120, 5,165 establishments) are almost entirely off Shopify because the three-tier distribution system makes pure DTC alcohol a regulatory mess.
These are not categories where nobody is winning. They are categories where the physical-to-digital ratio is flipped, which means the brand layer is structurally thinner than the supply layer.
| Shopify category | US Shopify stores | US manufacturer establishments (NAICS) | NAICS code | Stores per manufacturer |
|---|---|---|---|---|
| /Food & Drink/Food/Baked Goods & Desserts | 5,397 | 13,210 | 3118 | 0.41 |
| /Sports/Sporting Goods/Outdoors | 6,480 | 14,995 | 3399 | 0.43 |
| /Home & Garden/Bed & Bath | 7,890 | 14,995 | 3399 | 0.53 |
| /Home & Garden/Kitchen & Dining | 14,015 | 14,995 | 3399 | 0.93 |
| /Food & Drink/Beverages/Alcoholic Beverages | 6,657 | 5,165 | 312120 | 1.3 |
| /Food & Drink/Beverages | 31,672 | 12,240 | 3121 | 2.6 |
Why most operators avoid these: cold chain, repeat-purchase frequency (people buy bread weekly, not quarterly), shipping economics on heavy items, and the dominance of grocery shelves as the natural channel. The strategic case for going in anyway: if you can land specialty retail or grocery distribution, you can run the wholesale-margin model that the saturated DTC categories cannot.
The macro context: pure-play e-commerce is still compounding
Before you write off the saturated categories entirely, check the pie they are competing for.
US Census MRTS NAICS 4541 (Electronic Shopping and Mail-Order Houses) sales hit $128.4 billion in March 2026, up 10.4% year-over-year from $116.0 billion in March 2025. The series covers 27 monthly observations from January 2024 through March 2026 with a strong upward trend (a handful of month-over-month dips inside the window, but every rolling 12-month window is up double digits YoY). Pure-play e-commerce keeps compounding.
So the saturation story is real at the category level, but the channel story is still growing at the macro level. Both can be true. Saturated categories are saturated because the channel is big, not because the channel is shrinking.
The wholesale-margin counter-argument
The reason inverted-ratio categories stay inverted is that retail makes more sense in them. We pulled this from a 2024 CPG founder call on the Eightx library:
"The contribution margins through retail are better than most people think. You can pull off 30 to 40% if you have a good product through grocery and even with the trade spend. In DTC a good contribution margin is 20%. It's scalable, but in wholesale retail 30% is probably the lower bound."
That math is why every dairy brand, every bakery, every outdoor-gear company is retail-first. The DTC channel can support 20% contribution; the category economics need 30-40% to absorb cold chain, frequency expectations, and shipping. The white-space play in these categories is usually "build a retail-native brand with a DTC supplement for storytelling and customer data," not "win Shopify."
If your funding plan, distribution access, and category economics support retail-first, the inverted-ratio categories are wide open. If they don't, the inverted-ratio chart is a warning sign, not an invitation.
How to pick
The decision framework we use with founders weighing two categories.
Channel access. Can you land grocery, specialty retail, or club distribution within 12 months? If yes, an inverted-ratio category is viable. If no, you are forced into pure DTC, and you need the saturated-but-large lanes (face and body, supplements, pet food).
Capital structure. Saturated DTC categories burn cash on paid acquisition for 18 to 24 months before payback. If your runway is less than 24 months from a clean inventory build, do not pick a saturated category. The math will catch you.
Founder edge. A genuinely differentiated product (real R&D, real IP, real founder story) can break out of a saturated category. A generic product with a slick brand cannot. Conversely, no amount of differentiation fixes the cold-chain math on a bread brand if you do not have retail distribution.
Contribution margin you can execute. Build the actual unit economics before the brand work. If you can pull 30%+ contribution through retail, lean retail. If you can pull 20%+ contribution through DTC with a 12-month payback, lean DTC. If you cannot pull either, the category is not the problem, the product is. None of this math is trustworthy without clean multi-channel books underneath it, so pick a bookkeeping setup built for ecommerce before you start chasing contribution figures across retail and DTC.
The leaderboard answers (beauty, supplements, pet food, coffee) are exactly where the supply-side density makes unit economics worst. The inverted-ratio answers (baked goods, outdoor, bed and bath) are where the DTC channel is structurally thin because the category economics demand retail. Pick where your distribution access, capital structure, and contribution-margin math actually line up.
Sources and methodology
Storeleads queries. All counts retrieved June 1, 2026, via search_stores(platform=shopify, country=US, category=<path>) against Google product taxonomy paths. The returned total field is the active Shopify store count. Categories pulled included /Apparel, /Home & Garden, /Beauty & Fitness, /Food & Drink, /Sports, /Health, /Pets & Animals, and their children down to four levels. We attempted creation_date filters for every 2026 month (Jan through May) and the API returned zero results, which we treat as a data-side lag rather than a real signal. The map is therefore a stock count of active stores, not a flow count of new launches.
US Census County Business Patterns (CBP) 2022. Manufacturer establishment counts pulled via cbp_query(for_geography=us:1, naics_filter=<code>) returning ESTAB (establishment count). NAICS codes used: 311 (food manufacturing), 312 (beverage), 315 (apparel), 316 (leather and allied), 3115 (dairy), 3118 (bakeries and tortilla), 3121 (beverage), 3162 (footwear), 3169 (other leather), 3253 (pesticide), 3254 (pharma), 3256 (soap/cleaning/toilet-prep), 3399 (other misc manufacturing), 311111 (dog and cat food), 311119 (other animal food), 311520 (ice cream), 311920 (coffee and tea manufacturing), 312120 (breweries), 325611 (soap and detergent), 325620 (toilet preparations). CBP is paid-employee establishments only. Sole-prop and nonemployer firms are excluded; that would inflate the bakery, candle, and small-batch food counts further if included.
US Census Monthly Retail Trade Survey (MRTS). Pure-play e-commerce sales pulled via census_retail_trade_query(time="from 2024 to 2026", category_code="4541", data_type_code="SM", seasonally_adj="yes"). Returned 27 monthly observations from January 2024 through March 2026. The latest data point is $128.366 billion (March 2026), +10.4% YoY against March 2025 ($116.016 billion).
Founder-call library. Pinecone semantic search against the Eightx founder-call archive (5,400+ calls indexed). Cited segment is from a November 2024 anonymized CPG founder call, paraphrased Matt's voice on retail vs DTC contribution margins.
Limitations and refresh cadence. Storeleads counts are point-in-time and exclude non-Shopify platforms (BigCommerce, WooCommerce, custom). The Storeleads country=US filter is the store's billing or headquarters country, not its customer base, so the ratio is best read as "US-billed Shopify stores per US manufacturer," not "stores serving the US market per US manufacturer." A US-billed brand may ship globally and a foreign-billed brand may sell heavily into the US. CBP is a 2022 reference year (latest available as of 2026-06-01), which means the numerator is a current 2026 store count divided by a 2022 manufacturer count; manufacturer establishment counts can drift 10-15% over a 3-4 year window, so the ratios are directionally accurate but the absolute numbers will shift when CBP 2023 releases. MRTS is monthly and current. The map refreshes quarterly. Next update target: September 2026.
Frequently asked questions
where is the actual white space in cpg dtc right now if beauty and supplements are saturated?
The inverted-ratio categories: baked goods (0.41 Shopify stores per US bakery), sporting goods outdoors (0.43), bed and bath (0.53), and the broader food and beverage lanes outside coffee. These are categories with thousands of US manufacturers and relatively few Shopify storefronts. The trade-off is they tend to be retail-native (cold chain, frequency, shelf logic) and may not reward a pure DTC build.
how do you read storeleads category counts against census naics data without double-counting?
You match the Shopify Google-product-taxonomy path to the closest NAICS manufacturer code, not the retail code. Face and body care goes against NAICS 325620 (toilet preparations), not NAICS 4541 (e-commerce retail). The ratio answers how many brands are competing for the same upstream supply base, not how many sellers exist. Read it as supply-side density, not demand-side competition.
is it dumb to launch a dtc brand in baked goods or dairy when shopify density is low?
It is structurally hard, not dumb. Cold-chain shipping, frequency expectations (people buy bread weekly, not quarterly) and the dominance of grocery shelves mean DTC unit economics struggle even when category density is low. The smart move in these categories is usually retail-first with a small DTC presence for brand storytelling and direct-customer data, not a Shopify-only build.
how saturated is the shopify face and body care category actually?
74,677 active US Shopify stores against 1,124 US toilet-preparation manufacturers (NAICS 325620). That is 66 Shopify storefronts per upstream manufacturer. Even if you assume every storefront is contract-manufactured and most share a handful of co-packers, you are launching into a category where the supply chain has been picked over and the customer acquisition cost reflects it.
should i build a shopify brand in a low-density category or just go grocery / wholesale?
Depends on the contribution-margin math you can execute. From a 2024 Eightx founder call: "You can pull off 30 to 40% contribution through grocery with trade spend. A good DTC contribution margin is 20%." In an inverted-ratio category (baked goods, dairy, sporting goods outdoors), retail-first usually wins the margin math. In a saturated category, DTC is the only way to differentiate fast enough.
which cpg verticals have the highest shopify-store-per-manufacturer ratio in 2026?
Face and body care leads at 66:1, followed by beauty and fitness overall at 49:1, pet food and supplies at 43:1, and coffee and tea at 17.7:1 (19,299 stores vs 1,090 NAICS 311920 coffee and tea manufacturers). Make-up and cosmetics sits at 11:1, vitamins and supplements at 7.5:1, and athletic apparel at 6.8:1. Everything above ~5:1 is structurally crowded on the Shopify side.
is pure-play ecommerce growth actually slowing in 2026?
No. US Census MRTS NAICS 4541 (Electronic Shopping and Mail-Order Houses) hit $128.4B in March 2026, up 10.4% year-over-year. The series covers 27 monthly observations from January 2024 through March 2026 with a strong upward trend (a handful of month-over-month dips inside the window, but YoY growth has not turned negative). Channel expansion is still adding share at the macro level even as individual categories saturate.
why does pet food show 43 shopify stores per us manufacturer, is that the cleanest dtc category?
It is one of the most DTC-mature categories. Only 437 US dog-and-cat-food manufacturers (NAICS 311111) supply 18,611 Shopify storefronts. The category benefits from high repeat purchase, subscription mechanics, and a customer willing to pay direct. The downside is the saturated category usually means high CAC. You are not finding white space in pet food in 2026.
how do i decide between a saturated category and a sleepy retail category as a founder?
Three questions. First, what is your channel access? If you can land grocery or specialty retail, an inverted-ratio category is viable. Second, what is your capital structure? Saturated DTC categories burn cash on paid acquisition for 18-24 months before payback. Third, what is your founder edge? A genuinely differentiated product can break out of a saturated category; a generic product cannot fix an inverted-ratio one.