
Insights
DTC cost-of-goods index, May 2026: parcel and packaging are the squeeze, apparel is the relief
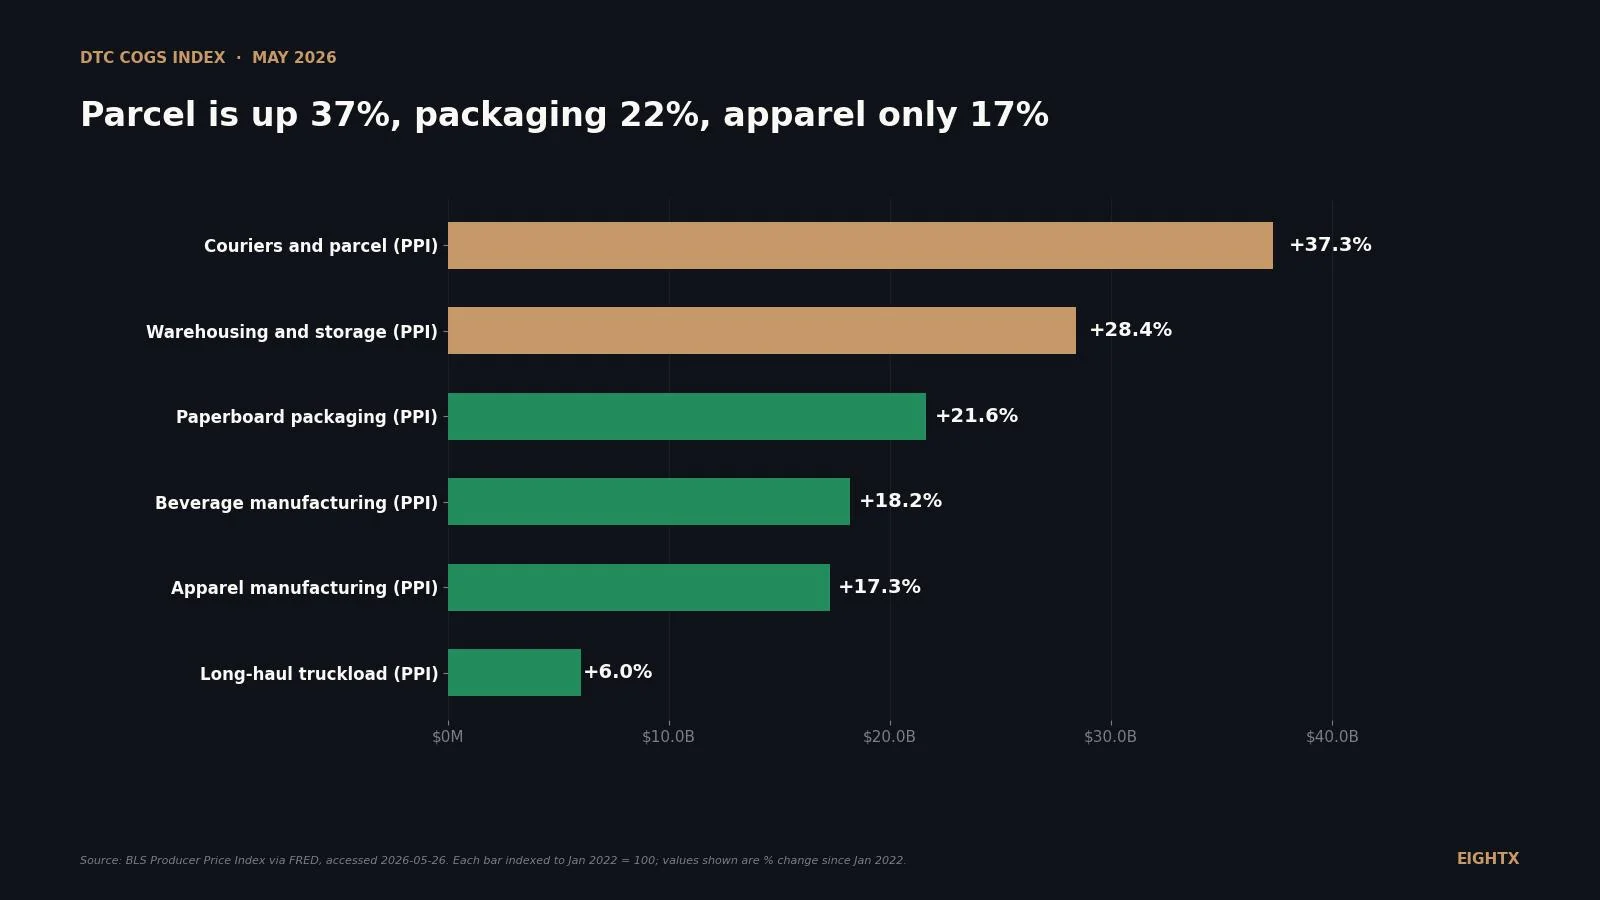
Parcel costs are up 37% since January 2022, packaging up 22%, and apparel input costs up just 17%, based on BLS PPI and FRED freight data through May 2026. The cost squeeze for most DTC operators is coming from fulfilment, not product cost. Brands benchmarking gross margin against pre-2022 norms need to separate product COGS from fulfilment COGS, because the two lines are moving in very different directions.
Key Takeaways
- Parcel and 3PL are the real squeeze, not goods inflation. Couriers PPI is up 37.3% since January 2022 and warehousing is up 28.4%. Goods-side categories (apparel, food, personal care) are only up 16-18%. If your gross margin is bleeding, the line item is almost certainly fulfillment, not what you put in the box.
- Packaging is the heaviest goods-side cost-push at +21.6%. Paperboard container PPI kept climbing through 2025 even as apparel and food flattened. EU PPWR plus US state EPR fees will compound this through 2026.
- Apparel input cost is the most relieved category. Apparel manufacturing PPI is up 17.3% cumulative but only 3.7% year-over-year, and the trend has been flat since mid-2024. If you sell apparel, your input squeeze is yesterday's story.
- Long-haul truckload spiked 10.9% month-over-month in April 2026. Diesel went from $3.62 in December to $5.50 in April. Lock truckload rates now, before this compounds. The April reading is as of the 2026-05-26 BLS release and could revise.
- The 2026 carrier playbook is engineering parcels under cubic-volume thresholds. UPS and FedEx now trigger Additional Handling at >10,368 cubic inches and Oversize at >17,280 inches. Right-sizing packaging is a 15-20% surcharge reduction in bulky categories.
Since January 2022, the cost to produce what direct-to-consumer (DTC) brands sell has risen 16-22% depending on the category, but the cost to move it has split. Parcel (couriers) is up 37%, warehousing is up 28%, and long-haul truckload was only up 6% until an April 2026 spike pushed it to 20% year-over-year. The May 2026 update of this tracker uses BLS Producer Price Index (PPI) data through April 2026 (the latest release) and reads the cost-push from the operator P&L down, not the BLS table sort. For most $5-50M GMV (gross merchandise value) brands we work with, the order of pain is fulfillment first, packaging second, goods inflation third.
What the COGS index shows in May 2026
The headline number for DTC operators is the gap between fulfillment and goods. Parcel courier PPI is up 37.3% since January 2022. Warehousing is up 28.4%. The five goods-side categories we track (apparel, personal care, food, beverage, packaging) sit between 116 and 122 on the same index, a 16-22% range. The cost squeeze that defined 2022-2024 (where input inflation was the operator concern) has flipped. By April 2026, goods-side categories are running 1.7% to 4.6% year-over-year. Fulfillment-side categories are running 4% to 12.3% year-over-year. If you have not rebuilt your cost-of-goods walk in 18 months, the line items you are still treating as the problem are not the problem anymore.
Inside the goods-side categories, packaging is the standout. Paperboard container manufacturing PPI sits at 121.6, +21.6% since January 2022, with a +4.6% year-over-year print that has not flattened the way apparel, food, and personal care have. Beverage manufacturing PPI sits at 118.2 (+18.2%), apparel at 117.3 (+17.3%), personal care (NAICS soap, cleaners, and toilet preparation manufacturing) at 116.3, and food at 116.0. Apparel and food have been roughly flat since mid-2024.
Category FRED series Apr 2026 index (Jan 2022 = 100) Change since Jan 2022 YoY change (Apr 2025 to Apr 2026) Apparel manufacturing PCU315315 117.3 +17.3% +3.7% Personal care (soap/cosmetics) PCU32563256 116.3 +16.3% +2.4% Food manufacturing PCU311311 116.0 +16.0% +1.7% Beverage manufacturing PCU31213121 118.2 +18.2% +2.8% Paperboard container manufacturing PCU322219322219 121.6 +21.6% +4.6% Couriers and messengers (parcel) PCU492492 137.3 +37.3% +12.3% Warehousing and storage PCU49314931 128.4 +28.4% +4.0% Truckload (long-haul) PCU484121484121 106.0 +6.0% +20.0% Rail freight WPU3011 111.8 +11.8% +0.3% US diesel ($/gal) GASDESM 147.7 +47.7% +54.1%
The freight story is a tale of two modes
If you sort by what is moving fastest, freight is two separate stories. Parcel and warehousing are structural cost-push: carrier general rate increases (GRIs) of roughly 5.9% for UPS and FedEx and 7.8% for USPS in 2026, plus accessorial surcharges that stack on top of the headline. Kenco Group warns the realized parcel cost can run 24% above the GRI if accessorials are unmanaged. That is exactly the gap between the 5.9% headline and the +12.3% year-over-year courier PPI on this chart.
Truckload and rail are spot-priced. Truckload PPI bounced between 80 and 100 on our index for most of 2024 and 2025, a function of weak demand and oversupplied carrier capacity post-COVID. Rail PPI is barely moving (+11.8% cumulative since 2022, +0.3% year-over-year). For the past 24 months, the operator playbook was "move pallets, not parcels, wherever you can." That playbook is mid-revision now because of the April 2026 truckload print.
The operator implication is unchanged on the parcel side and freshly important on the truckload side. Parcel contract renegotiation is the single largest recoverable margin lever on most $5-50M GMV brands' P&Ls. Truckload, which had been a price-taker's market for 24 months, just printed a 10.9% month-over-month spike. If you have inbound or outbound truckload that can move on contract instead of spot, switch now.
April 2026: the truckload and diesel spike that flipped a 12-month trend
The April print is the chart-stopper. Long-haul truckload PPI went from 95.5 in March 2026 to 106.0 in April 2026, a 10.9% month-over-month jump. Diesel went from $3.62 a gallon in December 2025 to $4.92 in March and $5.50 in April. BLS PPI for No. 2 diesel fuel showed a +73.8% unadjusted 12-month increase as of April 2026 on their wholesale cut, with +12.6% in the single month of April. Two independent BLS pulls landed on the same April spike from different angles. The print is real.
Two things to note. First, the April truckload reading is subject to revision in the May print, given how large the month-over-month move was. Second, diesel feeds parcel fuel surcharges with a roughly six-week lag, so the April diesel print is going to land in your UPS/FedEx fuel surcharge tables through June. If you ship anything by air or truck in the next 60 days, the cost will be higher than the May invoice.
Category-by-category read for DTC operators
Apparel. Cumulative input cost is up 17.3% since 2022 but the year-over-year run rate is the most relieved in the dataset at +3.7%. The story since mid-2024 has been "flat to down" on US-produced apparel inputs. If you import from Asia, your real exposure is the de minimis suspension (in force since August 2025, continued February 2026) and Section 301 tariffs, neither of which are in the BLS print. The big strategic move for apparel brands in 2025 was passing through price increases of 15-22% on tariff-cycle news, with the explicit logic that every competitive brand was doing the same thing.
Personal care (soap, cleaners, toilet preparation). PPI is up 16.3% cumulative, +2.4% year-over-year. The BLS series proxies the broader personal care category honestly: it covers shampoo, lotion, deodorant, and similar mass-market formulations but does not cleanly capture specialty cosmetics. Watch the retail layer too. Recent BLS data shows health and beauty care retail PPI moving faster than the manufacturing line, which means margin pressure is compressing wholesale-to-retail before it shows up in raw-input cost. If you sell through Sephora, Ulta, or Amazon, this hits you before it shows up in your COGS bridge.
Food and beverage. Food PPI is at +16.0% cumulative, +1.7% year-over-year (the most relieved line in the dataset). Beverage is at +18.2% / +2.8%. Most operators we talk to in food and beverage are not seeing input inflation as the active P&L story. Packaging is. The single largest contributor to a beverage brand's COGS is increasingly the bottle, can, or carton, not the liquid.
Heavy and bulky goods. Packaging up 22%, parcel up 37%, dimensional-weight surcharges and the new cubic-volume thresholds compounding. If you ship anything that crosses 10,368 cubic inches per package, you are in the squeeze. UPS shifted Additional Handling and Large Package surcharge calculation from length-plus-girth to cubic size for shipments on or after December 22, 2025, with fractional inches now rounding up. The mechanical effect is more packages crossing into surcharge territory without any actual product change.
What to do this quarter
Renegotiate parcel before the next GRI. Couriers PPI is the single highest-rising line in the dataset and your single largest recoverable cost lever. Pull 12 months of UPS/FedEx/USPS invoices, isolate which accessorials are largest (residential, DAS, fuel, peak season, dimensional weight), and bring them line-by-line into the renegotiation. Push for caps on accessorial increases and on minimum-charge thresholds.
Lock truckload rates before April compounds. The +10.9% month-over-month truckload print is fresh and the diesel signal points to more pressure through Q3 2026. If you have inbound freight that can shift from spot to contract, shift it. If you have a 3PL that can hedge fuel surcharges via inland routing or rail, use it.
Audit your packaging spec against the cubic-volume thresholds. Right-sizing boxes to stay under 10,368 cubic inches (Additional Handling) and 17,280 cubic inches (Oversize) is the highest-ROI engineering work most DTC brands have not done yet. Trade-press analyses report 15-20% surcharge reduction in bulky categories from this single change. Consolidating to fewer SKUs of carton also reduces paperboard spend per shipment.
Sort BLS PPI by what is moving fastest and you get the wrong operator story. Sort by what shows up on your P&L and parcel is the entire fight. Goods inflation worked through. Packaging is the second front. Everything else is yesterday.
Sources and methodology
We pulled monthly Producer Price Index observations from January 2022 through April 2026 (the latest BLS release as of 2026-05-26) for ten series: apparel manufacturing (PCU315315), soap/cleaners/toilet preparation manufacturing (PCU32563256), food manufacturing (PCU311311), beverage manufacturing (PCU31213121), paperboard container manufacturing (PCU322219322219), couriers and messengers (PCU492492), warehousing and storage (PCU49314931), long-distance truckload freight (PCU484121484121), rail freight (WPU3011), and US diesel sales price (GASDESM, EIA via FRED). All data was pulled through the FRED API.
We re-indexed each PPI series to January 2022 = 100 by dividing every observation by the January 2022 value and multiplying by 100. This makes categories with different native base periods (some 1984, some 2003, some 2011) directly comparable on a single chart. The "since Jan 2022" change is (April 2026 value / January 2022 value) minus 1. The year-over-year change is (April 2026 / April 2025) minus 1. Diesel is shown as $/gallon on the chart but indexed to 147.7 in the summary table for comparability.
All PPI series are NSA (not seasonally adjusted). BLS does not publish seasonally adjusted versions for these specific industry codes. Diesel is also NSA.
BLS PPI captures producer prices, not landed cost. Tariffs (Section 301 China, Section 232 steel/aluminum), parcel accessorial surcharges (residential, DAS, fuel, peak), and customs clearance fees do not flow into the PPI series. The de minimis ($800) suspension that took effect in August 2025 and was continued in February 2026 raises landed cost on cross-border DTC shipments and is also not in these numbers. Read the BLS apparel PPI as "US-priced apparel manufacturing inputs," not as a literal replacement for your supplier's quote.
Two proxies are worth flagging. We use Soap/Cleaners/Toilet Preparation Manufacturing as the closest published NAICS series for personal care; specialty cosmetics sit in finer sub-codes that FRED does not break out. We use Other Paperboard Container Manufacturing as the proxy for "packaging" because it is the cleanest series for the rigid-box and mailer category most DTC brands use. Flexible film (poly mailer) and corrugated sit under different commodity codes.
BLS PPI publishes with a roughly six-week lag. The April 2026 truckload reading is a single-month print and could revise in the May 2026 release. We will refresh this tracker quarterly when BLS PPI data lands; next planned update is August 2026 with July 2026 data.
For related macro context, see our DTC layoff and hiring tracker for the BLS JOLTS read on retail and warehousing labor, and our interim CFO services overview for how we work the COGS bridge with operators on weekly calls.
Frequently asked questions
is my landed cost actually going up in 2026 or has the bulk of cost-push inflation worked through already?
It depends on what you sell and how you ship it. Goods-side inflation has largely worked through (apparel +3.7% year-over-year, food +1.7%, personal care +2.4%). The active squeeze in 2026 is on the fulfillment side: couriers PPI is up 12.3% year-over-year, warehousing is up 4.0%, and the April 2026 truckload spike pushed long-haul up 20% year-over-year. If you ship a lot of small parcels, your landed cost is still rising. If you ship pallets to retail, you got lucky for 18 months and just lost it.
why are parcel shipping costs up 37% since 2022 when truckload trucking is only up 6%?
Two reasons. UPS, FedEx, and USPS have run published rate increases of roughly 5-6% every year since 2022 (the 2026 GRIs landed at 5.9% for UPS and FedEx, 7.8% for USPS Ground Advantage), and accessorial surcharges (residential, DAS, fuel, peak season, dimensional weight) stack on top of base rates. Kenco specifically warns the realized parcel cost can run 24% above the published GRI once surcharges compound. Truckload is governed by a competitive spot market with hundreds of thousands of carriers, so any softness in demand drives rates down fast.
is the april 2026 truckload spike a sign of a real freight squeeze or noise?
Real, with revision risk. BLS PPI for transportation services rose 5.0% in a single month in April 2026, with truck transportation up 8.1% month-over-month on their cut. Diesel went from $3.62 a gallon in December 2025 to $5.50 in April. Both numbers point the same direction. The April reading is subject to BLS revision next month, but the diesel signal alone says it is not a typo. Lock rates now if you can.
how do i tell which line item of my cogs is actually responsible for the margin compression i'm seeing?
Run a COGS bridge: take your gross margin from a year ago, then walk each line item (product cost, freight in, packaging, freight out, 3PL pick-and-pack, returns) to where it sits today. Compare each line's percent change to the BLS PPI category that maps to it. If product cost is moving more than +3% year-over-year, that is supplier-specific (you should renegotiate). If freight out is moving more than +12% year-over-year, that is in line with the BLS courier print and your fight is with the carrier, not the line item. The most common cause of gross margin compression we see on operator calls is product mix and stale inventory drag, not BLS-tracked input inflation.
should i renegotiate my parcel contract with ups, fedex, or usps given the 12% yoy courier ppi jump?
Yes, and the lever is accessorials, not base rate. The published GRI is roughly 5.9%, but realized cost is closer to +12% because of residential, DAS, peak season, and dimensional surcharges. Sit with your last 12 months of invoices, isolate which surcharges are largest, and bring them line-by-line into the renegotiation. Also right-size your packaging to stay under the 10,368 cubic inch Additional Handling and 17,280 cubic inch Oversize thresholds. Brands that engineer their packaging spec around the new cubic rules report 15-20% surcharge reduction in bulky categories.
apparel ppi is up 17% but my chinese supplier just quoted me flat, what's going on?
The BLS apparel PPI captures US-domiciled production. It is a directional benchmark, not a literal landed-cost replacement. If you source from China or Vietnam, your supplier quote sits inside the de minimis suspension (which has been in effect since August 2025 and continued in February 2026), Section 301 tariffs, and current freight rates. A flat supplier quote with the BLS print at +17% probably means your supplier is absorbing margin to keep your business. That is useful information at your next renegotiation, but it does not show up in any government series.
what does the diesel spike to $5.50 a gallon in april 2026 mean for my fulfillment cost over the next 60 days?
Diesel leads truckload pricing by 4-8 weeks and feeds parcel fuel surcharges with about a 6-week lag. Expect 3PL fuel surcharges, LTL fuel surcharges, and parcel fuel surcharges to all bump up between mid-June and mid-July if diesel stays at this level. If you have any inbound freight in the next 60 days that could move now instead of later, move it now. If you have ad-hoc LTL or truckload bookings, lock them on contract rates rather than spot.
why is paperboard packaging ppi up more than the goods inside the boxes, and how do i offset packaging cost?
Containerboard prices ran up $50 a ton year-to-date as of April 2026 (Fastmarkets RISI), driven by US mill consolidation and tariff effects on virgin pulp. Packaging is also turning into a regulatory line: EU PPWR (Packaging and Packaging Waste Regulation) and US state EPR (Extended Producer Responsibility) fees will compound the BLS print through 2026. The fastest offset is right-sizing your boxes to stay under the new UPS and FedEx cubic-volume thresholds. The second-fastest is consolidating SKUs into a smaller carton library. Both reduce your paperboard spend per shipment and your dimensional-weight surcharges in one move.
how often is this index updated and which months of bls data does it use?
Quarterly. BLS PPI publishes with a roughly six-week lag, so we refresh after the second release of each quarter (February, May, August, November). The May 2026 release reflects April 2026 data and was the latest available point as of 2026-05-26. The next planned update is August 2026 with July 2026 data.