
Insights
E-commerce penetration by category, Q1 2026: where DTC has won (and where it hasn't)
US ecommerce reached 16.9% of total retail in Q1 2026, with $326.7 billion in seasonally adjusted quarterly sales (Census CB26-81). Penetration by category has split into saturated, mid-cycle, and stuck buckets. The category you sell in sets your ceiling on DTC channel mix, so benchmark against your vertical's penetration rate, not the blended average, when modeling how much revenue online can realistically carry.
Key Takeaways
- US retail e-commerce was 16.9% of total retail in Q1 2026 (seasonally adjusted, Census CB26-81). E-commerce sales hit $326.7B on $1,929.0B total retail.
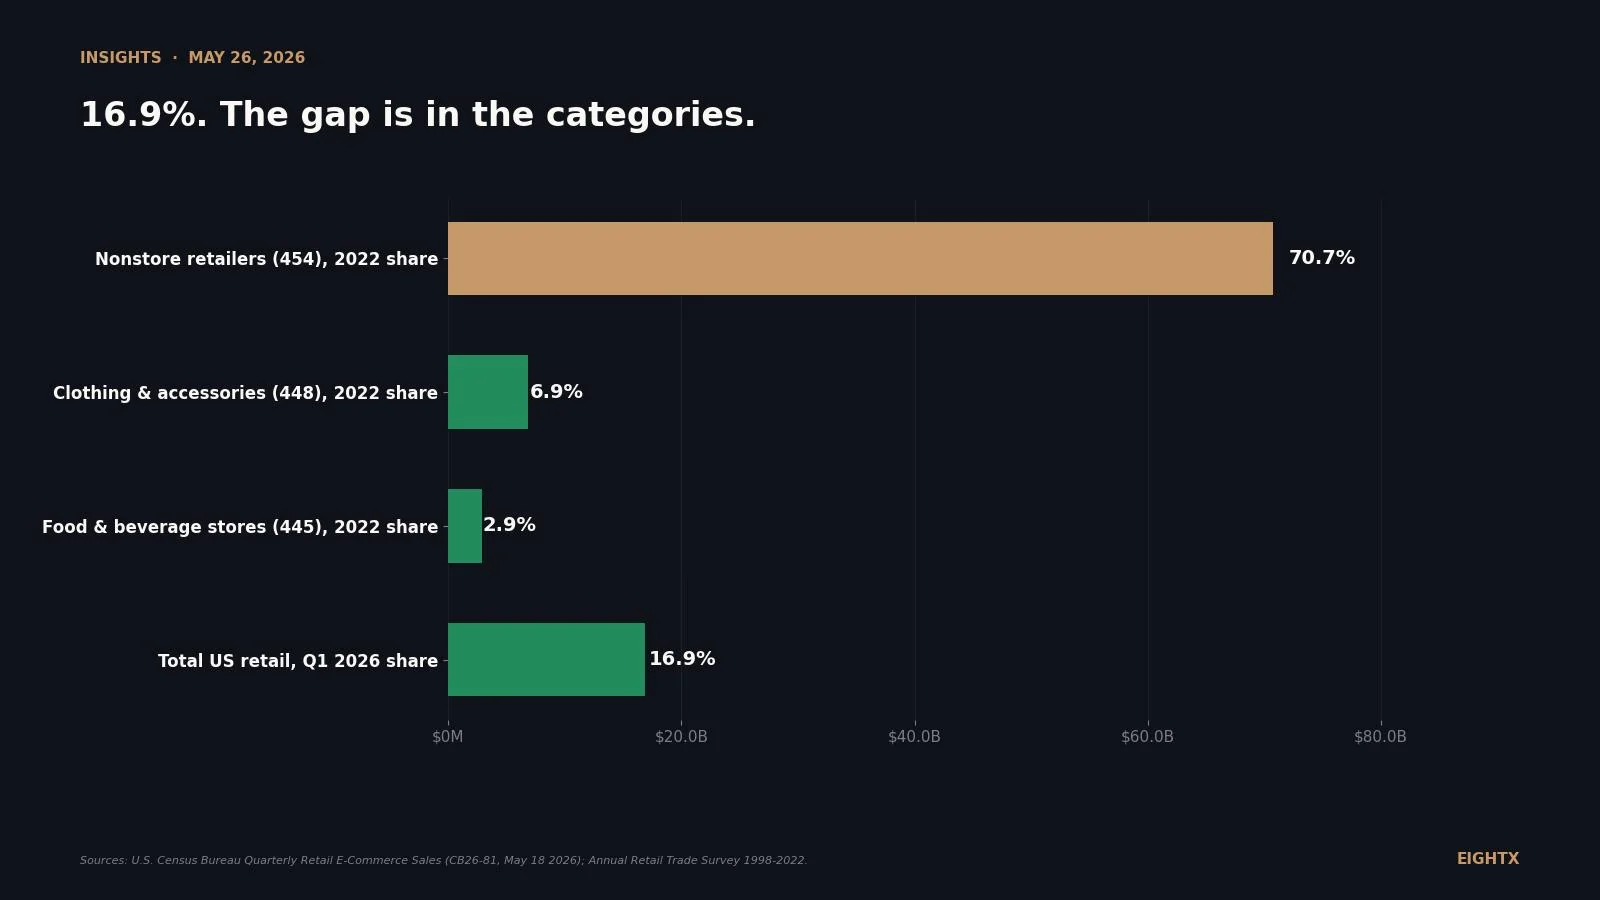
- Penetration split into three buckets: saturated (nonstore retailers ~71%, electronic shopping ~78%), mid-cycle (clothing 6.9%, sporting/hobby 6.0%, furniture 3.3%), and stuck (food & beverage 2.9%, building materials 0.8%).
- The Q1 2025 to Q1 2026 share gain was +0.9 points, beating the prior year's +0.1 points. Penetration is still climbing, just unevenly by category.
- E-commerce grew 9.8% YoY in Q1 2026 versus 3.9% for total retail. Nonstore retailers (NAICS 454) lead at +11.1% YoY (May 2026 MRTS), so the dollar growth is concentrating in marketplaces and platforms, not independent brand sites.
- Census 16.9% is not the same number as Digital Commerce 360's 23.1%. Different definitions: Census excludes nonemployers post-April 2025 benchmark, DC360 uses a broader Commerce Department goods-and-services basis. Both are valid, just measure different things.
If you run a $5M to $50M DTC brand, the Q1 2026 Census release matters because it tells you whether your category is still riding the rising online tide or whether you're now fighting for share inside a flat category. The headline (16.9% of US retail is e-commerce) hides the operator-relevant story: penetration has split into saturated, mid-cycle, and stuck buckets. This post breaks down where each retail subsector sits, what the data actually says, and the three concrete moves to make this quarter based on where your category lands.
What the Q1 2026 Census release actually says
The Census Bureau's Q1 2026 Quarterly Retail E-Commerce Sales release (CB26-81, May 18 2026) put total US retail e-commerce at $326.7 billion on total retail sales of $1,929.0 billion, seasonally adjusted. That's a 16.9% e-commerce share. E-commerce sales grew 9.8% year-over-year, more than twice the 3.9% growth for total retail.
The share has climbed every year since 2019. The pandemic jump (Q1 2020's 11.8% to Q1 2021's 13.6%) was the steep part. Since then the curve has been about a point per year, with one notable exception: Q1 2024 to Q1 2025 only added 0.1 points. The Q1 2025 to Q1 2026 gain of 0.9 points reset that trend. One important nuance: both the Q1 2025 and Q1 2026 values use the restated nonemployer-excluded basis (the April 2025 benchmark dropped nonemployers from the series). Q1 2025 reads 16.0% on the restated basis, where the original release said 16.2%. So the "+0.1 vs +0.9" comparison is restated-basis to restated-basis, and part of the apparent acceleration is a benchmark artifact, not a pure demand signal.
So the framing of "DTC has plateaued" is the wrong read. Penetration is still climbing. It's the category-level distribution that has plateaued in some places and is still moving in others.
The three-bucket split: saturated, mid-cycle, stuck
The category-level breakdown lives in the Annual Retail Trade Survey (ARTS), which Census publishes once a year. The latest detailed cut is 2022 (released January 2024, revised September 2024). ARTS 2023 typically lands in January 2027, so the 2019 versus 2022 variance is the cleanest annual story available right now.
Three buckets pop out.
Saturated. Nonstore retailers (NAICS 454) at 70.7% in 2022, up from 65.6% in 2019. Electronic shopping and mail-order houses (NAICS 4541) at 77.9%, up from 74.6%. These are the categories that capture pure-play digital sellers and marketplaces. They're near a ceiling because the category definition itself is "online-first." If you sell DTC under your own brand without a physical store, Census almost certainly puts you in 454 (that's the bucket pure-play digital sellers and marketplaces share), and your category-share can't move much higher.
Mid-cycle. Clothing and accessories (NAICS 448) at 6.9%, up from 4.6%. Sporting goods, hobby, books (NAICS 451) at 6.0%, up from 4.3%. Furniture and home furnishings (NAICS 442) at 3.3%, up from 1.9%. Electronics and appliances (NAICS 443) at 3.0%, up from 2.0%. These categories added 1-2 points of share between 2019 and 2022 and the curve hasn't bent. There's runway here.
Stuck. Food and beverage stores (NAICS 445) at 2.9% (up from 1.1%, a 2.6x jump but off a tiny base). Building material and garden (NAICS 444) at 0.8%, up from 0.6%. The Census suppressed motor vehicle (441), health/personal care (446), gas stations (447), and general merchandise (452) for 2022 under "D" disclosure rules. Trade-press coverage and the MRTS monthly data suggest those four are also in the stuck or near-stuck bucket.
Subsector (NAICS) 2019 share 2022 share Change (pp) Nonstore retailers (454) 65.6% 70.7% +5.1 Electronic shopping (4541) 74.6% 77.9% +3.3 Clothing & accessories (448) 4.6% 6.9% +2.3 Sporting goods/hobby/books (451) 4.3% 6.0% +1.7 Furniture & home furnishings (442) 1.9% 3.3% +1.4 Electronics & appliances (443) 2.0% 3.0% +1.0 Food & beverage stores (445) 1.1% 2.9% +1.8 Building material & garden (444) 0.6% 0.8% +0.2 Total retail (44-45) 10.6% 14.4% +3.8
Is your category still gaining online share?
We'll send the full category penetration breakdown plus what it means for your plan. Free.
Check your inbox — we'll send the full category penetration breakdown shortly.
Why "DTC has won" is wrong for grocery, beauty, and building materials
The stuck categories aren't stuck because operators haven't tried. They're stuck because the unit economics of online fulfillment work poorly against the in-store alternative.
Grocery (food and beverage stores at 2.9%) loses on last-mile cost. Pick-pack and delivery on a $40 grocery basket typically eats $8-15 fully loaded (a figure consistent with Instacart's pre-IPO unit-economics disclosures and Coresight Research grocery delivery analyses). The customer won't pay that as a delivery fee, and the grocer can't absorb it on a 1-3% retail margin. Even when Instacart or Amazon Fresh handles the fulfillment, the picker time and refrigerated delivery costs cap how big online grocery can get without subsidies.
Building materials (NAICS 444) loses on bulk and project urgency. A homeowner replacing a leaking water heater needs it today and can't ship a 150-pound appliance economically. Same for lumber, bagged concrete, garden supplies. Online order placement helps for accessories and small tools (Home Depot's app drives meaningful traffic) but the dollar share of physical movement online stays low.
Gas stations (NAICS 447) is a definitional problem, not a behavior problem. You can't pump gas online. The category exists because Census reports it.
Beauty and health/personal care (NAICS 446) is the interesting suppression. Census didn't publish a 2022 number, but industry trade-press estimates (2025 ecommerce stats compilations) put category-level online penetration at roughly 17%. That's "stuck" on the Census report (suppressed in 2022) but mid-cycle in trade-press estimates, and well below where you'd expect for a high-margin, low-weight, easy-to-ship product category. Subscription DTC brands have done well in pockets (skincare, supplements, telehealth), but the bulk of category sales still moves through drugstores and mass retailers.
The read for operators: if your category lands here, "DTC has won" is a story your investor told you. The data says the channel still has to be earned customer by customer, not ridden up by category drift.
The mid-cycle categories still have runway
Clothing, sporting goods/hobby, and furniture are the categories where online share is still adding 1-2 points every few years. That matters because it changes what "growth" means.
In a saturated category, your only growth lever is share-take from a direct online competitor. In a mid-cycle category, you can grow by taking share from in-store competitors as the channel itself shifts. For a $5M-$50M apparel or sporting-goods brand, that distinction is the difference between fighting Amazon at scale and converting a customer who used to buy at a local store.
The growth-multiple chart above is built from the Monthly Retail Trade Survey (MRTS), March 2026 versus March 2020 by NAICS subsector. Nonstore retailers (the bucket pure-play DTC sits in) grew 2.03x. Total retail grew 1.55x. Food and beverage stores grew 1.05x. Furniture grew 1.45x. Clothing grew 2.52x but that's inflated by the March 2020 baseline (apparel stores were closed during the initial COVID shutdown), so treat the apparel number as directional.
The trade-press read confirms the data. Modern Retail (April 15, 2026) flagged home and furniture as "saturated or cycle-tied" because of weak housing demand. Retail Dive (May 23, 2026) said home retailers are facing a "weak will get weaker" 2026. eMarketer's 2026 outlook frames food and beverage as the biggest single-category online growth engine for the year because the rest of e-commerce is in maturity phase. That matches the Census numbers.
What this means for your 2026 ops decisions
Three concrete moves to make this quarter, depending on where your category lands.
If you're in a mid-cycle category (apparel, sporting goods, hobby, furniture), keep paid acquisition aggressive. The category-level tide is still rising 1-2 points per year. Some of that channel-shift growth lands in your bucket if you have the unit economics to compete. The right benchmark is whether you're growing faster than your category's e-commerce growth rate (roughly 8-12% YoY for these subsectors), not faster than total e-commerce. If your category online share is still climbing and you're losing share inside it, that's a CFO-call problem, not a marketing problem.
If you're in a saturated nonstore category, your growth has to come from share-take, not category drift. Anonymized notes across recent founder calls confirm this directly: operators in supplements, magnesium, and other under-Amazon categories often have more demand left to capture on the channel they're already on than on a new channel. Channel diversification when your category is already 70%+ online is often the wrong move. Go deeper before you go wider.
If you're in a stuck category, treat retail media as a real budget line. Modern Retail (January 6, 2026) reported Kroger and CVS planning massive in-store digital-screen rollouts in 2026. The grocery and pharmacy categories are where shopper attention still lives offline. If you sell in food, beverage, health/personal care, or pet, the ad-spend math has shifted: paid social CPMs keep climbing while retail media inventory expands. Retailer-owned advertising (Instacart, Amazon Ads, Walmart Connect, Kroger Precision Marketing) is now a core line, not a side experiment.
The 16.9% headline isn't the story. The story is which bucket your category sits in. If you sell apparel or hobby/sporting goods, the channel is still doing some of your growth work for you. If you sell food or beauty, online channel-share isn't moving and you have to take share. If you sell pure-play digital, you're already at 70%+ and the only lever is going deeper on the channel you already own. Pick your bucket. Plan against it.
For more on how to think about channel-mix economics when category penetration plateaus, see our work on DTC cost of goods benchmarks (the margin math behind whether share-take is profitable for you) and average e-commerce return rates by category (returns are the hidden penalty on apparel's mid-cycle growth). If your channel-mix decision needs CFO-level stress-testing, our fractional CFO services for e-commerce overview covers how we work this kind of decision with $5M-$150M DTC operators.
Sources and methodology
Quarterly Retail E-Commerce Sales (Census Bureau, Economic Indicators Division). The headline 16.9% Q1 2026 figure is from CB26-81, released May 18, 2026. Seasonally adjusted e-commerce sales of $326,740M divided by total retail of $1,929,027M. The full historical series back to Q4 1999 is published at census.gov/retail/ecommerce.html. Census defines e-commerce as "sales of goods and services where the buyer places an order, or the price and terms of the sale are negotiated, over an Internet, mobile device, extranet, EDI network, electronic mail, or other comparable online system." Payment doesn't have to be online to count.
Restated series and the nonemployer methodology break. The April 2025 benchmark revision dropped nonemployer establishments from the quarterly e-commerce series, which means pre-2025 quarterly figures and 2025+ figures aren't strictly comparable on the original basis. Census restated portions of the historical series to remove nonemployers. We use the restated values throughout this post (notably Q1 2025 at 16.0% from CB26-81 Table 1, not the original 16.2% release). Census has not yet republished a full restated baseline back to 2019, so the pre-2025 quarterly figures in the line chart are the original series with that caveat noted.
Annual Retail Trade Survey, ARTS (Census Bureau). Category-level breakdown of e-commerce by NAICS subsector. The 1998-2022 file was released January 29, 2024, revised September 25, 2024. Shares are computed as e-commerce sales divided by total sales per NAICS row. Suppression codes: "D" means withheld to avoid disclosing individual companies, "S" means does not meet publication standards, "ZZ" means less than $500K. Motor vehicle (441), health/personal care (446), gas stations (447), and general merchandise (452) were suppressed in 2022 ("D") and are omitted from our charts. ARTS 2023 has not been released as of May 2026; the typical schedule is a January release for the prior year minus two.
Monthly Retail Trade Survey, MRTS (Census Bureau). Used for the category-level growth-multiple chart (March 2026 versus March 2020, seasonally adjusted, by NAICS subsector). Total retail (NAICS 44000) grew from $420,954M to $653,040M (1.55x). Nonstore retailers (454) grew from $66,854M to $136,011M (2.03x). Clothing's 2.52x is inflated by the March 2020 COVID baseline (apparel stores closed). Gas stations partly reflects price, not unit growth.
Census 16.9% versus Digital Commerce 360 23.1%, on purpose. Digital Commerce 360, using a broader Commerce Department basis that includes more goods-and-services categories and treats nonemployers differently, estimated full-year 2025 US e-commerce penetration at 23.1%. eMarketer's 2026 forecast sits between Census and DC360 because it includes services. We use Census throughout this post because (a) it's the official benchmark, (b) it ties cleanly to the NAICS category data, and (c) most operator decisions key off the Census number when investors and analysts cite "e-commerce share." If you read a higher number elsewhere, it isn't wrong; it's a different definition. Both are useful, but they don't substitute for each other.
Limitations. ARTS 2023 is not yet released, so the most recent annual category-level breakdown stops at 2022. Quarterly data extends through Q1 2026 but isn't broken out by NAICS subsector. The April 2025 nonemployer methodology break means the 2019-to-2022 ARTS shares and the 2025+ quarterly shares aren't fully comparable on the same basis (ARTS includes nonemployers, the restated quarterly series does not). Pure e-commerce is undercounted in some categories (Amazon Fresh and Instacart may report under nonstore retailers rather than under food and beverage stores, depending on entity classification), which makes grocery's stuck-bucket position look slightly worse than it might actually be on a like-for-like operator basis.
Frequently asked questions
what percent of us retail is ecommerce in 2026?
16.9% in Q1 2026, seasonally adjusted (Census CB26-81, released May 18, 2026). That's e-commerce sales of $326.7 billion on total retail sales of $1,929.0 billion. The share has climbed every year since 2019 (10.2%) and is up 0.9 points from Q1 2025.
which retail categories have the highest ecommerce share?
Two: nonstore retailers (NAICS 454) at 70.7% and electronic shopping & mail-order houses (NAICS 4541) at 77.9%, both from the 2022 ARTS. These categories are saturated by definition because they capture marketplaces and pure-play digital sellers. After those, clothing (6.9%) and sporting goods/hobby/books (6.0%) lead the traditional brick-and-mortar categories.
is ecommerce growth slowing down or just shifting categories?
Mostly shifting. Total share is still rising (+0.9 points Q1 2025 to Q1 2026, faster than +0.1 the year before) but the growth is uneven. Apparel, sporting goods, and furniture are still gaining 1-2 points of share every few years. Food & beverage, building materials, and gas stations barely move.
why is grocery ecommerce penetration still under 5 percent?
Cost-to-serve economics. Grocery has tight margins, perishable inventory, and last-mile fulfillment costs that swallow most of the unit economics unless you batch. The Census food & beverage stores category (NAICS 445) was 2.9% e-commerce in 2022. Some of that gap is reporting (Instacart and Amazon Fresh classify under nonstore retailers in some cases) but the dollar share of grocery moving through online ordering remains small.
what's the ecommerce share for apparel and clothing brands right now?
6.9% in 2022 ARTS, up from 4.6% in 2019. That's the most recent year Census publishes by category. Clothing and accessories (NAICS 448) is the textbook mid-cycle category: high enough penetration to matter, still adding points of share every year, big enough headroom that share-take from in-store competitors is a real growth lever for a DTC brand.
has dtc e-commerce share peaked or is there room to grow?
Depends on your category. Nonstore retailers (the bucket that includes pure-play DTC plus marketplaces) is near saturated at 70-78%. If you sell under NAICS 454 you can't ride category drift much higher. But your retail-subsector peer (apparel, beauty, sporting goods, etc.) is the right denominator: in those categories online share is still climbing 1-2 points every few years.
what's the difference between the census quarterly and annual ecommerce numbers?
The quarterly release (CB26-81) gives you the all-retail headline (16.9% Q1 2026) but not the NAICS category split. The Annual Retail Trade Survey (ARTS) gives you the category split (clothing 6.9%, food 2.9%, etc.) but only through 2022. ARTS 2023 typically lands in January 2027. For the category story you have to use the older annual data and live with the lag.
why does digital commerce 360 say us ecommerce is 23.1% when the census says 16.9%?
Different definitions. Census Quarterly Retail E-Commerce Sales is based on the Monthly Retail Trade Survey, covers retail (NAICS 44-45), and (since the April 2025 benchmark) excludes nonemployer establishments. Digital Commerce 360 uses a broader Commerce Department goods-and-services basis. Both are correct for what they measure. We use Census throughout this post because it's the official benchmark and ties cleanly to the category-level NAICS data.