
Financial Strategy
Home Goods Financial Benchmarks 2026
Across six public home-goods comps in 2026, gross margin runs 30% to 56% with a median near 42%, but median operating margin is only about 4%. Home goods is won or lost below the gross-margin line: CAC of $60-120, furniture returns near 23%, and slow 2.5-3.3x inventory turns decide profitability.
Key Takeaways
- Home goods gross margin runs 30-56%, median about 42% across six public comps (FY2025 10-Ks). Lighter branded goods sit high (Lovesac 56.4%); heavy casegoods and marketplace models sit low (Wayfair 30.2%).
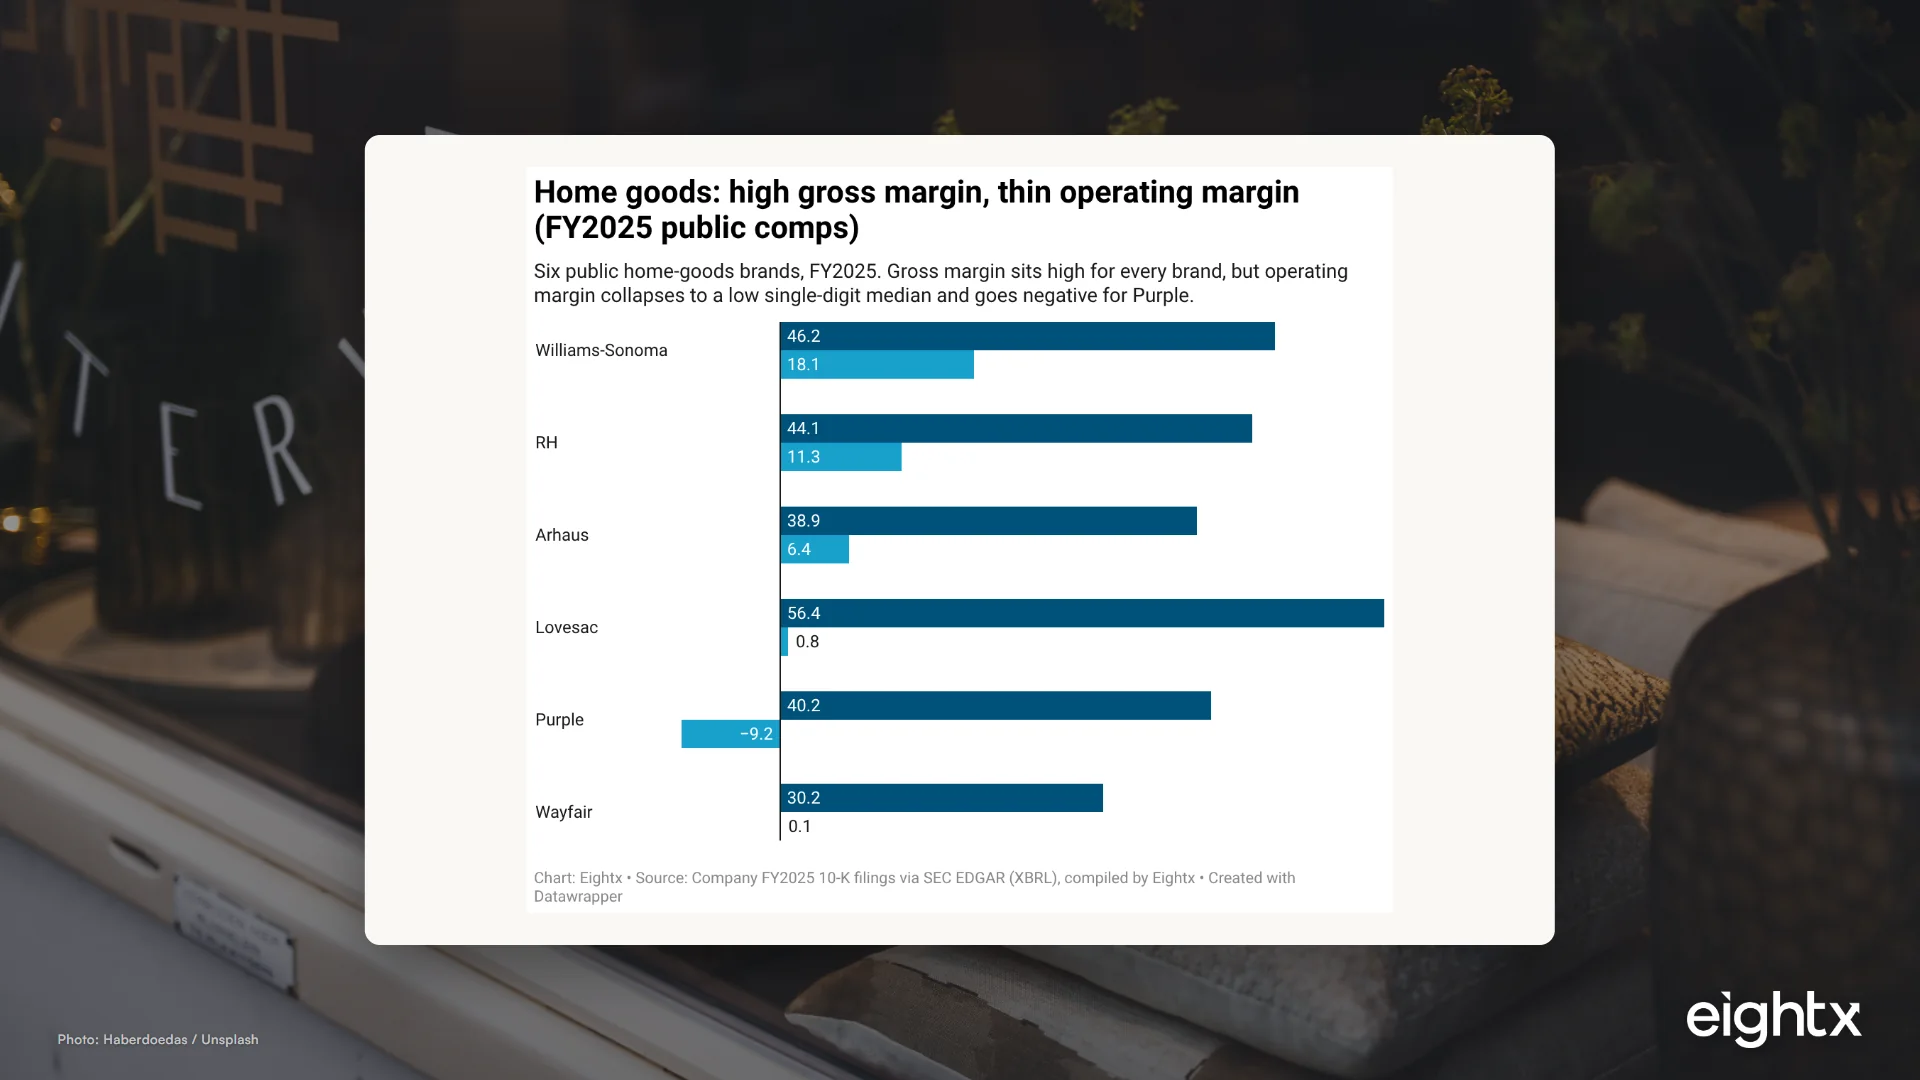
- Operating margin is where brands separate: median just ~3.6%, and two of six are at or below breakeven. Williams-Sonoma posts 18.1%; Purple runs -9.2%. Same category, a 27-point operating-margin spread.
- DTC home-goods CAC clusters at $60-120, with a Home & Garden median near $60 (Polar Analytics). On a low-frequency category, you usually can't make it back on a fast second order.
- High AOV is the structural advantage: ~$240-270 for furniture-weighted DTC. That is what lets a home-goods brand survive a $90 CAC that would kill a $40-AOV supplement brand.
- Returns are the silent margin-killer on big-and-bulky: ~15-22% of online sales. Furniture returns hit 22.7%, and one reverse-logistics trip on a couch can cost more than the margin on the item.
Every home goods founder asks the same question, and gets a different answer from every blog: "are my margins normal?" The reason the answers conflict is that most benchmark posts blend furniture, decor, bedding and kitchenware into one mush. This report fixes that by going to the source: the FY2025 10-Ks of six public home-goods companies, computing the same metrics for each, and laying them next to the DTC-operator benchmark ranges. AOV is average order value; CAC is customer acquisition cost.
The headline is a spread, not a single number. Gross margin runs 30-56% (median about 42%), but operating margin collapses to a roughly 4% median and goes negative for the brands that can't cover the cost of acquiring a customer and shipping a couch. In home goods, gross margin is the easy part. The money is won or lost on the three lines underneath it.
The one number everyone asks for, and why it's the wrong one
When I talk to founders running a home-goods brand, the first thing they want is a single gross-margin number to measure themselves against. I understand the instinct, but it's the wrong target. Gross margin in this category is wide and mostly structural: it's set by what you sell and how you source it, not by how well you run the business.
Look at the two ends of the public set. Lovesac, a DTC modular-furniture brand selling light foam-and-fabric product with strong branding, posts a 56.4% gross margin. Wayfair, a marketplace that barely touches the product, posts 30.2% because it's really earning a take-rate, not a product margin. Both are "home goods." Neither number tells you whether the business is healthy.
The number that does tell you is the one underneath. Williams-Sonoma turns its 46.2% gross margin into an 18.1% operating margin. Lovesac turns its higher 56.4% gross margin into 0.8%. Same category, similar gross margin, a 17-point gap in what actually drops to operating profit. The pattern we see again and again is that founders obsess over the gross-margin line because it's the one they can move with a pricing change, while the lines that actually decide the year (CAC, returns, freight) get treated as someone else's department. Reverse that and you'll make better decisions.
The 2026 home goods benchmark table
Here is the full six-comp set, every figure computed from the FY2025 10-K. We keep all six in the table for credibility, but compute the "typical brand" read on the four pure inventory-holding operators (Williams-Sonoma, RH, Arhaus, Lovesac), because Wayfair (marketplace) and Purple (loss-making mattress) are useful range-definers that would muddy a median.
| Company | Ticker | FY2025 revenue | Gross margin | Operating margin | Inventory turns | Model |
|---|---|---|---|---|---|---|
| Williams-Sonoma | WSM | $7.81B | 46.2% | 18.1% | 3.26x | Multi-brand vertical retailer |
| RH | RH | $3.44B | 44.1% | 11.3% | n/a (mixed) | Luxury furniture + hospitality |
| Arhaus | ARHS | $1.38B | 38.9% | 6.4% | 2.65x | Premium furniture, made-to-order |
| Lovesac | LOVE | $0.70B | 56.4% | 0.8% | n/a | DTC modular furniture |
| Purple Innovation | PRPL | $0.47B | 40.2% | -9.2% | n/a | DTC mattress / bedding |
| Wayfair | W | $12.46B | 30.2% | 0.1% | ~115x (dropship) | Marketplace / dropship |
The chart makes the point the table buries in numbers: the gross-margin bars are all tall and roughly comparable, and then the operating-margin bars collapse, all the way through zero in Purple's case. A 27-point operating-margin spread (18.1% at the top, -9.2% at the bottom) on a 26-point gross-margin spread is the whole story of this category. The brands didn't separate on what they sell. They separated on what it costs to acquire the customer and deliver the product.
Gross margin: what drives the 30-56% range
Three things move gross margin in home goods, and none of them is "how good your finance team is."
First, model structure. A vertical retailer that designs, sources and sells its own product (Williams-Sonoma) captures the full product margin. A made-to-order premium brand (Arhaus, 38.9%) carries more cost in the product itself. A marketplace (Wayfair, 30.2%) doesn't own the margin at all; it earns a take-rate on someone else's product, which is why its gross margin looks low next to brands that look similar on the shelf.
Second, product weight and category. Light, brandable goods (Lovesac's foam-and-fabric) sit high. Heavy casegoods (dining tables, dressers) carry freight inside cost of goods and sit lower. This is why "home goods" as a single benchmark is misleading: a decor-and-textiles brand and a casegoods brand are not in the same margin universe.
Third, branding power. The brands that command a price premium (RH at 44.1%, Lovesac at 56.4%) hold gross margin that commodity sellers can't. When we've struggled with this on the operator side, the lever that worked was narrowing the assortment to the items where the brand actually earns a premium, and dropping the me-too SKUs that were quietly dragging blended margin down. Gross margin is mostly structural, but assortment is the one piece of it you control.
The three lines that eat your margin: CAC, returns and freight
This is where the operating margin goes. Start with the benchmark band a healthy DTC home-goods brand should be aiming at in 2026.
CAC clusters at $60-120, with a Home & Garden median near $60 (Polar Analytics, 4,000+ Shopify brands). Growth brands leaning on Meta and TikTok routinely run $80-100+, and DTC CAC overall has risen 25-40% since 2021. In home goods that increase lands on a category with low purchase frequency: you don't buy a sofa twice a year, so you usually can't earn the CAC back on a fast second order. It has to clear on the first order's contribution margin or it doesn't clear at all.
The one structural advantage is AOV. Furniture-weighted DTC runs about $240-270 (Mida 2026 puts Home & Furniture at $264). That high AOV is the saving grace: a $90 CAC against a $264 order is survivable, where the same $90 CAC against a $40 supplement order is a death sentence. When I talk to founders this size, the ones who are winning have stopped chasing a lower CAC and started defending the AOV, because the AOV is what makes the whole model math work.
Then returns. Furniture returns hit 22.7%, bedding & bath 21.3%, home decor 19.4% (Eightx 2026). The headline rate understates the damage, because reverse logistics on big-and-bulky items is brutal: one returned couch can cost more than the gross margin on the item, so that return doesn't just zero out, it goes negative.
The way we frame this for operators is in contribution-margin layers. Gross margin (CM1) lands 40-55% in this category. Take out variable fulfillment, freight and returns and you're at CM2, roughly 28-40%. Take out paid acquisition and you reach CM3, the real per-order profit, often just 10-20%. The brands that quietly fail are the ones that manage to CM1, see a healthy number, and never run the math down to CM3 where the couch returns and the $90 CAC actually live.
Inventory turns and the cash trap
The last line is the one that doesn't show up on the P&L at all: how many times a year you turn slow, expensive inventory.
Inventory-holding home-goods brands turn stock roughly 2.5-3.3x a year. Williams-Sonoma turned inventory 3.26x in FY2025 (cost of goods $4.20B over average inventory $1.29B); Arhaus turned it 2.65x. That's about 110-145 days of product sitting in a warehouse before it sells, against 4-6x for apparel and 6-8x for electronics. Wayfair's ~115x "turns" is the exception that proves the rule: it barely holds inventory ($76M on $12.5B revenue) because it's a dropship marketplace, not an inventory owner. Structure dictates the benchmark.
Slow turns are a direct cash drain, and the drain is worse than the turn number alone suggests. Add supplier deposits paid before production starts and long overseas lead times, and the cash leaves the business months before the sale brings it back. The pattern we see again and again: a brand posts a profit on the P&L and still can't make payroll, because the "profit" is sitting in a container on the water or stacked in a 3PL. One operator we worked alongside was carrying about 140 days of inventory and financing all of it on a line of credit; the business was profitable on paper and one bad month from a cash crisis. For the mechanics of this line, see our guide to average inventory turnover by vertical.
This is why home goods, more than almost any consumer category, is a working-capital business wearing a margin business's clothing. If you don't manage turns, deposits and lead times as deliberately as you manage CAC, the cash trap will catch you while your income statement still looks fine.
How to benchmark your own brand
Here's the order I'd run it in.
- Compute your real gross margin (revenue minus landed cost of goods, including inbound freight). Put it against the 40-55% band. If you're below 40% and you're not a marketplace, fix sourcing or assortment before anything else.
- Pull CAC by channel, not blended. The blended number hides the channel that's quietly running at $150. Compare to the $60-120 band.
- Measure AOV by sub-category. Defend it. This is the lever that makes your CAC affordable; a sub-category dragging AOV down is dragging the whole model down.
- Track return rate by product type. A 19% blended rate can hide a 30% rate on one bulky SKU line that's wiping out its own margin on reverse logistics.
- Calculate your inventory turns and days of inventory, then layer in deposits and lead times to see your true cash cycle. This is where profitable-on-paper brands discover the trap.
Run those five and compare to the table above, and you'll know which line is your binding constraint. Usually it's exactly one. For how this same math plays out in an adjacent category, see our apparel financial benchmark. And if you want a second set of eyes on which line is costing you the most, that's the core of our interim CFO services.
Gross margin is the easy part in home goods. A 46%-gross-margin business and a 56%-gross-margin business can end the year at 18% and 0.8% operating margin, and the difference is entirely in three lines: what it costs to acquire the customer, what it costs when the couch comes back, and how long your cash sits in inventory before the sale returns it. Benchmark those, not the gross margin.
Sources and methodology
Primary source: SEC EDGAR XBRL financial statements (FY2025, filed February through April 2026). Figures were pulled via SEC EDGAR for six companies: Williams-Sonoma (CIK 719955, fiscal year ended 2026-02-01), RH (CIK 1528849), Arhaus (CIK 1875444), Lovesac (CIK 1701758), Purple Innovation (CIK 1643953), and Wayfair (CIK 1616707). Gross margin is gross profit divided by revenue; operating margin is operating income divided by revenue; inventory turns is cost of revenue divided by two-point average inventory.
Worked figures. Williams-Sonoma: revenue $7,806.8M, gross profit $3,603.1M, operating income $1,415.7M, cost of goods $4,203.8M, average inventory $1,289.4M, turns 3.26x. Arhaus: revenue $1,379.2M, gross profit $536.4M, operating income $88.9M, cost of goods $842.8M, average inventory $317.9M, turns 2.65x. RH: revenue $3,439.5M, operating income $387.3M. Lovesac: revenue $697.1M, operating income $5.4M. Purple: revenue $468.7M, operating income -$43.0M. Wayfair: revenue $12,457M, operating income $17M, inventory $76M (marketplace, so the turns figure is not a comparable inventory-management metric and is excluded from the comparison).
A note on inventory turns for Lovesac and Purple. Both report merchandise inventory under company-specific XBRL tags rather than the standard frame, which returned a stale value this run. Rather than publish a number we can't cleanly reconcile, those cells are marked n/a; they can be computed directly from each 10-K balance sheet if a complete row is wanted. We use two-point average inventory for the turns we do publish; a single-point basis would produce a slightly different figure, so treat turns as directional.
Operator benchmark ranges (2026). CAC: Polar Analytics 2026 (4,000+ Shopify brands), Home & Garden median near $60; general DTC CAC up 25-40% since 2021 (Yotpo 2026 DTC index). AOV: Mida 2026 Home & Furniture $264, Flowium 2026 Home & Garden $240-260, smaller-decor benchmarks $50-150. Return rates: Eightx 2026 (furniture 22.7%, bedding & bath 21.3%, home decor 19.4%, kitchen appliances 15.8%, garden 14.2%), against NRF 2025 overall ecommerce returns near 19.3%. Inventory turns context: Rework (furniture 3-5x); Finaloop (DTC median days-of-inventory near 129).
The contribution-margin layers (CM1 40-55%, CM2 28-40%, CM3 10-20%) are Eightx house operator benchmarks, paired throughout with the third-party anchors above so the report reads independently. The big-and-bulky returns framing reflects what we see across home-goods operators, not any single named brand.
Category breadth: Storeleads, Shopify stores by category tag, pulled 2026-06-11. Home & Garden (all sub-tags) totals 356,335 stores; Bed & Bath 24,828 (7,977 US, 966 on Shopify Plus); Kitchen & Dining 36,030. Treat these as a measure of category breadth and fragmentation, not a revenue estimate, since the available tier did not return per-store revenue or AOV fields.
Frequently asked questions
what is a good gross margin for a home goods brand?
Across six public home-goods comps the FY2025 range is 30-56% with a median near 42%. For a DTC brand holding its own inventory, target the 40-55% band. Below 40% and you have very little room to absorb CAC, freight and returns; the marketplace/dropship model (Wayfair, 30%) is the exception because it earns a take-rate, not a product margin.
what is the average cac for a home goods ecommerce brand?
DTC home-goods CAC clusters around $60-120, with a Home & Garden median near $60 (Polar Analytics, 4,000+ Shopify brands). Growth brands leaning hard on Meta and TikTok routinely run $80-100+. Because home goods is a low-frequency purchase, you usually can't earn that CAC back on a quick repeat order, so it has to clear on the first order's contribution margin.
why is my home goods operating margin so much lower than my gross margin?
Because the money in home goods is won or lost on the three lines under gross margin: CAC, returns and freight on big-and-bulky items. A 46%-gross-margin brand can end the year at 18% operating margin, and a 56%-gross-margin brand can end at 0.8%. The gross-margin line tells you almost nothing about whether the business actually makes money.
what is the average return rate for furniture sold online?
Furniture-specific online return rates run high-teens to low-20s; Eightx's 2026 analysis puts furniture at 22.7%, bedding & bath at 21.3% and home decor at 19.4%. The bigger problem is cost: reverse logistics on a couch or dining table can cost more than the product's gross margin, which is why keep-it refunds, restocking fees and final-sale-on-custom policies exist.
what is a normal average order value for a home goods store?
Furniture-weighted DTC runs about $240-270 AOV (Mida 2026 puts Home & Furniture at $264). Smaller decor and textiles brands run far lower, often $50-150. The high AOV is the category's structural advantage: it is what lets a home-goods brand survive a $90 CAC that would bankrupt a $40-AOV brand.
what inventory turn rate is healthy for a dtc home goods brand?
Inventory-holding home-goods brands turn stock roughly 2.5-3.3x a year (Williams-Sonoma 3.26x, Arhaus 2.65x), which is ~110-145 days of inventory. Target 3-5x. That is slow versus apparel (4-6x) or electronics (6-8x), and it is why home-goods brands can be profitable on paper but cash-poor.
why do home goods brands run out of cash even when they're profitable on paper?
Slow turns plus supplier deposits plus long overseas lead times means cash leaves months before the sale comes back. At 2.5-3.3x turns you are financing 110-145 days of inventory, often with a deposit paid before production even starts. A brand can post a profit on the P&L and still be unable to make payroll because the cash is sitting in a container or a warehouse.
how do home goods brand margins compare to apparel and beauty?
Home goods sits in the middle: 40-55% gross margin, vs apparel at 50-65% and beauty at 60-75%. But home goods has the worst returns-plus-freight drag of the three because the items are heavy, and its 3-5x inventory turns are slower than beauty's 6-10x. Higher AOV is the offset that keeps the model viable.
Related Eightx benchmarks: Home Goods Ecommerce 2026 and Church & Dwight Operating Margin 16.8%.