
eCommerce
New Zealand Online Retail Share 2026: 25% or 13%?
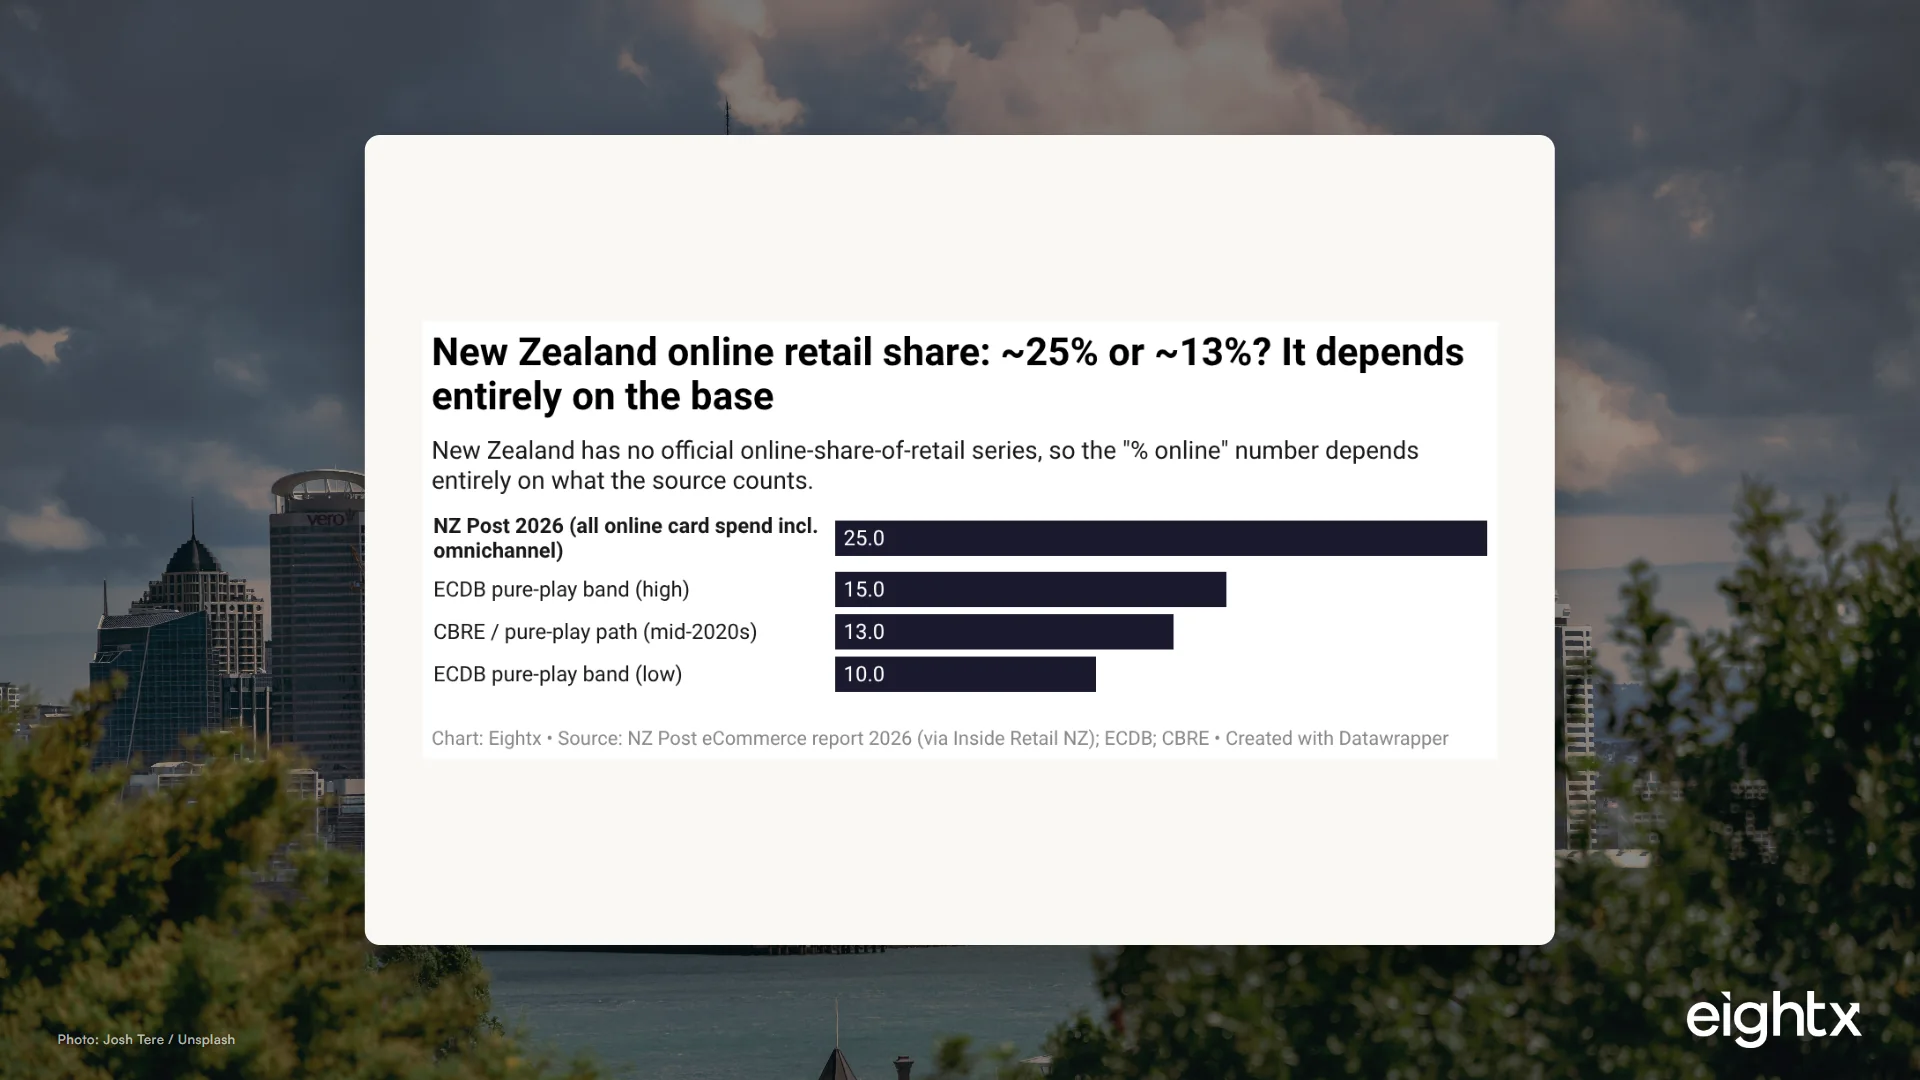
New Zealand has no official online retail share. NZ Post's 2026 eCommerce report says almost one in four retail dollars (~25%) is now spent online, counting all online card spend, while pure-play estimates from ECDB and CBRE put penetration near 10 to 15%. Which number you use depends entirely on the base.
Key Takeaways
- New Zealand has no official online-share-of-retail series. Stats NZ's Retail Trade Survey reports total retail value (~NZ$32b in the March 2026 quarter) but contains no online-vs-in-store split, so every '% online' figure you see is a third-party estimate, not an official number.
- NZ Post's June 2026 report says almost one in four retail dollars (~25%) is now spent online, on a base that counts all online card spend including omnichannel grocers and big-box retailers. That is the strongest single headline number available for the NZ market.
- Pure-play estimates land near half that: ~10 to 15%. ECDB and CBRE only count online-native retailers (an ~NZ$6.6b market per IBISWorld), so the two credible numbers diverge ~2x largely on what they count, not on a data dispute.
- Domestic retailers still own roughly four of every five online dollars (79.6%). Even with Temu reaching 45% of NZ online shoppers and Trade Me leading on traffic, local sellers hold the spend, and Amazon is a secondary player here unlike Australia.
- The platform long tail is Shopify-led: of ~41,679 tracked NZ ecommerce stores, 28,547 (68.5%) run Shopify and 13,132 (31.5%) run WooCommerce, with 573 on Shopify Plus. Demand is recovering (real volumes +4.5% YoY) but April-2026 consumer confidence hit a three-year low.
If you run an ecommerce brand that sells into New Zealand, here is a question you cannot answer from the official statistics: what share of NZ retail is actually online? Stats NZ, the national statistics agency, publishes total retail value (around NZ$32b a quarter) but no online-vs-in-store split at all. So every "% online" number you have ever seen for New Zealand is somebody's estimate, and the two most credible estimates are almost double each other. That gap is the whole story, and it has real consequences for how you read your own dashboard against "the market."
The number you can't get from the official stats
Australia's ABS used to publish an online-retail share and then stopped. The UK's ONS still publishes one. The US Census publishes one every quarter. New Zealand never has. Stats NZ's Retail Trade Survey gives you total retail value and volume by industry, seasonally adjusted, but there is no field anywhere in it for "online vs in-store." We confirmed this against the Stats NZ topic page and through two independent research passes: no official online-share series exists, and even the Electronic Card Transactions data is split by industry and card type, not card-present vs card-not-present, so you cannot cleanly back one out either.
That means the headline figure is always borrowed from a third party, and the third parties disagree by a factor of two depending on what they count.
When we talk to founders sizing up a new geography, the first thing we tell them is that a market-penetration number is useless until you know its denominator. New Zealand is the cleanest example of that rule we have found. Pick the wrong base and you will either conclude the market is mature and saturated or wide open with room to run, from the exact same country in the exact same year.
NZ Post's answer: almost one in four dollars
The strongest single number available comes from NZ Post. Its June 2026 eCommerce report states that "almost one in four retail dollars spent in New Zealand is now spent online," which puts the online share at roughly 25%. NZ Post sits on the delivery and card-spend data for a huge slice of NZ commerce, so this is not a small sample. The same report carries the supporting detail: roughly 6 million more online transactions year-on-year (+6%), physical-store spend up only 2%, average online transaction value up 4% to NZ$120, and domestic retailers holding 79.6% of total online spending.
The dollar total behind that share, from NZ Post-linked coverage, is around NZ$12.4b of total online card spend in 2025, up about 10% year-on-year. That is the broad base. A narrower "online goods" base for 2024 was closer to NZ$6.1b. Those two numbers are different bases and different years, so do not read them as a clean growth line.
| Metric | Value | Period | Source |
|---|---|---|---|
| Total online spend | ~NZ$12.4b (+10% YoY) | 2025 | NZ Post (via coverage) |
| Online goods spend | ~NZ$6.1b (+5% YoY) | 2024 | NZ Post-linked |
| Online share of retail | ~25% ("one in four dollars") | 2026 report | NZ Post / Inside Retail NZ |
| Extra online transactions YoY | ~6 million (+6%) | 2025 vs 2024 | NZ Post 2026 report |
| Average online order value | NZ$120 (+4%) | 2026 report | NZ Post 2026 report |
| Domestic share of online spend | 79.6% | 2025 | NZ Post Market Sentiments 2025 |
The 79.6% domestic figure is the one most operators underweight. Despite all the noise about cross-border platforms, local sellers still capture roughly four of every five online dollars in New Zealand, and domestic average order value rose 5% while international fell 1%. The pattern we see again and again with brands localising for ANZ is that they overestimate the cross-border leakage and underbuild the local fulfilment and trust signals that actually win that 80%.
Get the numbers behind the headline.
The Margin breaks down one real DTC/CPG finance decision a week. Free.
Check your inbox. We'll send The Margin shortly.
Why your dashboard might say 13% instead
If you pull a penetration number from ECDB, IBISWorld, or CBRE, you will get something closer to 10 to 15%, not 25%. That is not a contradiction. Those sources count pure-play, online-native retailers only. They are measuring a different thing. IBISWorld sizes the NZ "online shopping" industry at about NZ$6.5b in 2025 and NZ$6.6b in 2026. CBRE, working from industrial-property analysis, traces penetration from 10 to 12% in 2024 toward 14 to 16% by 2029. ECDB reports 10 to 15% for both 2025 and 2026.
NZ Post's ~25% includes the online sales of omnichannel grocers and big-box retailers (think Woolworths NZ and The Warehouse putting transactions through their websites). The pure-play estimates strip all of that out. So the ~2x gap is largely definitional: no one has reconciled the two bases line-by-line, but the difference is driven by what each source counts, not by a dispute over the underlying data.
| Source | Reported online share / spend | Period | What it counts |
|---|---|---|---|
| NZ Post eCommerce report | ~25% ("one in four dollars"); ~NZ$12.4b online spend | 2025/2026 | All online card spend incl. omnichannel and big-box retailers |
| ECDB | 10-15% of retail | 2025-2026 | Pure-play / online-native ecommerce share |
| CBRE | 10-12% (2024) to 14-16% (2029) | 2024-2029 | Ecommerce penetration path (industrial-property analysis) |
| IBISWorld | NZ$6.5b (2025) / NZ$6.6b (2026) market size | 2025-2026 | Online Shopping industry revenue (pure-play) |
| Stats NZ Retail Trade Survey | No online share published | Mar 2026 qtr | Total retail value only, no online vs in-store split |
For your own reporting, the practical move is simple: decide which base your revenue belongs to before you benchmark. If you are a pure-play DTC brand, the 10 to 15% pure-play world is your comparison set, and measuring yourself against NZ Post's 25% will make the market look more saturated than it is for you. When we have struggled to reconcile a client's "we're losing share" panic with the data, the answer has nearly always been that they were comparing their pure-play growth to an all-channel benchmark. The number was never the problem. The base was.
New Zealand in context: UK-like or below Australia?
Put New Zealand next to the countries that do publish an official series and the definitional problem becomes a strategic one. On official bases, the UK leads at about 28%, the US sits near 17%, and Australia is around 12.7%. New Zealand straddles the whole range. On its pure-play estimate it looks like Australia (~13%); on NZ Post's base it looks like the UK (~25%).
New Zealand appears twice on that chart on purpose. It is the only country here without an official online-share series, so it is the only one that has to be plotted as a range rather than a point. That is not a charting quirk, it is the single most useful thing to understand about the NZ market. For ANZ market-entry timing, it changes the story: if you believe the pure-play read, NZ has as much headroom as Australia and you are early; if you believe the all-channel read, the market is closer to mature and you are competing for share, not creating a category. Most operators we talk to treat ANZ as one region for planning, which is reasonable for logistics, but the penetration read is not the same on both sides of the Tasman, and pretending it is will mis-time your spend.
Who actually wins the clicks and the dollars
The on-the-ground competitive picture in New Zealand looks different from Australia in one important way: Amazon is not the gravity well here. By shopper reach, Temu now touches 45% of NZ online shoppers, ahead of Chemist Warehouse (42%), The Warehouse (32%) and Kmart (32%). Trade Me, the homegrown marketplace, remains the most-visited NZ ecommerce site by traffic. Amazon, via amazon.com.au, is a secondary player. By revenue, IBISWorld puts Woolworths NZ and The Warehouse Group at the top.
| Retailer | Share of NZ online shoppers (%) |
|---|---|
| Temu | 45 |
| Chemist Warehouse | 42 |
| The Warehouse | 32 |
| Kmart | 32 |
Underneath the big names sits the long tail where most independent brands actually live, and it is overwhelmingly Shopify. Of about 41,679 tracked NZ ecommerce stores in Storeleads, 28,547 (68.5%) run Shopify and 13,132 (31.5%) run WooCommerce, with 573 NZ stores on Shopify Plus. That is a Shopify-dominant SMB base under a thin enterprise layer, which matters when you are choosing a platform, hiring agency support, or estimating how crowded your category really is. Our New Zealand Shopify landscape breakdown goes deeper on that store base if you are sizing the local competitive set.
| Platform | Tracked NZ stores | Share of tracked NZ stores (%) |
|---|---|---|
| Shopify | 28,547 | 68.5 |
| WooCommerce | 13,132 | 31.5 |
| Shopify Plus (subset of Shopify) | 573 | 1.4 |
| Total tracked NZ stores | 41,679 | 100.0 |
The demand backdrop and what to do with it
The macro picture is recovering but jumpy. Stats NZ real retail volumes rose 0.9% quarter-on-quarter and 4.5% year-on-year into the March 2026 quarter, the sixth consecutive quarterly rise, and total retail value reached about NZ$32b, up 6.1% year-on-year.
Then the mood turned. ANZ-Roy Morgan consumer confidence collapsed to about 80.3 in April 2026, a three-year low, on fuel and geopolitical shocks, with the "good time to buy a major household item" sub-index sitting at -25. That is the line item that should worry a DTC operator, because confidence-driven pullbacks hit discretionary and big-ticket categories first, and that is exactly where most online brands sell.
New Zealand is the geo where the cleanest official number simply does not exist. NZ Post says one in four dollars; the pure-play world says one in eight. Both are correct for what they measure. Your job is not to pick the "right" share, it is to know which base matches your own revenue, then benchmark, plan, and forecast against that one. Get the base wrong and every comparison you make is noise.
So what should you actually do with all this? Three things. First, decide your base: pure-play DTC benchmarks against the 10 to 15% world, omnichannel benchmarks against the ~25% world, and never mix them in the same forecast. Once you have picked your base, our New Zealand ecommerce KPI benchmark gives you the conversion, AOV, and retention numbers to measure your own dashboard against. Second, treat ANZ as one logistics region but two penetration markets when you plan spend, because NZ is not just "small Australia." Third, build a softer Q2-Q3 demand scenario given the April confidence drop, and protect margin over volume until the confidence number recovers. If you want the same treatment for the other side of the Tasman, our Australia online retail share benchmark runs the equivalent numbers, and our interim CFO services team can map any of this onto your actual P&L.
Sources and methodology
Stats NZ Retail Trade Survey, March 2026 quarter. Total retail value (seasonally adjusted, current prices) was about NZ$32b in the March 2026 quarter, up 2.2% quarter-on-quarter (NZ$683m) and 6.1% year-on-year. Total volume (seasonally adjusted, real) was about NZ$26b, up 0.9% quarter-on-quarter and 4.5% year-on-year, the sixth consecutive quarterly volume rise. The critical limitation for this post: the Retail Trade Survey has no online-vs-in-store breakdown, and Stats NZ has never published an official online-share series. Earlier-quarter value context (June, September, December 2025) is reported to the nearest NZ$b in the public release narrative; finer granularity requires the downloadable Retail Trade Survey CSV, which was not pulled for this edition.
NZ Post eCommerce report 2026 and Market Sentiments 2025. The headline figure, "almost one in four retail dollars spent in New Zealand is now spent online" (~25%), was verified against Inside Retail NZ's coverage of the NZ Post report (11 June 2026). The same coverage carries roughly 6 million more online transactions year-on-year (+6%), physical-store spend up 2%, average online transaction value up 4% to NZ$120, domestic average order value up 5% and international down 1%, and domestic retailers holding 79.6% of total online spending. The NZ$12.4b 2025 total online card spend (+10% YoY) figure is coverage-derived rather than from a primary NZ Post URL, and is attributed as such; the 2024 online-goods base of about NZ$6.1b (+5% YoY) is the narrower goods measure.
Pure-play and industry estimates. ECDB's "E-Commerce Industry in New Zealand 2018-2030" reports online share of 10 to 15% for both 2025 and 2026. IBISWorld sizes the NZ "Online Shopping" industry at NZ$6.5b (2025) and NZ$6.6b (2026). CBRE traces penetration from 10 to 12% in 2024 toward 14 to 16% by 2029. These pure-play bases count only online-native retailers, which is why they land near half of NZ Post's all-online-spend figure.
Cross-country comparison. The bases differ by country and this comparison is directional, not exact. Australia's ABS reported 12.7% online of total retailing (June 2025, original terms). The UK's ONS reported 28.0% in October 2025 (internet sales as a share of total retail, series J4MC). The US Census reported 16.9% for Q1 2026. New Zealand is the only one of the four without an official series, so it is plotted as a range from ~13% (pure-play) to ~25% (NZ Post).
Platform mix and retailer reach. The platform split is a Storeleads geo cut for New Zealand (June 2026): 41,679 total tracked stores, of which Shopify 28,547 (68.5%), WooCommerce 13,132 (31.5%), and Shopify Plus 573. The active-store filter returned zero in this pull, so the counts are total-tracked rather than active-filtered, and should be read as platform-mix shares. Retailer reach figures (Temu 45%, Chemist Warehouse 42%, The Warehouse 32%, Kmart 32%) come from the IAB New Zealand 2025 PureProfile Commerce Report; Trade Me as most-visited and Temu as a leading traffic site are from Similarweb (September 2025); revenue leaders Woolworths NZ and The Warehouse Group are from IBISWorld (2026).
Demand and confidence backdrop. ANZ-Roy Morgan consumer confidence was about 80.3 in April 2026 (a three-year low; major-purchase sub-index -25). Westpac IQ first-impressions covered the March 2026 Retail Trade Survey and the April spend pullback. Triangulation across Perplexity and Parallel.ai confirmed that Stats NZ publishes no online-share series and surfaced the NZ Post, ECDB, IBISWorld, and cross-country comparators; Parallel.ai additionally confirmed Retail NZ's Annual Report 2024-25 citing Stats NZ total retail sales of NZ$120b for the year to 31 March 2025 (year to 31 March 2025, one year behind the quarterly series above, so not annualized against it here).
Frequently asked questions
what percentage of retail sales in new zealand are made online in 2026?
It depends on the base. NZ Post's June 2026 eCommerce report says almost one in four retail dollars (~25%) is now spent online, counting all online card spend. Pure-play estimates from ECDB and CBRE put it closer to 10 to 15% because they only count online-native retailers. There is no official Stats NZ figure to settle it.
does stats nz publish an official online retail share figure?
No. The Stats NZ Retail Trade Survey reports total retail value (around NZ$32b in the March 2026 quarter) and volume, but it has never published an online-vs-in-store breakdown. Electronic Card Transactions data is split by industry and card type, not card-present vs card-not-present, so even a clean Stats-based proxy is not directly available.
why does nz post say one in four dollars is online but other sources say 13%?
Different bases. NZ Post counts all online card spend, including the online sales of omnichannel grocers and big-box retailers, which inflates the share to ~25%. ECDB and IBISWorld count only pure-play online-native retailers (an ~NZ$6.6b market), which lands near 10 to 15%. Both are right for what they measure.
how does new zealand ecommerce penetration compare to australia and the uk?
On official national-statistics bases the UK leads near 28% and the US sits near 17%, while Australia is around 12.7%. New Zealand has no official series, so it plots as a range: ~13% on a pure-play estimate, like-for-like with Australia, or ~25% on NZ Post's all-online-spend base, closer to the UK.
which platforms hold the most market share in new zealand online retail?
By shopper reach, Temu leads at 45% of NZ online shoppers, ahead of Chemist Warehouse (42%), The Warehouse (32%) and Kmart (32%). Trade Me is the most-visited NZ ecommerce site by traffic. By revenue, IBISWorld puts Woolworths NZ and The Warehouse Group as the largest online-shopping companies.
how much did new zealanders spend online in 2025?
NZ Post-linked coverage puts 2025 total online card spend around NZ$12.4b, up roughly 10% year-on-year, with about 6 million more online transactions than the prior year and average online order value up 4% to NZ$120. The narrower online-goods base for 2024 was around NZ$6.1b. Treat the two figures as different bases, not a clean time series.
what is the nz alternative to amazon for online shopping?
Trade Me is the closest thing New Zealand has to a homegrown Amazon: it is the most-visited local ecommerce site and a default marketplace for many shoppers. Amazon (via amazon.com.au) is only a secondary player in NZ, unlike in Australia, while Temu has rapidly become the widest-reaching cross-border platform.
is online retail spending in new zealand still growing in 2026?
Yes, but the backdrop is fragile. Stats NZ real retail volumes rose 4.5% year-on-year into the March 2026 quarter, the sixth straight quarterly rise. Then ANZ-Roy Morgan consumer confidence collapsed to about 80.3 in April 2026, a three-year low, with the major-purchase sub-index at -25, so discretionary online spend faces a tougher Q2.
what does the weak april 2026 consumer confidence reading mean for my dtc brand in nz?
It is a warning to plan for softer non-essential demand into Q2 and Q3. Tighten your forecast scenarios, hold inventory discipline, and protect margin rather than chasing volume. The recovery in retail volumes is real but confidence-driven pullbacks hit discretionary and big-ticket categories first, which is exactly where most DTC brands sit.