
Insights
Public DTC margin leaderboard FY2025: even Lululemon compressed 260 bps, six peers are losing money
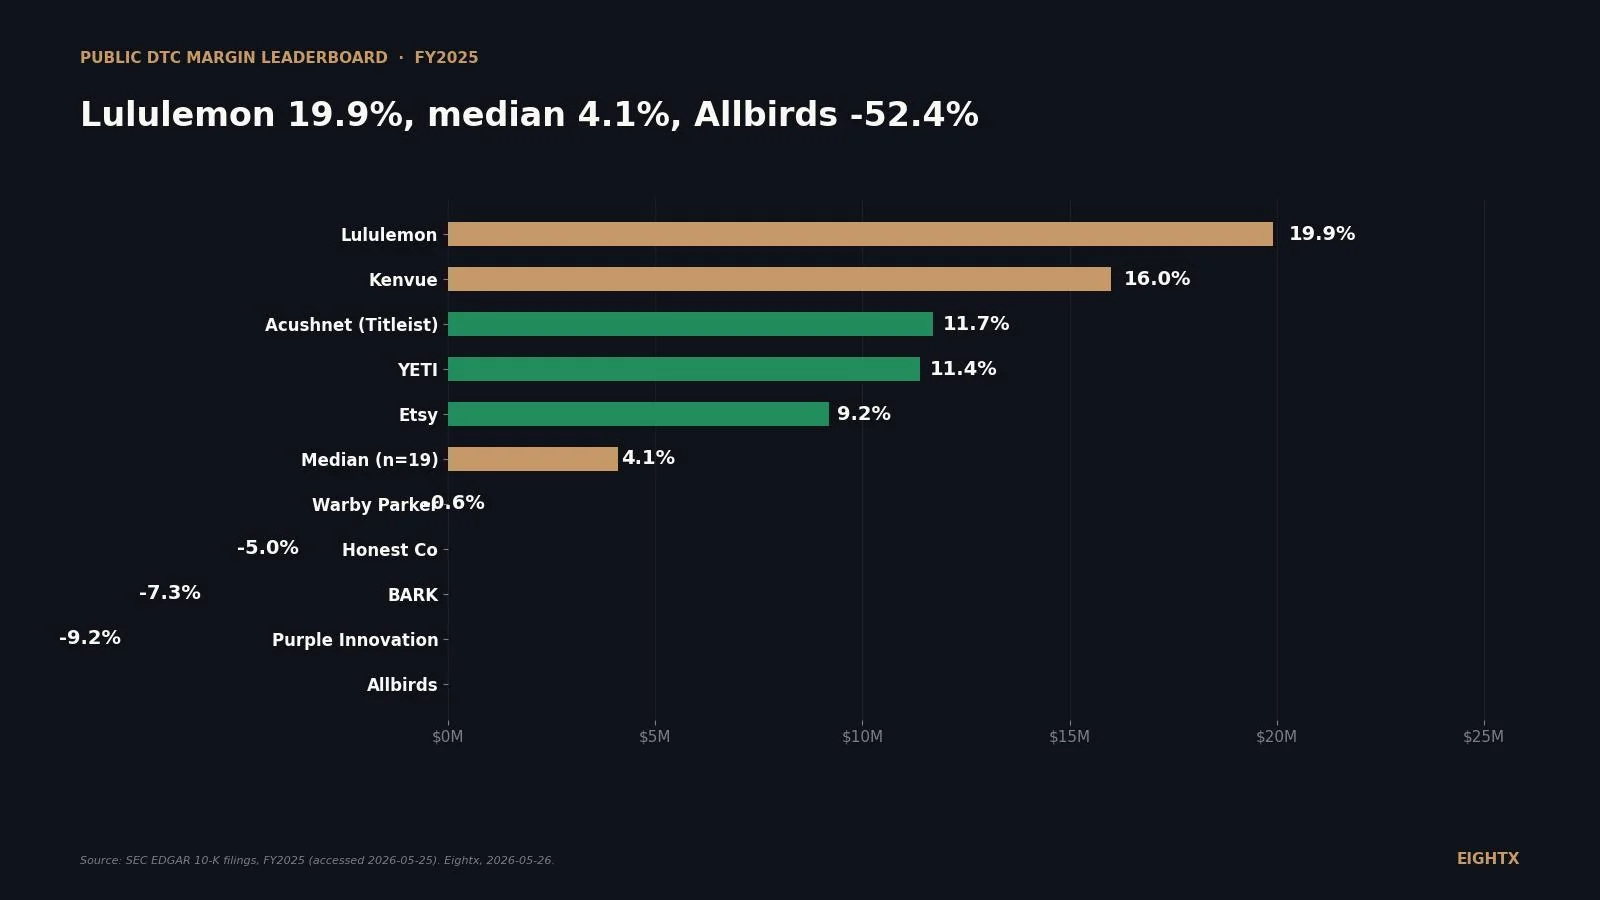
Across 19 public DTC brands in FY2025, the median operating margin is 4.1% and six brands are losing money. Lululemon leads at 19.9% operating margin, Allbirds sits at negative 52.4%, and even the leaderboard winners compressed gross margin year over year. For private operators benchmarking an exit or a capital raise, 4.1% is the realistic peer median, not the 10 to 15% figure that circulates in founder communities.
Key Takeaways
- Lululemon led the FY2025 public DTC operating-margin board at 19.9%, with Kenvue at 16.0%. No other public DTC-relevant brand cleared a 15% operating margin. The median of the 19-brand peer set was 4.1%.
- Even the leaderboard winner gave back margin. Lululemon's gross margin compressed 260 basis points year-over-year to 56.6%. Allbirds gave back 120 bps to 43.2%. Warby Parker gave back 230 bps to 54.0%. The cohort is squeezing, not expanding.
- Six of 19 public DTC peers posted negative operating income in FY2025: Allbirds (-52.4%), Purple (-9.2%), BARK (-7.3%), Honest Co (-5.0%), PetMed Express (-0.7%), Warby Parker (-0.6%). That is one in three losing money at the operating line, before tax or impairment.
- Crocs and Coty look broken at net but are profitable in operations. Crocs printed $149.5M of operating income and a $81M net loss; Coty printed 4.1% operating margin and a -6.2% net margin. The gap in both cases is non-cash goodwill and brand impairment, not operating economics.
- Public-DTC median gross margin (56.6%) is roughly equal to private 8-figure brand median gross margin (~56%). Top-quartile private brands clear ~20% net margin, which is better than the public leaderboard winner. The takeaway: do not benchmark your private brand against the public 16% leader. Benchmark against the top private quartile instead.
Across 19 public companies that sell direct to consumer (footwear, apparel, eyewear, beauty, pet, scrubs, home, OTC health, golf), the FY2025 10-Ks tell a polarized story. Lululemon and Kenvue cleared a 16% operating margin. Six of 19 (Allbirds, Purple, BARK, Honest Co, PetMed Express, Warby Parker) posted negative operating income. The median operating margin across the peer set was 4.1%, and even the leaderboard winner compressed gross margin 260 basis points year-over-year. The cohort is squeezing, not expanding. Here is what we expect from FY2026 and how to read these numbers against your own P&L.
How the public DTC margin leaderboard stacks up, FY2025
Lululemon led the operating-margin board at 19.9% on $11.10B of revenue. Kenvue (the Johnson & Johnson consumer-health spin-off) was second at 16.0% on $15.12B. No other brand in our cohort cleared 15%. Acushnet (Titleist) and YETI tied the next tier in the low-double-digits, then Etsy dropped into single digits.
Six of 19 brands lost money at the operating line. Allbirds is the most extreme case in the cohort, burning roughly $80M of operating income on $152.5M of revenue (-52.4% operating margin). The chart below caps Allbirds at -15% so the rest of the leaderboard stays legible; the actual figure is more than three times worse than any other peer.
The 4.1% median is what most readers should anchor on. If you run a private brand and your operating margin sits between 4% and 10%, you are in the same band as the public peer set, not below it. If you sit below zero, you are in the bottom third of public DTC, and the playbook is the same one Allbirds, Purple, and Honest are running: cut SG&A, defend gross margin, and slow new-customer acquisition until the unit economics work.
For reference, Duolingo (a high-margin language-learning subscription) printed a 13.1% operating margin in FY2025. We left it out of the chart because it is not consumer goods, but it sits between Kenvue and YETI on the board and is a useful reminder that high-margin digital-subscription models clear levels that physical-goods DTC rarely does.
Five ways to rank the public DTC cohort
The tables below are rebuilt directly from each company's audited annual reports for 45 publicly-traded DTC and CPG brands (latest annual report, fiscal year 2024 or later). Each cut ranks the same cohort a different way — growth, profitability trajectory, cost structure, and a contribution-margin proxy. This block refreshes on the earnings cycle; the rest of the page is hand-analyzed.
Revenue growth (YoY)
Who is still compounding the top line versus who is shrinking. Cohort median: 1.9% across 45 companies.
Top 10
| # | Ticker | Company | Category | FY | Revenue growth |
|---|---|---|---|---|---|
| 1 | CELH | Celsius Holdings | beverage CPG | FY2025 | 85.5% |
| 2 | HIMS | Hims & Hers Health | telehealth DTC | FY2025 | 59.0% |
| 3 | VITL | Vital Farms | food CPG | FY2025 | 25.3% |
| 4 | ELF | e.l.f. Beauty | beauty CPG | FY2026 | 24.6% |
| 5 | BOOT | Boot Barn | footwear retail | FY2026 | 17.9% |
| 6 | BRBR | BellRing Brands | food CPG | FY2025 | 16.1% |
| 7 | FIGS | FIGS | apparel DTC | FY2025 | 13.6% |
| 8 | WRBY | Warby Parker | eyewear DTC | FY2025 | 13.0% |
| 9 | URBN | Urban Outfitters | apparel retail | FY2026 | 11.1% |
| 10 | MNST | Monster Beverage | beverage CPG | FY2025 | 10.7% |
Bottom 10
| # | Ticker | Company | Category | FY | Revenue growth |
|---|---|---|---|---|---|
| 1 | PETS | PetMed Express | pet DTC | FY2026 | -21.1% |
| 2 | BARK | Bark Inc. | pet DTC | FY2026 | -18.5% |
| 3 | BYND | Beyond Meat | food CPG | FY2025 | -15.6% |
| 4 | FNKO | Funko | collectibles DTC | FY2025 | -13.5% |
| 5 | HAIN | Hain Celestial | food CPG | FY2025 | -10.2% |
| 6 | SKIN | Beauty Health | beauty CPG | FY2025 | -10.0% |
| 7 | HELE | Helen of Troy | household CPG | FY2026 | -6.4% |
| 8 | SFIX | Stitch Fix | apparel DTC | FY2025 | -5.3% |
| 9 | SPB | Spectrum Brands | household CPG | FY2025 | -5.2% |
| 10 | NWL | Newell Brands | household CPG | FY2025 | -5.0% |
Gross margin
Gross profit as a share of revenue — the structural ceiling on every brand's economics. Cohort median: 46.0% across 44 companies.
Top 10
| # | Ticker | Company | Category | FY | Gross margin |
|---|---|---|---|---|---|
| 1 | HIMS | Hims & Hers Health | telehealth DTC | FY2025 | 73.8% |
| 2 | ETSY | Etsy | marketplace DTC | FY2025 | 71.6% |
| 3 | ELF | e.l.f. Beauty | beauty CPG | FY2026 | 70.7% |
| 4 | OLPX | Olaplex | haircare CPG | FY2025 | 69.4% |
| 5 | FIGS | FIGS | apparel DTC | FY2025 | 66.5% |
| 6 | SKIN | Beauty Health | beauty CPG | FY2025 | 65.3% |
| 7 | COTY | Coty | beauty CPG | FY2025 | 64.8% |
| 8 | LEVI | Levi Strauss | apparel DTC+wholesale | FY2025 | 61.7% |
| 9 | BARK | Bark Inc. | pet DTC | FY2026 | 61.3% |
| 10 | CROX | Crocs | footwear DTC | FY2025 | 58.3% |
Bottom 10
| # | Ticker | Company | Category | FY | Gross margin |
|---|---|---|---|---|---|
| 1 | BYND | Beyond Meat | food CPG | FY2025 | 2.8% |
| 2 | THS | TreeHouse Foods | food CPG | FY2024 | 16.4% |
| 3 | HAIN | Hain Celestial | food CPG | FY2025 | 21.4% |
| 4 | PETS | PetMed Express | pet DTC | FY2026 | 28.1% |
| 5 | CHWY | Chewy | pet DTC | FY2026 | 29.8% |
| 6 | BRBR | BellRing Brands | food CPG | FY2025 | 33.3% |
| 7 | HNST | Honest Co | personal care DTC | FY2025 | 33.3% |
| 8 | NWL | Newell Brands | household CPG | FY2025 | 33.8% |
| 9 | URBN | Urban Outfitters | apparel retail | FY2026 | 36.0% |
| 10 | AEO | American Eagle | apparel retail | FY2026 | 36.5% |
Operating margin
Profit after operating costs — what is left once you run the business, before tax and one-offs. Cohort median: 4.5% across 44 companies.
Top 10
| # | Ticker | Company | Category | FY | Operating margin |
|---|---|---|---|---|---|
| 1 | MNST | Monster Beverage | beverage CPG | FY2025 | 29.2% |
| 2 | LULU | Lululemon | apparel DTC+retail | FY2026 | 19.9% |
| 3 | CHD | Church & Dwight | household CPG | FY2025 | 17.4% |
| 4 | KVUE | Kenvue | consumer health CPG | FY2025 | 16.0% |
| 5 | BRBR | BellRing Brands | food CPG | FY2025 | 15.4% |
| 6 | BOOT | Boot Barn | footwear retail | FY2026 | 13.3% |
| 7 | ULTA | Ulta Beauty | beauty retail | FY2026 | 12.4% |
| 8 | GOLF | Acushnet (Titleist) | sporting goods DTC | FY2025 | 11.7% |
| 9 | VITL | Vital Farms | food CPG | FY2025 | 11.6% |
| 10 | YETI | Yeti | outdoor DTC | FY2026 | 11.4% |
Bottom 10
| # | Ticker | Company | Category | FY | Operating margin |
|---|---|---|---|---|---|
| 1 | BYND | Beyond Meat | food CPG | FY2025 | -121.1% |
| 2 | HELE | Helen of Troy | household CPG | FY2026 | -43.8% |
| 3 | PETS | PetMed Express | pet DTC | FY2026 | -32.8% |
| 4 | HAIN | Hain Celestial | food CPG | FY2025 | -29.6% |
| 5 | BARK | Bark Inc. | pet DTC | FY2026 | -10.2% |
| 6 | PRPL | Purple Innovation | mattress DTC | FY2025 | -9.2% |
| 7 | SKIN | Beauty Health | beauty CPG | FY2025 | -6.9% |
| 8 | FNKO | Funko | collectibles DTC | FY2025 | -5.0% |
| 9 | HNST | Honest Co | personal care DTC | FY2025 | -5.0% |
| 10 | SFIX | Stitch Fix | apparel DTC | FY2025 | -3.1% |
Net margin
Bottom-line profit as a share of revenue, after everything including tax and impairments. Cohort median: 3.4% across 44 companies.
Top 10
| # | Ticker | Company | Category | FY | Net margin |
|---|---|---|---|---|---|
| 1 | BYND | Beyond Meat | food CPG | FY2025 | 79.5% |
| 2 | LULU | Lululemon | apparel DTC+retail | FY2026 | 14.2% |
| 3 | CHD | Church & Dwight | household CPG | FY2025 | 11.9% |
| 4 | BOOT | Boot Barn | footwear retail | FY2026 | 10.0% |
| 5 | KVUE | Kenvue | consumer health CPG | FY2025 | 9.7% |
| 6 | BRBR | BellRing Brands | food CPG | FY2025 | 9.3% |
| 7 | ULTA | Ulta Beauty | beauty retail | FY2026 | 9.3% |
| 8 | YETI | Yeti | outdoor DTC | FY2026 | 8.8% |
| 9 | VITL | Vital Farms | food CPG | FY2025 | 8.7% |
| 10 | ENR | Energizer | household CPG | FY2025 | 8.1% |
Bottom 10
| # | Ticker | Company | Category | FY | Net margin |
|---|---|---|---|---|---|
| 1 | HELE | Helen of Troy | household CPG | FY2026 | -50.3% |
| 2 | HAIN | Hain Celestial | food CPG | FY2025 | -34.0% |
| 3 | PETS | PetMed Express | pet DTC | FY2026 | -32.0% |
| 4 | PRPL | Purple Innovation | mattress DTC | FY2025 | -11.0% |
| 5 | BARK | Bark Inc. | pet DTC | FY2026 | -9.9% |
| 6 | HBI | Hanesbrands | apparel CPG | FY2024 | -9.1% |
| 7 | FNKO | Funko | collectibles DTC | FY2025 | -7.4% |
| 8 | COTY | Coty | beauty CPG | FY2025 | -6.2% |
| 9 | HNST | Honest Co | personal care DTC | FY2025 | -4.2% |
| 10 | NWL | Newell Brands | household CPG | FY2025 | -4.0% |
Free cash flow margin
Operating cash flow minus capex, as a share of revenue — the cash the business actually throws off. Cohort median: 5.1% across 37 companies.
Top 10
| # | Ticker | Company | Category | FY | Free cash flow margin |
|---|---|---|---|---|---|
| 1 | MNST | Monster Beverage | beverage CPG | FY2025 | 23.7% |
| 2 | ETSY | Etsy | marketplace DTC | FY2025 | 23.5% |
| 3 | CHD | Church & Dwight | household CPG | FY2025 | 17.6% |
| 4 | CROX | Crocs | footwear DTC | FY2025 | 16.3% |
| 5 | OLPX | Olaplex | haircare CPG | FY2025 | 13.8% |
| 6 | CELH | Celsius Holdings | beverage CPG | FY2025 | 12.9% |
| 7 | SKIN | Beauty Health | beauty CPG | FY2025 | 12.4% |
| 8 | ELF | e.l.f. Beauty | beauty CPG | FY2026 | 11.6% |
| 9 | KVUE | Kenvue | consumer health CPG | FY2025 | 11.4% |
| 10 | YETI | Yeti | outdoor DTC | FY2026 | 11.3% |
Bottom 10
| # | Ticker | Company | Category | FY | Free cash flow margin |
|---|---|---|---|---|---|
| 1 | BYND | Beyond Meat | food CPG | FY2025 | -57.1% |
| 2 | PETS | PetMed Express | pet DTC | FY2026 | -18.4% |
| 3 | PRPL | Purple Innovation | mattress DTC | FY2025 | -8.9% |
| 4 | VITL | Vital Farms | food CPG | FY2025 | -6.3% |
| 5 | FNKO | Funko | collectibles DTC | FY2025 | -4.2% |
| 6 | SFIX | Stitch Fix | apparel DTC | FY2025 | 0.9% |
| 7 | EPC | Edgewell | personal care CPG | FY2025 | 1.5% |
| 8 | ENR | Energizer | household CPG | FY2025 | 2.1% |
| 9 | CRI | Carter's | apparel CPG | FY2026 | 2.4% |
| 10 | GCO | Genesco | footwear retail | FY2026 | 3.4% |
Operating-profit growth (YoY)
Operating-income change year over year — real earnings power, before impairments and tax noise. Cohort median: -2.0% across 33 companies.
Top 10
| # | Ticker | Company | Category | FY | Operating-profit growth |
|---|---|---|---|---|---|
| 1 | FIGS | FIGS | apparel DTC | FY2025 | 1584.2% |
| 2 | LEVI | Levi Strauss | apparel DTC+wholesale | FY2025 | 157.9% |
| 3 | CHWY | Chewy | pet DTC | FY2026 | 125.8% |
| 4 | SAM | Boston Beer | beverage CPG | FY2025 | 90.7% |
| 5 | HIMS | Hims & Hers Health | telehealth DTC | FY2025 | 70.6% |
| 6 | MOV | Movado | accessories | FY2026 | 49.0% |
| 7 | RVLV | Revolve | apparel DTC | FY2025 | 44.4% |
| 8 | VITL | Vital Farms | food CPG | FY2025 | 39.1% |
| 9 | CHD | Church & Dwight | household CPG | FY2025 | 33.5% |
| 10 | KVUE | Kenvue | consumer health CPG | FY2025 | 31.1% |
Bottom 10
| # | Ticker | Company | Category | FY | Operating-profit growth |
|---|---|---|---|---|---|
| 1 | OLPX | Olaplex | haircare CPG | FY2025 | -89.6% |
| 2 | CROX | Crocs | footwear DTC | FY2025 | -85.4% |
| 3 | COTY | Coty | beauty CPG | FY2025 | -55.9% |
| 4 | ELF | e.l.f. Beauty | beauty CPG | FY2026 | -53.4% |
| 5 | EPC | Edgewell | personal care CPG | FY2025 | -51.5% |
| 6 | AEO | American Eagle | apparel retail | FY2026 | -47.1% |
| 7 | CRI | Carter's | apparel CPG | FY2026 | -43.5% |
| 8 | NWL | Newell Brands | household CPG | FY2025 | -41.8% |
| 9 | HBI | Hanesbrands | apparel CPG | FY2024 | -30.2% |
| 10 | ETSY | Etsy | marketplace DTC | FY2025 | -30.0% |
COGS efficiency (lowest COGS % of revenue)
Lowest cost of goods as a share of revenue — the sourcing-and-pricing-power leaders. Cohort median: 54.3% across 45 companies.
Lowest COGS % (most efficient)
| # | Ticker | Company | Category | FY | COGS efficiency |
|---|---|---|---|---|---|
| 1 | HIMS | Hims & Hers Health | telehealth DTC | FY2025 | 26.2% |
| 2 | ETSY | Etsy | marketplace DTC | FY2025 | 28.4% |
| 3 | ELF | e.l.f. Beauty | beauty CPG | FY2026 | 29.3% |
| 4 | OLPX | Olaplex | haircare CPG | FY2025 | 30.6% |
| 5 | FIGS | FIGS | apparel DTC | FY2025 | 33.5% |
| 6 | SKIN | Beauty Health | beauty CPG | FY2025 | 34.7% |
| 7 | COTY | Coty | beauty CPG | FY2025 | 35.2% |
| 8 | LEVI | Levi Strauss | apparel DTC+wholesale | FY2025 | 38.3% |
| 9 | BARK | Bark Inc. | pet DTC | FY2026 | 38.7% |
| 10 | CROX | Crocs | footwear DTC | FY2025 | 41.7% |
Highest COGS % (least efficient)
| # | Ticker | Company | Category | FY | COGS efficiency |
|---|---|---|---|---|---|
| 1 | NWL | Newell Brands | household CPG | FY2025 | 66.2% |
| 2 | HNST | Honest Co | personal care DTC | FY2025 | 66.7% |
| 3 | BRBR | BellRing Brands | food CPG | FY2025 | 66.7% |
| 4 | CRI | Carter's | apparel CPG | FY2026 | 69.4% |
| 5 | CHWY | Chewy | pet DTC | FY2026 | 70.2% |
| 6 | HAIN | Hain Celestial | food CPG | FY2025 | 78.6% |
| 7 | THS | TreeHouse Foods | food CPG | FY2024 | 83.7% |
| 8 | FNKO | Funko | collectibles DTC | FY2025 | 84.0% |
| 9 | PETS | PetMed Express | pet DTC | FY2026 | 88.2% |
| 10 | BYND | Beyond Meat | food CPG | FY2025 | 97.2% |
CM3 proxy (gross margin after marketing)
Gross margin minus selling & marketing — a conservative public-company stand-in for contribution margin after marketing (CM3). Not true CM3; see methodology. Cohort median: 35.9% across 37 companies.
Top 10
| # | Ticker | Company | Category | FY | CM3 proxy |
|---|---|---|---|---|---|
| 1 | CROX | Crocs | footwear DTC | FY2025 | 56.9% |
| 2 | LEVI | Levi Strauss | apparel DTC+wholesale | FY2025 | 54.8% |
| 3 | BARK | Bark Inc. | pet DTC | FY2026 | 52.6% |
| 4 | FIGS | FIGS | apparel DTC | FY2025 | 51.8% |
| 5 | LULU | Lululemon | apparel DTC+retail | FY2026 | 51.0% |
| 6 | SBH | Sally Beauty | beauty retail | FY2025 | 49.8% |
| 7 | YETI | Yeti | outdoor DTC | FY2026 | 49.6% |
| 8 | ELF | e.l.f. Beauty | beauty CPG | FY2026 | 48.6% |
| 9 | KVUE | Kenvue | consumer health CPG | FY2025 | 46.0% |
| 10 | CELH | Celsius Holdings | beverage CPG | FY2025 | 44.0% |
Why this is a proxy, not true CM3: public companies do not disclose contribution margin. This cut is gross margin minus reported selling & marketing expense, which includes salaries and overhead (not just media), and fulfillment usually sits inside COGS or SG&A. Read it as "gross margin after marketing," a conservative floor for a private brand's CM3. Only 37 of 45 companies tag marketing separately enough to compute it.
Last refreshed: 2026-06-24 from each company's audited annual reports. Cohort: 45 public DTC/CPG brands, latest annual filing. Next refresh: next quarterly earnings wave. Methodology and per-company source filings are in the Sources section below.
Where the model leaks: gross to operating to net
Gross margin alone does not predict operating margin. Hims & Hers had the highest gross margin in the peer set (73.8%) but printed just 4.5% operating margin because subscription-acquisition spending eats the gap. Lululemon's gross margin was 17 points lower (56.6%) but its operating margin was four times higher (19.9%) because SG&A is a smaller share of revenue. The chart below shows where each brand leaks.
Three patterns matter for operators.
The high-gross, low-operating story (Olaplex, e.l.f. Beauty, Coty). Olaplex collapsed from 25.6% operating margin in FY2023 to 1.6% in FY2025: revenue flat at $423M, operating income down from $108M to $7M. Gross margin held at 69%, but SG&A grew from $169M to $243M as the brand bought back distribution and rebuilt marketing. e.l.f. Beauty defended a 70.7% gross margin (UP 50 bps year-over-year on favorable foreign exchange and channel mix, per the FY2025 press release) but still only printed 4.5% at the operating line because the brand is reinvesting hard. This is the structural reality of premium beauty in DTC: the gross margin is real, but defending it costs.
The low-gross, positive-operating story (Chewy, Acushnet). Chewy ran at 29.8% gross margin and still posted $254M of operating income (2.0% margin) because pet-products mass retail at scale does not need a high gross margin if SG&A is held under 28% of revenue. Acushnet at 47.7% gross margin and 11.7% operating margin is the cleanest "low-promo, disciplined SG&A" model in the cohort.
The impairment cases (Crocs, Coty). Both brands took large non-cash goodwill or brand impairments in FY2025 that flow through operating expenses, depressing reported net income. Crocs printed $149.5M of operating profit but a $81M net loss (a $230M gap from impairment of HEYDUDE intangibles). Coty printed 4.1% operating margin but -6.2% net margin (a $609M gap). Two of the largest legacy beauty and consumer names on this list are taking writedowns simultaneously. The businesses are not broken; the carrying value of past acquisitions is.
Company Operating income ($M) Net income ($M) Gap ($M) Reason Crocs 149.5 -81.2 -230.7 Non-cash goodwill / intangibles impairment (HEYDUDE) Coty 241.1 -367.9 -609.0 Non-cash goodwill / brand impairment Olaplex 7.0 -9.3 -16.3 SG&A pressure plus interest expense
The six losing-money public DTC pure-plays and what they're doing about it
Six brands in our cohort posted negative operating income in FY2025. The narratives in each 10-K and Q3 transcript are surprisingly consistent.
Allbirds (BIRD, -52.4% operating margin). Scale problem. Q3 FY2025 gross margin declined 120 basis points to 43.2% on lower volumes, increased promotional activity, and channel-mix pressure (per the Q3 2025 results release). At $152M of revenue, the brand cannot leverage its fixed marketing and overhead. Equity commentary frequently cites Allbirds as the BMO Capital Markets case study for "better gross margins did not translate into EBIT" in DTC footwear.
Purple Innovation (PRPL, -9.2% operating margin). Category demand. DTC mattresses historically exhibit weakening unit economics once customer acquisition cost and returns are fully loaded. Purple's Q1 FY2025 GAAP gross margin was 39.4%, which is below the 50% rule of thumb. The cohort (Casper, Nest, Purple) has been viewed by analysts as structurally challenged for years.
BARK (BARK, -7.3% operating margin). Subscription drag. Consolidated gross margin actually improved 90 basis points year-over-year to roughly 63% (per the Q3 FY2025 earnings transcript) on product-cost work and mix. The operating loss is a customer-acquisition and fixed-cost problem, not a gross-margin problem. If BARK can hold gross margin and trim SG&A, it has a path back to breakeven that the other five do not.
Honest Co (HNST, -5.0% operating margin). Commoditized category. Honest competes against big consumer-packaged-goods incumbents and retailer private label, which forces constant promotion and limits pricing power. Retail and omnichannel distribution (Target, Amazon) drives marketing efficiency that pure DTC cannot match.
PetMed Express (PETS, -0.7% operating margin). Structural. Online pet pharmacy lost share to Chewy's pharmacy ramp and Amazon. The 30.5% gross margin is the lowest in the cohort excluding Chewy, and SG&A leverage is limited.
Warby Parker (WRBY, -0.6% operating margin). Almost there. Gross margin compressed 230 basis points to 54.0% on product, occupancy, lab, and shipping costs growing faster than sales (per the Q3 2025 earnings deck). Warby is closer to a vertically integrated specialty retailer than pure DTC, and the operating loss is small enough that minor SG&A discipline puts the brand back in the black.
If your private brand looks like Allbirds (sub-$200M revenue and negative operating margin), the playbook is the one we coach clients through every week: cut SG&A 15-25% before touching gross margin, freeze new-customer acquisition until contribution margin clears 25%, and renegotiate every variable cost line over 3% of revenue. If your brand looks like Warby (close to breakeven), trim hard for one quarter and the operating math flips.
What this means for your $5M to $150M private brand
Three benchmarks to take from this leaderboard, with a fourth read on how the public set compares to private benchmarks.
Gross margin floor: 50% is structural. Below 50%, marketing and fulfillment eat the operating line unless SG&A is held aggressively low (Chewy is the only convincing exception in our cohort). For most private DTC brands in apparel, beauty, or eyewear, getting to 55%+ gross margin is the foundational job. The 80% gross margin Matt has seen in beauty ("with a beauty, you can pull off 80, 85 gross margin," he told a founder on a Q4 2025 call) is real but rare: it requires high-end prestige positioning, no wholesale dilution, and tight SKU rationalization.
Operating margin target: 4% is median, 10% is top quartile. Most private 7-8 figure operators we work with sit between 5% and 12% operating margin. The public 4.1% median is the floor, not the goal. If you are above 10%, you are top-quartile public DTC and likely top-quartile private as well.
Net margin reality check: don't chase 16%. Lululemon clears 14.2% net margin because of 30 years of brand equity and a category position no one else holds. Most public DTC pure-plays sit between -10% and +10% on net margin. Benchmark your private brand against the top private quartile (approaching 20% per the Finaloop dataset), not against Lulu.
FY2026 is going to look worse for tariff-exposed names. BCG estimates new tariffs could reduce EBITDA margins by 6-14 percentage points for exposed brands. Digital Commerce 360 reported that 71% of brands raised prices and 45% sought new suppliers in response to the end of the de minimis exemption for Chinese goods. If your brand sources from China or any high-tariff country, build your FY2026 plan with 4-8 points of gross margin compression as the base case and price-pass-through as the offset. The brands that defended gross margin in FY2025 (e.l.f. +50 bps, BARK +90 bps) did it through mix and cost work, not price; the brands that lost gross margin (Lululemon -260 bps, Allbirds -120 bps, Warby Parker -230 bps) did it through promo, channel mix, and shipping or occupancy creep.
Ticker Company Period end Revenue ($M) Gross margin Operating margin Net margin LULU Lululemon 2026-02-01 11,102.6 56.6% 19.9% 14.2% KVUE Kenvue 2025-12-28 15,124.0 58.1% 16.0% 9.7% GOLF Acushnet (Titleist) 2025-12-31 2,558.7 47.7% 11.7% 7.4% YETI YETI 2026-01-03 1,868.5 57.4% 11.4% 8.9% ETSY Etsy 2025-12-31 2,883.5 71.6% 9.2% 5.7% RVLV Revolve 2025-12-31 1,225.7 53.5% 6.1% 5.0% FIGS FIGS 2025-12-31 631.1 66.5% 6.0% 5.4% HIMS Hims & Hers 2025-12-31 2,347.6 73.8% 4.5% 5.5% ELF e.l.f. Beauty 2026-03-31 1,636.5 70.7% 4.5% 1.6% COTY Coty 2025-06-30 5,892.9 64.8% 4.1% -6.2% CROX Crocs 2025-12-31 4,040.6 58.3% 3.7% -2.0% CHWY Chewy 2026-02-01 12,601.5 29.8% 2.0% 1.8% OLPX Olaplex 2025-12-31 423.0 69.4% 1.6% -2.2% WRBY Warby Parker 2025-12-31 871.9 54.0% -0.6% 0.2% PETS PetMed Express 2025-03-31 227.0 30.5% -0.7% -2.8% HNST Honest Co 2025-12-31 371.3 33.3% -5.0% -4.2% BARK BARK 2025-03-31 484.2 62.4% -7.3% -6.8% PRPL Purple Innovation 2025-12-31 468.7 40.2% -9.2% -9.2% BIRD Allbirds 2025-12-31 152.5 41.0% -52.4% -50.7%
The 4.1% median operating margin is the gravity well most public DTC brands sit near. Lululemon at 19.9% is not the benchmark; it is a ceiling held by 30 years of brand equity and vertical retail. The actionable benchmark is the median, and the actionable insight is that even the median is compressing.
How we built the leaderboard and what's missing
The full methodology, accession numbers, and known limitations sit in the next section. The headline caveats matter enough to flag here.
ON Holding (ONON) is excluded because the company files Form 20-F as a Swiss foreign private issuer using IFRS taxonomy, and the company's annual report filings does not return structured data under the IFRS namespace for this CIK. ON's publicly disclosed 2025 results (net sales CHF 2.79B, gross margin around 60%, adjusted EBITDA margin around 17%) would place it between Lululemon and YETI on the operating-margin board. We are building a separate workflow to pull ON's IFRS XBRL data for the next quarterly refresh.
The cohort is curated to 19 brands, not exhaustive. Notable omissions include Funko, Solo Brands, Beyond Meat, Stitch Fix, Wayfair, and Peloton. Future quarterly updates will expand the panel as we add IFRS handling and a few more category-relevant names.
Fiscal year-end varies. Lululemon, Chewy, and YETI use 52/53-week years ending late January or early February. e.l.f. Beauty, BARK, and PetMed Express use March year-ends. Coty uses a June year-end. All other peers report on a December calendar year. We use each company's most recently filed annual 10-K covering full fiscal year 2025, even where the period extends into early 2026.
What we're watching next
The Q2 2026 10-Q wave lands between late July and early August. We will refresh the leaderboard then and flag any cohort-level gross-margin movement, especially in tariff-exposed names (Allbirds, Warby Parker, Purple, Honest, Crocs). We are also watching whether Olaplex's SG&A discipline returns it to a 5%+ operating margin and whether Allbirds can stabilize gross margin above 43% on lower volumes.
For more context on private-vs-public DTC margin structure, see our DTC layoff and hiring tracker and the interim CFO services overview. For category-specific gross-margin reads on apparel, see the companion apparel public benchmarks post.
Sources and methodology
Source. Company annual reports filed with the SEC, accessed 2026-05-25. Each company's revenue, gross profit, operating income, and net income were taken from the consolidated statement of operations in the most recent 10-K filing.
Tickers pulled (n=19). ELF, BIRD, WRBY, CHWY, ETSY, LULU, FIGS, PRPL, CROX, YETI, OLPX, HIMS, COTY, KVUE, BARK, GOLF (Acushnet), RVLV, PETS, HNST. ON Holding (ONON) was attempted but excluded; see Limitations below. Duolingo (DUOL) was pulled as a high-margin digital reference and mentioned in prose but is not included in the bar chart, which is restricted to consumer-goods DTC peers.
Fiscal year-end variation. Not all companies report on a calendar year. Lululemon and Chewy use 52/53-week years ending in late January or early February (FY2025 ended 2026-02-01). YETI's FY2025 ended 2026-01-03. e.l.f. Beauty uses a March year-end (FY ended 2026-03-31, labeled FY2025 in EDGAR frames). BARK and PetMed Express also use March year-ends (FY ended 2025-03-31). Coty uses a June year-end (FY ended 2025-06-30). All other peers report on a December calendar year. For this leaderboard, "FY2025" means each company's most recently filed annual 10-K covering full fiscal year 2025, even where the fiscal year extends into early 2026.
Margin computation. Gross margin equals gross profit divided by revenue. Operating margin equals operating income divided by revenue, as reported in each 10-K's consolidated statement of operations. Operating income includes restructuring charges and impairments but excludes interest expense and tax. Net margin equals net income (continuing operations attributable to the parent, where disclosed) divided by revenue. For Crocs and Coty, large non-cash goodwill and intangibles impairment charges flow through operating expenses, which depresses operating margin and explains why net income is materially below operating income.
Limitations. ON Holding (ONON) was excluded because its IFRS XBRL data is not exposed under the SEC annual report filings in the format used for US-GAAP filers; we plan a separate IFRS workflow for the next quarterly update. The 19-brand peer set is curated, not exhaustive; notable omissions include Funko, Solo Brands, Beyond Meat, Stitch Fix, Wayfair, and Peloton. Crocs and Coty net margins reflect non-cash impairment charges that should not be read as broken operating businesses. Acushnet (Titleist) is not pure DTC: Titleist sells through golf-shop and retail channels as well as e-commerce, and is included as a useful "premium consumer brand with strong margin discipline" benchmark.
Update cadence. Quarterly refresh aligned to the earnings cycle. Next planned update: early August 2026 after Q2 10-Q filings. Full-year refresh after the February-to-March 10-K wave each year.
Frequently asked questions
what's the median operating margin for a public dtc brand in fy2025?
4.1% across the 19-brand peer set we tracked. That number is the gravity-well most public DTC brands sit near, not the leaderboard top. Lululemon at 19.9% and Kenvue at 16.0% are outliers, not the benchmark.
which public dtc brands are actually profitable right now?
Thirteen of 19 in our cohort posted positive operating income in FY2025. The five with operating margin above 10% are Lululemon, Kenvue, Acushnet (Titleist), YETI, and Etsy. Six are negative at the operating line: Allbirds, Purple, BARK, Honest Co, PetMed Express, and Warby Parker.
why does hims & hers have a 73% gross margin when allbirds has 41%?
Business model. Hims & Hers is a regulated digital-health subscription with recurring revenue, low cost-of-fulfillment per order, and pricing power tied to clinical relationships. Allbirds is physical footwear with wool inputs, returns, free shipping, and promotional pressure. No physical-goods DTC apparel or footwear brand cleared 60% gross margin in our cohort. That is the category envelope, not a management failure.
why did crocs print a positive operating profit but a net loss?
Crocs took a large non-cash goodwill and intangibles impairment charge tied to its HEYDUDE acquisition, which depressed reported net income below operating income by roughly $230M. The operating business is profitable. The accounting writedown is not a cash event. Same story at Coty, where brand impairments turned a 4.1% operating margin into a -6.2% net margin.
how should i think about my private 7-8 figure brand vs these public benchmarks?
Two reads. First, the public median gross margin (56.6%) is roughly the same as the median for private 8-figure DTC brands per the Finaloop dataset (~56%). You are likely in the same category envelope. Second, top-quartile private brands clear net margins approaching 20%, which beats Lululemon (14.2%). So do not benchmark against the public leader. Benchmark against the top private quartile.
is lululemon the right benchmark for my apparel brand?
Not really. Lululemon has 30 years of brand equity, vertical retail, and a category position no other apparel brand holds. Even Lululemon gave back 260 basis points of gross margin in FY2025. Treat the 19.9% operating margin as a ceiling, not a target, and benchmark your own apparel brand against the 50%-to-57% gross-margin envelope where Warby, Allbirds, and Crocs sit.
what's the gross margin floor i need to be a profitable dtc brand?
Roughly 50% on goods with significant CAC. Below that, marketing and fulfillment eat the operating line. Chewy (29.8% GM, 2.0% OM) and Acushnet (47.7% GM, 11.7% OM) are the exceptions, and both rely on tight SG&A discipline. If you are sub-50% gross and your operating margin is also thin, your problem is gross margin first and SG&A second.
how often does this leaderboard update?
Quarterly, after each earnings cycle. The full-year refresh lands in late February or March after the bulk of 10-Ks file; we update the dataset and bump dateModified each quarter for 10-Q margin trends. Next planned update: early August 2026 after Q2 10-Q filings.