
Insights
Warby Parker financials: a CFO-grade DTC teardown
Warby Parker turned its first full-year GAAP profit in 2025 ($1.6M on $871.9M revenue), but not from gross margin, which actually fell to 54.0%. The driver was overhead spread: SG&A dropped from 59.2% to 54.6% of revenue. Cost discipline, not margin, flipped the company.
Key Takeaways
- Fiscal 2025 was Warby Parker's first full year of positive GAAP net income: $1.6M on $871.9M of revenue, a $22.0M swing from the -$20.4M net loss in 2024, after burning through more than $450M of cumulative operating losses since 2019.
- The profit did not come from gross margin. Gross margin actually fell 130bps to 54.0% on tariffs, in-store doctor headcount, and contact-lens mix. The COGS line got worse, not better.
- The driver was overhead spread: SG&A dropped from 59.2% of revenue to 54.6%. That roughly 450bps of overhead spread more than offset the gross-margin headwind and carried the operating loss from -$30.1M to -$5.3M. Overhead, not margin, is what flipped the company.
- The 'DTC' brand now runs 323 stores and spends $67M a year on capex. The online store is only about $331M, roughly 38% of revenue. Physical retail is the CAC strategy, and it is capital-intensive.
- Cash is real, not just adjusted: $110.8M operating cash flow, $43.7M free cash flow, $286.4M cash, zero long-term debt, and a fresh $100M buyback. The earnings quality holds up to a diligence read.
In February 2026, Warby Parker (NYSE: WRBY) printed the number every venture-backed direct-to-consumer (DTC) brand has been chasing for a decade: its first full year of positive GAAP net income, $1.6M on $871.9M of revenue, after burning through more than $450M of cumulative operating losses since 2019. The interesting question for an operator is not "did Warby get profitable." It's how. Because the path did not run through the line most founders obsess over. This is a CFO-grade teardown of the 10-K, read the way we would diligence it before a board meeting.
For another DTC teardown, see our Crocs teardown.
"First profitable year": what the 10-K actually says
Start with the headline, because it reframes everything that follows. Fiscal 2025 net income was $1.6M, a $22.0M swing from the -$20.4M net loss in 2024. That is the first full year Warby Parker has ever finished in the black on a GAAP basis. Revenue grew 13.0% to $871.9M, roughly the same mid-teens rate it has posted for years. There was no revenue heroics, no breakout quarter. The top line did exactly what it had been doing.
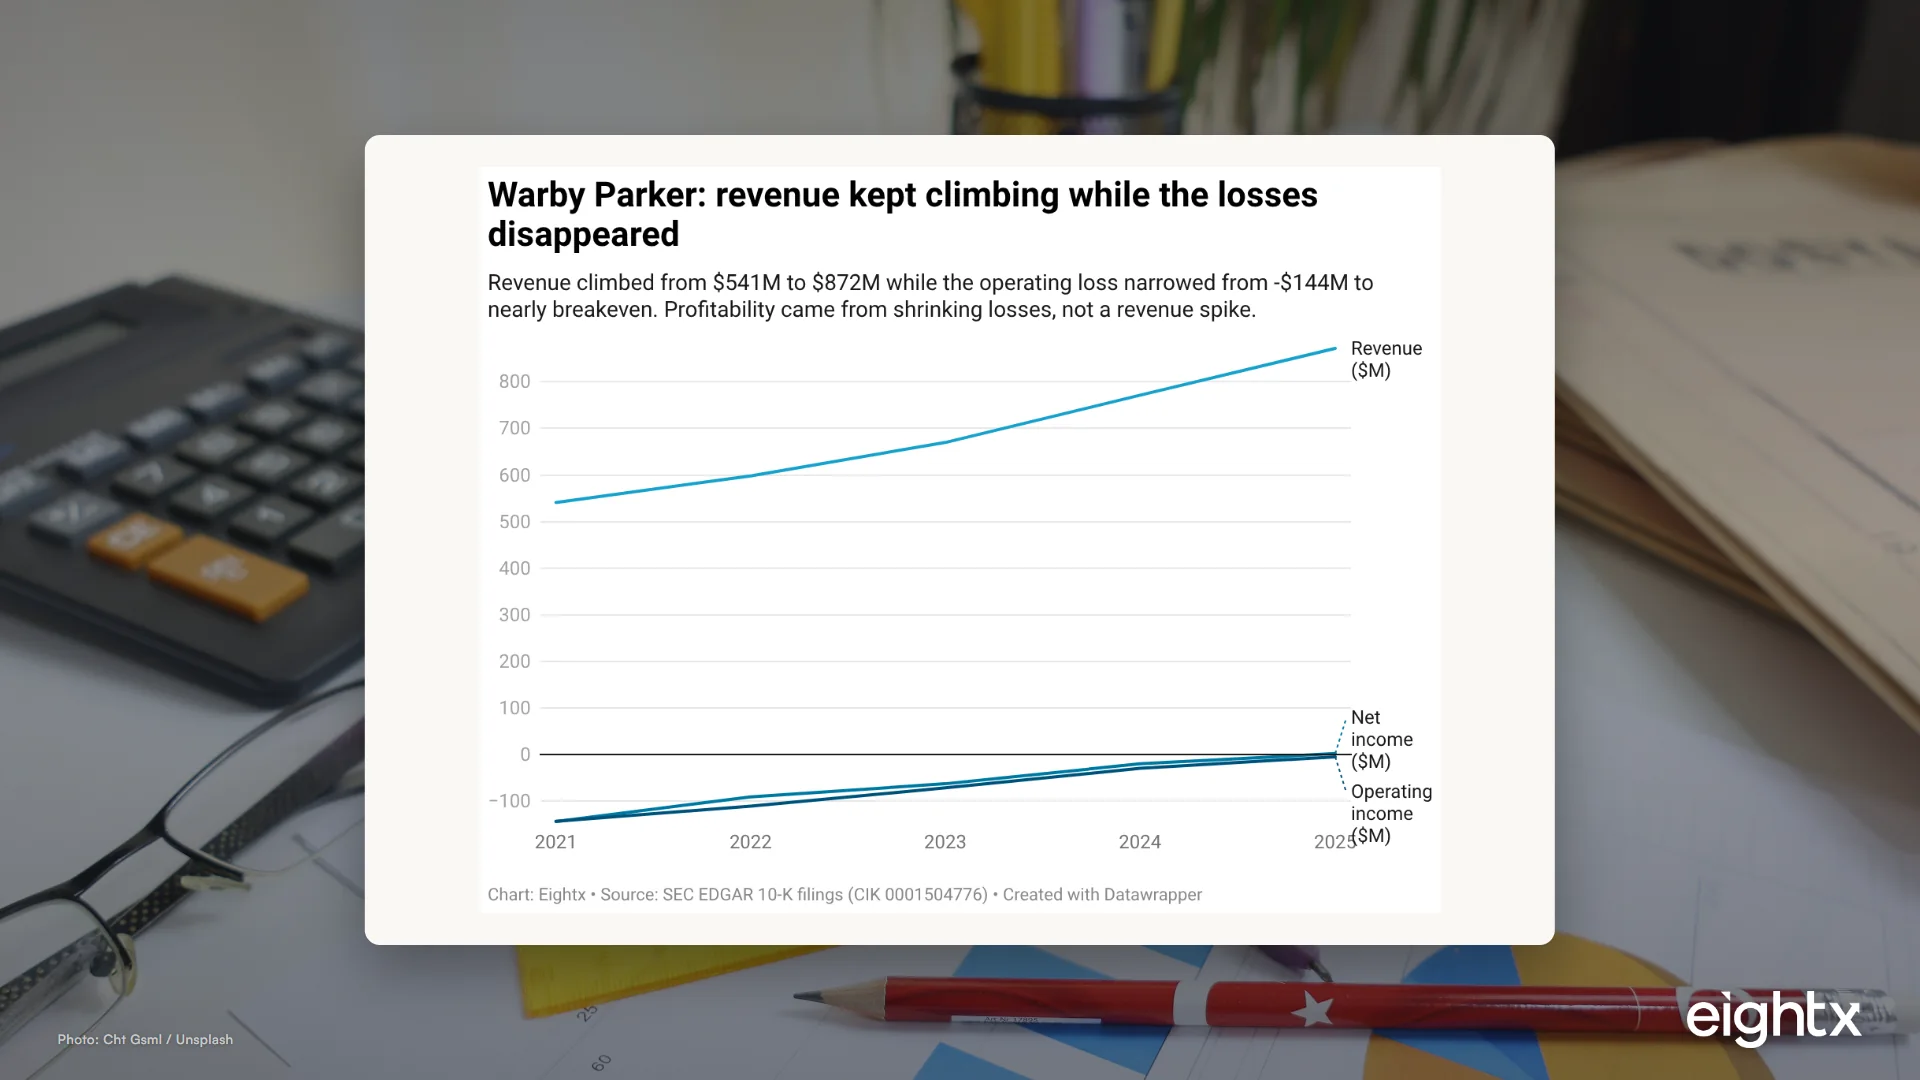
What changed sat lower in the P&L. The operating loss narrowed from -$143.7M in 2021 to -$30.1M in 2024 to just -$5.3M in 2025, and net income crossed zero. When you plot it, the story is not a revenue rocket. It is a loss that shrank to nothing while revenue compounded steadily underneath it.
When I talk to founders running a brand somewhere in the $10M to $50M range, the instinct is almost always to look for the one heroic quarter that fixes the business. Warby's filing is a useful counterweight. Five years of unspectacular 13% growth, paired with disciplined cost behavior, did the work that no single blowout year ever does. The flip to profit is the least dramatic line on the chart, and that is exactly the point.
The profit did not come from gross margin (and that's the lesson)
Here is the part that trips people up. Gross margin in 2025 was 54.0%, down 130 basis points from 55.3% in 2024. The company attributes the decline to tariffs on imported glasses, higher in-store optometrist (eye-exam) headcount, a mix shift toward lower-margin contact lenses, and higher shipping costs, only partly offset by selective price increases. In plain terms, the cost of goods line got worse in the year the company turned profitable.
That should stop you. The reflex for most operators chasing profitability is to attack COGS: renegotiate the supplier, raise prices, kill the low-margin SKUs. Warby did the opposite of improving here and still crossed into profit. The gross-margin line was not the lever.
When we have sat with founders who are convinced their path to profit runs through a two-point gross-margin improvement, the uncomfortable math is usually this: on a brand doing $20M, two points of gross margin is $400K. Real money, but rarely the thing standing between you and breakeven. The thing standing between you and breakeven is almost always sitting in the overhead block below the gross-profit line, and that is where Warby's story actually lives.
Spreading overhead is the real engine: the SG&A line
SG&A (selling, general and administrative expense) fell from 59.2% of revenue in 2024 to 54.6% in 2025. On an adjusted basis it dropped from 52.5% to 49.7%. That roughly 450 basis points of overhead spread, on $872M of revenue, is the entire profitability story. Spread the lens back to 2021 and the move is even starker: SG&A ran at 85.3% of revenue then. Gross margin barely budged across the same window. One line did all the work.
The mechanism is operating-cost dilution. A large share of Warby's overhead, corporate staff, brand marketing, technology, customer-experience infrastructure, is relatively fixed. When revenue grows 13% a year and you hold that base roughly flat, the overhead percentage falls automatically. The company did not slash its way to profit. It grew into a cost base it had already built, and it had the discipline to stop adding to that base as fast as revenue arrived.
The pattern we see again and again with operators who finally turn the corner is exactly this: they stop trying to buy the next dollar of growth and let the growth they already have compound against a steady overhead line. The founders who stay stuck are usually the ones who add a head, a tool, or an agency retainer every time revenue ticks up, so the SG&A percentage never falls and breakeven never arrives. Warby's 450 basis points of overhead spread is what that discipline looks like at scale.
Know the most you can pay to acquire a customer.
Get our Max CAC calculator: set your unit economics, get your ceiling.
Check your inbox. We'll send the Maximum CAC calculator shortly.
The "DTC" brand that runs 323 stores
Now the contrarian read a CFO would flag in diligence. Warby Parker is shelved in everyone's mind as the original DTC eyewear brand. In 2025 it opened 47 net new stores to reach 323 locations, spent $67.0M on capex (about 7.7% of revenue, almost entirely store buildouts), and its online store generated only about $331M, roughly 38% of total revenue. The majority of this "direct-to-consumer" company's revenue now comes through physical retail.
The stores are not a vanity play. They are the customer-acquisition strategy. As paid digital acquisition got more expensive across the whole DTC sector, Warby leaned into physical retail to lower its blended acquisition cost. A store is a high-fixed-cost, high-intent acquisition channel: expensive to build, but it converts foot traffic into customers without paying Meta or Google for every click. That is the trade behind the $67M of capex.
| Fiscal year | Stores (end of year) | Net new stores | Capex ($M) | Capex as % of revenue |
|---|---|---|---|---|
| 2025 | 323 | +47 | 67.0 | 7.7% |
| 2024 | 276 | +39 | 64.0 | 8.3% |
| 2023 | 237 | +37 | 53.7 | 8.0% |
| 2022 | 200 | +39 | 60.2 | 10.1% |
| 2021 | 161 | n/a | 48.5 | 9.0% |
For an operator, the read is a warning as much as a model. If your version of "DTC" quietly depends on opening physical locations, you are no longer running an asset-light ecommerce business. You are running a retailer, and retail comes with leases, buildout capex, and a much heavier balance sheet. Whether that is right for you is a real decision, not a default.
Cash, customers, and the quality of earnings
A skeptical diligence read always asks the same question of a freshly profitable company: is this real, or is it an accounting flattering? Warby holds up. Operating cash flow was $110.8M and free cash flow $43.7M in 2025, the third straight year both were positive. The company ended the year with $286.4M of cash, zero long-term debt, and a 2.5x current ratio, then the board authorized a $100M share buyback. You do not announce a buyback from a position of cash weakness. The earnings quality is sound.
The customer economics back it up. Active customers grew 7.0% year over year, and average revenue per customer reached $324, up 5.7%. Both the number of customers and the spend per customer rose at the same time, which is the healthy version of growth. Q1 2026 carried the trend forward: $242.4M of revenue (+8.3%), $3.2M of net income, $29.6M of Adjusted EBITDA at a 12.2% margin, and 2.69M active customers across 337 stores.
| Fiscal year | Revenue ($M) | Gross margin | Operating income ($M) | Net income ($M) | Adj. EBITDA ($M) | Op. cash flow ($M) |
|---|---|---|---|---|---|---|
| 2025 | 871.9 | 54.0% | -5.3 | 1.6 | 95.2 | 110.8 |
| 2024 | 771.3 | 55.3% | -30.1 | -20.4 | 73.1 | 98.7 |
| 2023 | 669.8 | 54.5% | -72.0 | -63.2 | n/a | 61.0 |
| 2022 | 598.1 | 57.0% | -111.2 | -91.3 | n/a | 10.4 |
| 2021 | 540.8 | 58.8% | -143.7 | -144.3 | n/a | -32.0 |
Warby Parker's first profitable year is a teardown lesson in the wrong place to look. Gross margin fell. Revenue grew at its usual mid-teens pace. What flipped the company was 450 basis points of SG&A spread, the discipline to grow into a fixed overhead base instead of out-spending it. The path to profitability is almost never the margin line. It is the overhead line.
What a $10-50M operator should actually take from this
The temptation with a teardown like this is to copy the visible thing: open stores, sell eyewear, run a slick brand. That is the wrong layer. The transferable lesson sits in the sequencing of the P&L. Compare Warby to Allbirds, the cleanest public DTC comp, and the divergence is stark.
| Metric (FY2025) | Warby Parker (WRBY) | Allbirds (BIRD) |
|---|---|---|
| Revenue ($M) | 871.9 | 152.5 |
| Revenue growth YoY | +13.0% | -19.7% |
| Gross margin | 54.0% | 41.0% |
| Operating margin | -0.6% | -52.5% |
| Operating cash flow ($M) | 110.8 | -55.1 |
| Free cash flow ($M) | 43.7 | -58.2 |
| Cash ($M) | 286.4 | 66.7 |
Both brands had a respectable gross margin at some point. Only one paired steady growth with overhead discipline. Allbirds is what happens when revenue shrinks against a cost base that did not come down fast enough; Warby is what happens when revenue compounds against a cost base held flat. The deciding line in both cases is overhead, not the product.
So the operator decision framework comes down to three questions, in order. First: is your gross margin in a defensible range for your category? If yes, stop fiddling with it. Second: is your SG&A as a percentage of revenue falling as you grow, or are you adding cost every time revenue ticks up? That is the line that decides profitability. Third: if your growth depends on a capital-intensive channel like retail, have you actually priced the capex and the balance-sheet weight that comes with it? Warby guided to $959-976M of revenue and $117-119M of Adjusted EBITDA for 2026 on about 50 new stores. The flywheel works, but only because the overhead discipline came first. That is the part worth copying.
Sources and methodology
The financial figures in this teardown come primarily from Warby Parker Inc.'s SEC EDGAR filings under CIK 0001504776 (ticker WRBY, NYSE), pulled via the SEC EDGAR financial-statements and valuation-metrics tools. The company is classified under SIC 3851 (Ophthalmic Goods), files on a December 31 fiscal year, and is a large accelerated filer incorporated in Delaware under the former name JAND Inc.
Income-statement, balance-sheet, and cash-flow line items for fiscal years 2021 through 2025 were taken from the annual filings, with quarterly detail through Q1 2026 from the most recent 10-Q (filed 2026-05-07). Key XBRL tags used include Revenue, GrossProfit, OperatingIncomeLoss, SellingGeneralAndAdministrativeExpense, NetIncomeLoss, NetCashProvidedByUsedInOperatingActivities, capital expenditures, and cash. FY2025 net income was confirmed at $1.6M from the NetIncomeLoss series; a stale valuation-metrics net-income field reflecting a prior-period value was set aside in favor of the filed figure.
Press-release-level detail not broken out in XBRL, including the 54.0% versus 55.3% gross-margin bridge, Adjusted EBITDA of $95.2M (10.9% margin), the SG&A and Adjusted-SG&A percentages, the 47 net-new-store count, average revenue per customer of $324, the $100M buyback authorization, and FY2026 guidance, comes from Warby Parker's Q4 and full-year 2025 results press release (BusinessWire, 2026-02-26) and was triangulated against secondary earnings coverage.
Channel and technology context came from a Storeleads lookup of warbyparker.com, which runs on a custom (non-Shopify) platform with Cloudflare, Affirm, Narvar, Gladly, and Bazaarvoice in the stack, consistent with an omnichannel public company. Storeleads sales estimates are modeled proxies and were not used; all revenue figures are from the filings.
The Allbirds comparison uses SEC EDGAR valuation metrics for BIRD for the same FY2025 period. Two limitations are worth flagging. First, standalone marketing and advertising expense is not cleanly disclosed as its own XBRL line; Warby bundles marketing inside SG&A, so the SG&A overhead-spread story captures it without isolating a marketing-only figure. Second, store counts for 2021 through 2023 are company-reported figures rather than line-confirmed to each year's 10-K, and the online-versus-retail revenue split is disclosed qualitatively (online about $331M) rather than as a clean two-line channel P&L.
For operators working through their own version of this question, our fractional CFO services page covers how we map a P&L the way this teardown maps Warby's.
Frequently asked questions
is warby parker actually profitable now or is that just adjusted ebitda?
It is genuinely GAAP-profitable, not just adjusted. Fiscal 2025 was its first full year of positive GAAP net income at $1.6M, and it backed that with $110.8M of operating cash flow and $43.7M of free cash flow. Adjusted EBITDA of $95.2M is the metric management steers by, but the cash and the GAAP bottom line both turned positive too.
what is warby parker's gross margin and why did it go down in 2025?
Gross margin was 54.0% in 2025, down 130 basis points from 55.3% in 2024. The company attributes the decline to tariffs on glasses, higher in-store optometrist headcount, a mix shift toward lower-margin contact lenses, and higher shipping costs, only partly offset by selective price increases. The point for operators: profitability arrived despite gross margin falling, not because it rose.
how did warby parker finally become profitable after years of losses?
Spreading fixed overhead across more revenue, on the SG&A line. SG&A fell from 59.2% of revenue in 2024 to 54.6% in 2025, roughly 450 basis points of overhead spread. That, not gross margin and not a revenue spike, is what carried the operating loss from -$30.1M to -$5.3M and pushed net income positive.
is warby parker still a dtc brand if most growth comes from physical stores?
Functionally it is an omnichannel retailer now. It opened 47 net new stores in 2025 to reach 323, spends about $67M a year on capex (mostly store buildouts), and the online store is only around $331M, roughly 38% of revenue. The stores are the customer-acquisition engine. The "direct-to-consumer" label is more brand heritage than channel reality.
how does warby parker's gross margin compare to allbirds and other dtc brands?
Warby Parker's 54.0% gross margin sits well above Allbirds' roughly 41% for FY2025, and the gap on the operating line is far wider: Warby is near breakeven while Allbirds ran a deeply negative operating margin on shrinking revenue. A healthy gross margin matters, but the two brands show it is the overhead line that decides who survives.
what does warby parker's revenue per customer tell me about my own aov?
Average revenue per customer was $324 in 2025, up 5.7% year over year, on active customer growth of 7.0%. The useful read is the combination: both the number of customers and the spend per customer rose at once. If you are growing customers but ARPC is flat or falling, you are buying growth rather than compounding it, which is the trap Warby spent a decade climbing out of.
what is warby parker's free cash flow and does it have any debt?
Free cash flow was $43.7M in 2025 on $110.8M of operating cash flow, the third straight year of positive operating and free cash flow. The company ended the year with $286.4M of cash, no long-term debt, and a 2.5x current ratio, then authorized a $100M share buyback. The balance sheet is clean.
what can a $10m to $50m dtc brand actually copy from warby parker's path to profit?
Not the eyewear, and not the stores. The transferable lesson is the sequencing: hold gross margin roughly steady, stop trying to out-spend your way to growth, and let revenue compound into a fixed overhead base until the SG&A percentage falls. Most operators chase the margin line because it feels controllable. Warby got profitable by disciplining the overhead line instead.