
Financial Strategy
What is dead stock carrying cost? The 20-30% annual drag hiding in your warehouse
Dead stock carrying cost runs 20% to 30% of inventory value per year for a typical DTC brand, covering five components: warehouse rent, cost of capital, obsolescence risk, insurance and property taxes, and shrinkage. A SKU sitting at $50,000 of cost for 12 months without selling generates $10,000 to $15,000 in carrying drag before any write-down, and the post defines 180 days on-hand as the at-risk threshold and 365 days as the dead-stock threshold for ecommerce operators.
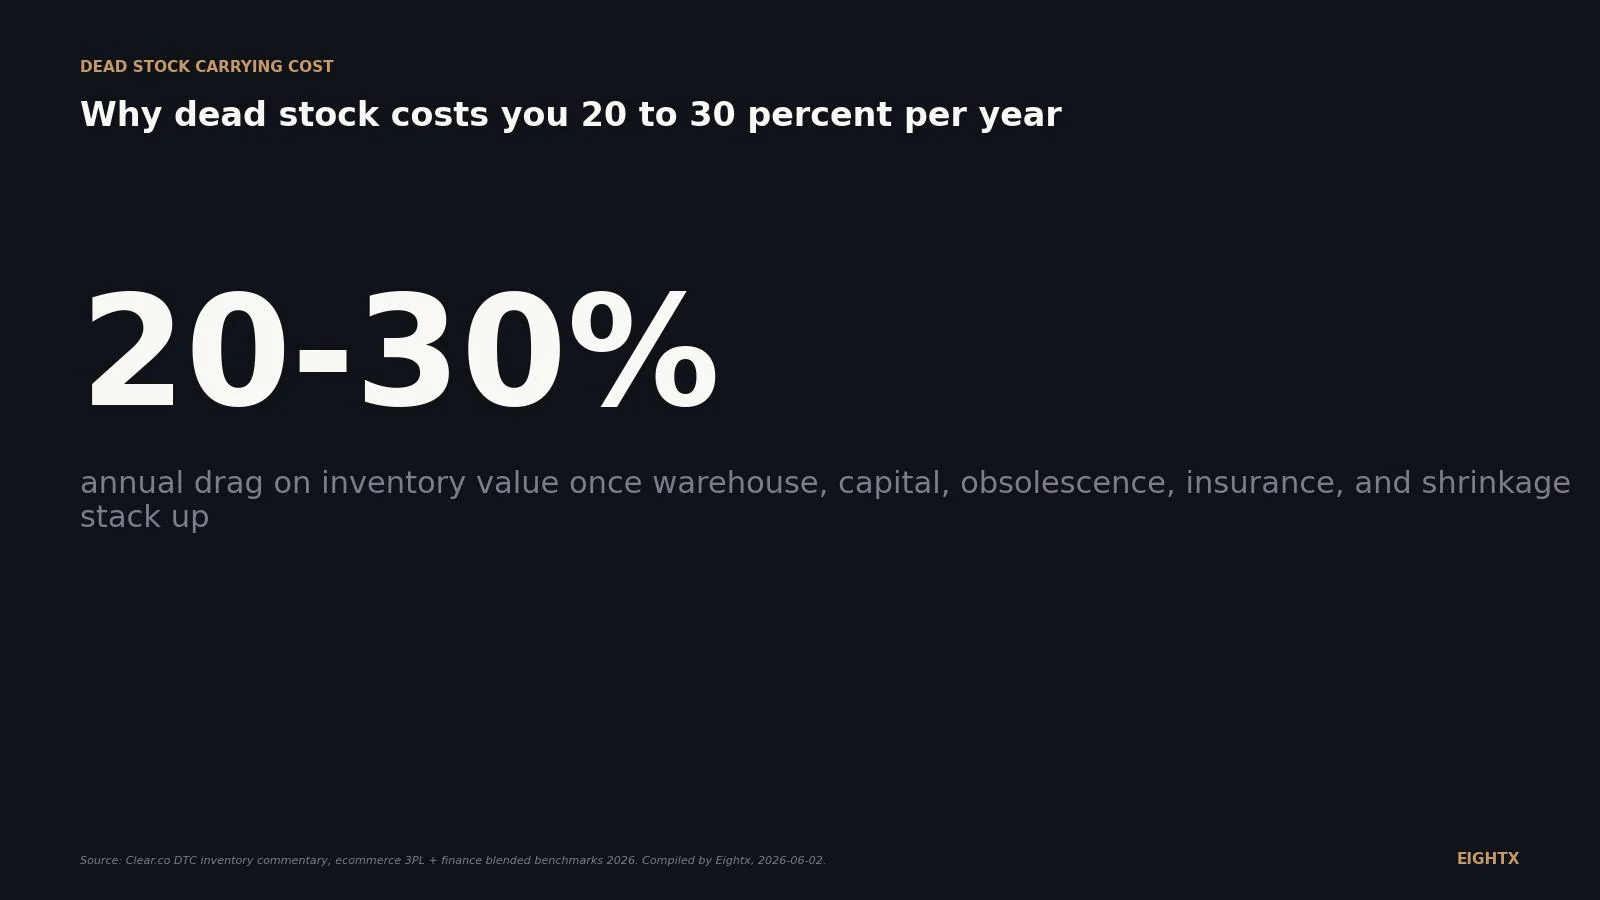
Dead stock carrying cost is the recurring, annualized drag a brand pays to keep SKUs (Stock Keeping Units) that are not selling. It is not the same as the original Cost of Goods Sold (COGS), and it is not just frozen capital. It stacks five components (warehouse, cost of capital, obsolescence, insurance and taxes, shrinkage) into a blended 20 to 30 percent of inventory value per year for a typical DTC brand. That means $100,000 of dead inventory quietly costs $20,000 to $30,000 every year before you ever discount it. The total economic drag once you liquidate is often more than 50 percent of the original cost.
For an ecom operator, dead stock is the cash line nobody puts in their P&L and the working-capital hole everyone feels. Healthy DTC brands keep dead and obsolete inventory under 5 percent of on-hand value. The average sits at 10 to 20 percent. Brands that overbought through 2021 to 2023, got hit by tariff swings, or ride long lead times can quietly carry 20 to 30 percent of value as functionally dead. That is the difference between a tight P&L and a tight bank account. The carrying-cost rate also sits inside every working-capital decision you make this quarter: re-order quantities, factor financing, 3PL renewals, and how much margin you can give up to liquidate the SKUs that are not moving.
How it works
Two formulas. The first is the annualized carry drag: Carrying Cost Drag = Dead Stock Value multiplied by Carrying Cost Rate multiplied by Time in Years. The second is total economic drag once you finally sell the cohort at a discount: Total Drag = (Value times Rate times Time) plus (Value minus Liquidation Recovery). Worked example: a $400,000 cohort of dead SKUs sitting at a 25 percent blended carry burns $100,000 every year before any markdown. If you liquidate the same cohort at 50 cents on the dollar after a year, the total drag is $100,000 of carry plus $200,000 of liquidation loss, or $300,000 on a $400,000 starting position. That is a 75 percent negative return. The carrying cost rate itself is the sum of warehouse and storage (8 to 15 percent), cost of capital (6 to 12 percent, slot your Weighted Average Cost of Capital or WACC here if you know it), obsolescence and write-downs (4 to 10 percent), insurance and taxes (1 to 3 percent), and shrinkage (1 to 3 percent). When operators do not have a precise WACC, 25 percent is the clean default for board math. For the operational read on how slow inventory becomes dead inventory, see the days on hand explainer.
Turn dead stock into a 90-day recovery plan.
Get our free Inventory Optimization AI — one Shopify export in, a SKU action plan out.
Check your inbox — we'll send the free Inventory Optimization AI shortly.
Common triggers
- A board meeting where someone asks 'what is the true cost of carrying this inventory?' and the right answer is 20 to 30 percent of value per year, not zero.
- Days on hand (DoH) on a SKU has crossed 180 days against trailing demand. Flag it as at-risk, run the carry math, set a 365-day liquidate-or-write-off trigger.
- Inventory days outstanding has crept up 20 percent or more in two quarters and the buying team has not adjusted re-order quantities. That gap is the carrying-cost rate compounding.
- You are negotiating a 3PL renewal and the storage line is the variable nobody benchmarked. A category-by-category dead-stock review usually buys back enough pallet positions to cover the rate increase.
- A liquidation broker offers 35 to 50 cents on the dollar and the founder hesitates. Run the total economic drag formula. Holding for another year at 25 percent carry usually loses more than the liquidation discount.
- You are stress-testing pricing power for an apparel or seasonal brand. Slow-mover thresholds compress to 90 days at-risk, 180 days dead. The 20 to 30 percent annual rate becomes a 5 to 7 percent monthly rate at that compressed cycle.
The most common mistake
The biggest mistake operators make is treating dead stock as a one-time write-down decision instead of a recurring tax on the brand. They look at the markdown line on the P&L, take the hit, and move on, without ever embedding a carrying-cost rate into the buying and BI dashboards. The fix has three parts. First, default a 20 to 25 percent carrying-cost rate into your BI tool or ERP (Enterprise Resource Planning) as a per-SKU and per-category line item, multiplied against on-hand cost value. Second, set two operator triggers: 180 days with no sales equals at-risk, 365 days with no sales (or DoH greater than 365 against trailing demand) equals dead. Third, run a recurring liquidation cadence so the cohort never sits long enough to compound the carry. Operators who run this discipline keep dead and obsolete under 5 percent of on-hand value. Operators who skip it quietly fund a 20 to 30 percent annual return for their warehouse landlord. Cross-check the working-capital hit against the cash conversion cycle benchmark.
Browse the full ecommerce finance glossary for every metric and money term a DTC operator needs.
Frequently Asked Questions
what counts as dead stock in an ecommerce business?
The operator-practical definition is no units sold in 180 days equals at-risk, no sales in 365 days (or days on hand greater than 365 versus trailing demand) equals dead. Fast-fashion compresses the at-risk threshold to 90 days. The accounting definition is narrower (obsolete inventory that has been formally written down under lower of cost or net realizable value, LCNRV), but operators should flag and act long before the accountants do.
what carrying cost rate should i use if i do not know my wacc?
25 percent is the clean default for DTC board math. The 20 to 30 percent blended range covers most typical operators, with the lower end for very lean ops and the upper end for highly seasonal or assortment-heavy brands. If you have a known WACC, slot it directly into the cost-of-capital bucket and keep the other four components at observed rates. Venture-backed brands with double-digit hurdle rates skew to the top of the range or above.
is it cheaper to liquidate dead stock or keep holding it?
Almost always cheaper to liquidate. Run the total drag formula: (Value times Carry Rate times Time) plus (Value minus Liquidation Recovery). A $100,000 cohort held one more year at 25 percent carry burns $25,000 in carry alone, before any further markdown. If a broker offers 50 cents on the dollar today, you net $50,000 in cash now versus a deteriorating position the math gets worse on every quarter you hold, because obsolescence and write-down risk compound and the recovery rate a broker will offer next year is almost always lower than the one on the table today.
where does dead stock carrying cost show up on the financials?
It hides. Carrying cost is largely an opportunity-cost concept, not a single GAAP (Generally Accepted Accounting Principles) line. Pieces of it land in different P&L buckets: storage in cost of services, insurance in operating expenses, shrinkage in COGS, write-downs and obsolescence in COGS or a separate impairment line under LCNRV. The cost of capital component never shows up on the P&L at all, which is exactly why operators under-account for it. Build a single 'inventory carry' line in your management reporting so the full 20 to 30 percent drag is visible to the founder and the board.
how do tariffs and long lead times push dead stock percentages up?
Two ways. Long lead times force bigger pre-orders to hedge stock-out risk, which mechanically increases the share of inventory that becomes slow or dead if demand softens. Tariff swings (the 2025 to 2026 cycle is a working example) push brands to over-import ahead of duty changes, then leave them holding inventory bought at higher landed cost when demand normalizes. Both effects compress your sell-through window and lift the dead and obsolete share from a healthy under-5 percent into the 20 to 30 percent strained band.