
Insights
What is incrementality testing? A 2026 guide for DTC operators
Incrementality testing measures the conversions your ad spend actually caused (incremental ROAS) versus what the platform attributed to itself. Meta and Google routinely over-attribute by 20 to 60 percent, so a campaign showing 3x ROAS on-platform may deliver 1.5x incrementally. The 2026 guide covers geo-holdout and ghost-bidding test designs any DTC operator can run without a data science team.
Key Takeaways
- Incrementality testing measures the conversions your ad spend caused. It is a controlled experiment (geo split, ghost bids, or PSA holdout) that compares treated markets or users against a holdout to estimate the lift you would NOT have gotten without the spend.
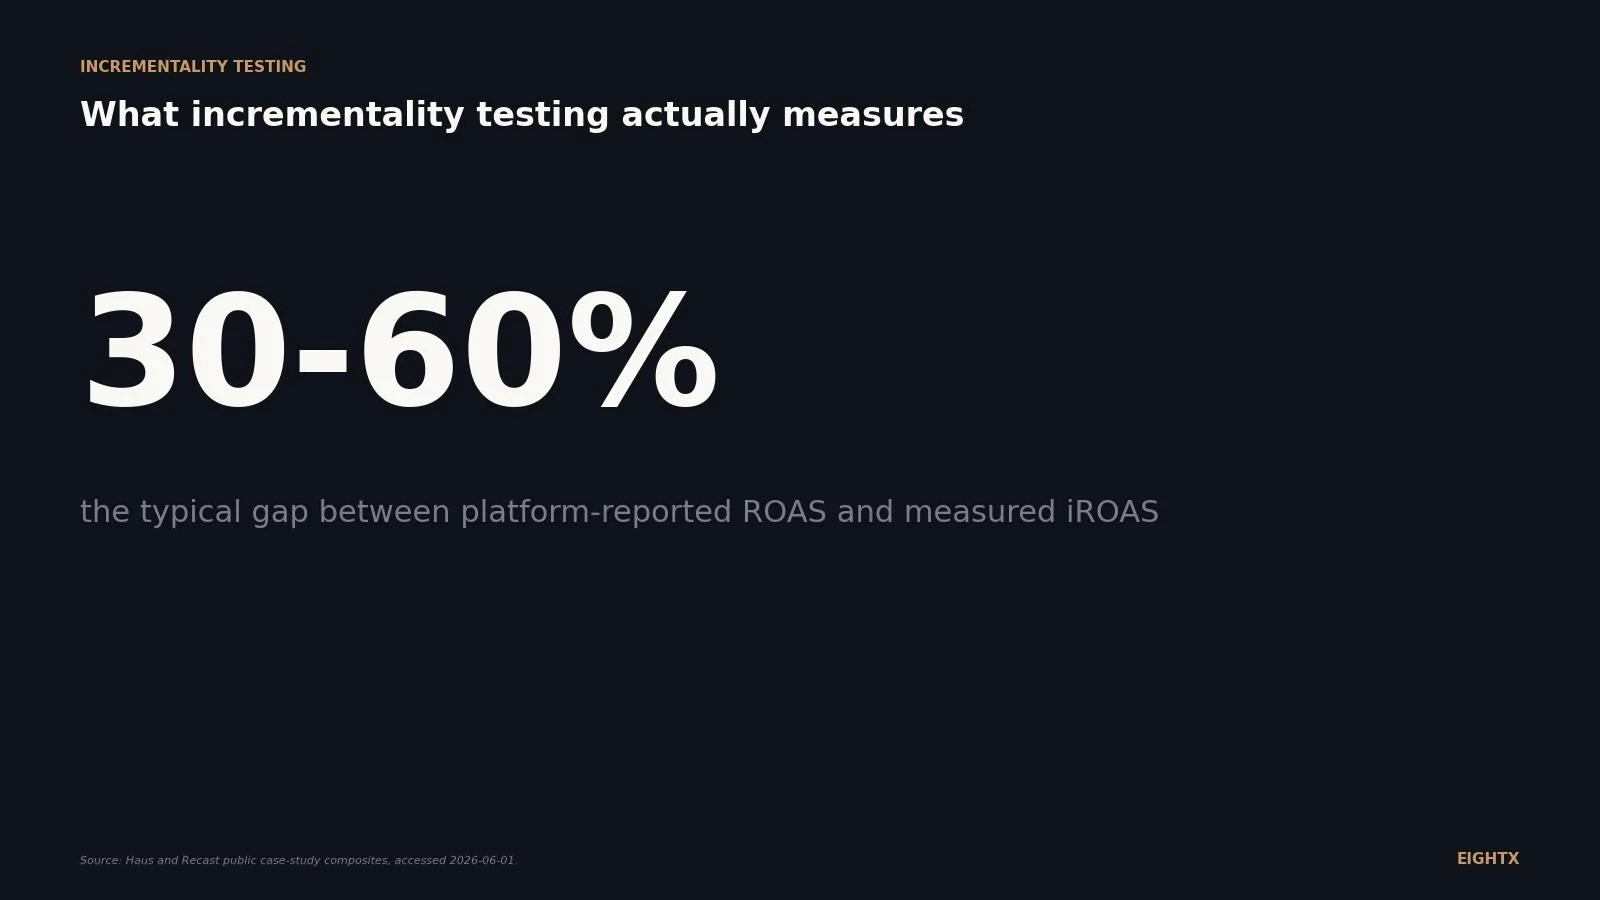
- Measured iROAS is typically 30 to 60 percent below platform-reported ROAS. Haus public case studies (Bombas, True Classic, Liquid Death) cite a 1.5-3x overstatement range, widest on brand search and retargeting where the customer was going to convert anyway.
- Three test designs dominate in 2026. Geo holdouts (any channel, post-iOS 14.5 friendly), in-platform Conversion Lift (Meta and Google ghost bids), and synthetic control via Meta's GeoLift R package or Google's CausalImpact.
- Adoption is a budget problem, not a methods problem. Adoption climbs from the single digits at sub-$5M revenue, where the holdout cost outweighs the decision value, to the majority of brands above $150M where always-on geo testing is standard.
- One test is not a program. Recast recommends a rolling program of 6-12 tests per year; Haus runs continuous always-on geo testing. Standalone tests age out in roughly 90 days as creative, seasonality, and competitor spend move.
If you spend more than $100,000 a month on paid acquisition, your dashboards are likely overcounting your wins on at least some of your channels. Haus public case studies (Bombas, True Classic, Liquid Death) put the gap between platform-reported ROAS and measured iROAS at 1.5x to 3x, widest on placements like brand search and retargeting where the customer was going to convert anyway. Incrementality testing is the experiment that closes that gap, and in 2026 it is the single most important measurement upgrade for DTC brands above $5M in revenue.
What incrementality testing actually measures
Incrementality testing is a controlled experiment that measures the causal lift a marketing channel delivers above what would have happened anyway. You hold out a slice of geography, users, or auctions from seeing the ad. You compare revenue in the treated group against the holdout. The difference is the incremental conversions, and the ratio of incremental revenue to incremental spend is iROAS.
That is a completely different question from attribution. Attribution assigns credit for a conversion to whichever click or view the model decides to credit, even when the customer was already going to buy. Incrementality asks the counterfactual: if you had not run the ad, what would have happened? The answer is almost always less optimistic than the platform dashboard.
Across the public case studies from Haus (Bombas, True Classic, Liquid Death), platform-reported ROAS overstates measured iROAS by roughly 1.5x to 3x. The gap is widest on the placements that look best on the dashboard. Brand search is the canonical example: when someone types your brand name into Google, the search was triggered by your brand recall, not the ad, so they are usually going to find you anyway. Retargeting is the other usual suspect, because the audience was already in-market. Prospecting and non-brand search tend to sit closer to the reported number.
Channel grouping Typical overstatement vs measured iROAS Why Brand search Toward the high end of the 1.5-3x range Search triggered by brand recall, not the ad Retargeting (Meta, Google Display) Toward the high end of the 1.5-3x range Audience already in-market and likely to convert Prospecting (Meta, TikTok) Mid range Mixed causal lift depending on creative and audience Non-brand search Lower end of the 1.5-3x range Higher share of genuinely new demand YouTube / upper-funnel video Range varies; needs PSA holdout or Search Lift Brand impact lags in-platform attribution
The three test designs you'll actually use in 2026
Most operators do not need a deep measurement library. Three test designs cover almost every scenario.
Geo holdouts. Pick matched DMA pairs that look alike on revenue, customer profile, and historical seasonality. Run your ads in the treatment group only for 4 to 8 weeks. Compare revenue trajectories. This is the post-iOS 14.5 default because it works for any channel (Meta, Google, TikTok, podcast, OOH) and does not depend on user-level data the platforms can no longer share. Meta open-sourced GeoLift in 2022 and still maintains it in 2026. Google publishes CausalImpact, a Bayesian structural time series library that is the academic foundation most vendors build on.
In-platform Conversion Lift (ghost bids). Meta and Google both offer randomized user-level holdouts inside their own auctions. Meta's Conversion Lift serves a ghost bid (Meta wins the impression but shows the holdout user a different advertiser's ad). Google's Conversion Lift uses user-list holdouts for YouTube and Display. The advantage is precision. The disadvantage is scale: Google's threshold is roughly $50,000 a month on the tested channel, and Meta needs enough conversions to hit a 5-10 percent minimum detectable effect over 4-8 weeks.
Synthetic control. When you cannot get clean matched DMAs (because your business is too concentrated, or because you only sell in 6 states), GeoLift and CausalImpact both build a synthetic counterfactual from a weighted blend of untreated markets. The math is more involved, but the principle is the same: estimate what would have happened without the spend, then measure the gap.
The PSA holdout (running a public-service-announcement creative to a control group instead of your real ad) is a fourth option, mostly used for upper-funnel video and brand campaigns. It is more expensive than ghost bids because you actually pay for the PSA impressions.
Why adoption stops below $5M revenue
The barrier to running incrementality tests is rarely the methodology. It is the cost of the holdout itself, plus the analyst-grade R fluency that GeoLift and CausalImpact actually require. When you turn off ads in 30 percent of your markets for 6 weeks, you lose ad-driven revenue in those markets for that window. At $1M revenue that is real grocery money. At $50M revenue it is a rounding error against the budget reallocation the test enables. That said, the read you get back tells you whether the channel was overstating in the first place, so if the test shows iROAS materially below ROAS the foregone revenue is recovered (and then some) by reallocating spend.
The pattern we see at Eightx across founder CFO calls maps to the public vendor commentary: adoption is in the single digits at sub-$5M revenue (cost outweighs the read), climbs through the $5-50M band as brands run their first channel tests and the budget can absorb a 5-10 percent holdout for 4-8 weeks, and becomes the standard above $150M where always-on geo testing feeds MMM calibration. The exact share at each tier varies by survey; the directional shape is consistent across Haus, Recast, and Northbeam public commentary.
Revenue tier Adoption pattern Why Under $5M Rare Holdout cost outweighs decision value; R fluency rare in-house $5M to $20M Emerging First channel tests, usually Meta prospecting; vendor cost still material $20M to $50M Common Budget can absorb 5-10% holdout for 4-8 weeks; first vendor engagements $50M to $150M Majority Quarterly read cadence; MMM vendor in place $150M+ Standard Always-on geo testing feeding continuous MMM calibration
The other practical barrier is the test-design tax. Setting up your first geo holdout takes a week of analyst time to build matched pairs and validate the pre-period, and GeoLift / CausalImpact both assume the operator can read R output. Subsequent tests reuse most of that infrastructure, which is why brands that cross the line keep running tests once they start. The first one is the hard one.
What to do this week if you're between $5M and $50M
Three steps to start a real iROAS program without burning a quarter on setup.
Pick your largest paid channel for the first test. That is usually Meta in 2026. If it is over $100,000 a month, the holdout cost is small as a share of total spend and the result will move how you budget across the rest of your mix. Smaller channels are not worth a first test because the precision is poor.
Run a 6-week geo holdout, not a 2-week one. Most first tests fail because the window is too short to clear noise. Use Meta's GeoLift R package if your in-house team has R fluency, or pay a vendor (Haus, INCRMNTAL, or Recast as part of an MMM engagement) if not. Expect to read the result somewhere between weeks 5 and 7, not at week 4.
Replace ROAS with iROAS in your CAC math. Once you have a measured iROAS for your largest channel, swap it into your CAC and LTV-to-CAC calculations. If Meta retargeting iROAS comes in 60 percent below the platform-reported number, your true CAC on that line item is roughly 2.5 times what the dashboard shows. Decide whether you would still scale that channel knowing the real number. That is the budget reallocation the test exists for.
Platform-reported ROAS is a marketing number. iROAS is a finance number. The first one tells you what the platform did. The second one tells you what your business got. Once you've seen the gap on a channel you used to scale aggressively, you cannot unsee it.
What we're watching next
The 2026 measurement story has two open threads. First, Meta's GeoLift package and Google's CausalImpact are both due for major releases in H2 2026 that promise faster reads on shorter test windows. If those land, the test-design tax drops and adoption should move into the $5-20M tier faster than it has in the last two years.
Second, the always-on geo test model (Haus pioneered it, Recast and the bigger MMM vendors are catching up) is starting to merge with weekly MMM updates. The end state is a single iROAS number per channel updated weekly, calibrated by a rolling holdout program. We are not there yet for sub-$50M brands but expect that to be the default within 18 months.
For more on how this changes your monthly close, see our interim CFO services overview and our fractional CFO guide for what to look for in a CFO who can actually read an iROAS report.
Sources and methodology
Perplexity 2026 consensus research. The definition of incrementality testing and the three dominant test designs (geo holdout, ghost bids, synthetic control) were triangulated against Meta's developer documentation, Google's support documentation, and Brodersen et al.'s CausalImpact paper. iROAS as the output metric is consistent across all vendor methodologies surveyed.
Meta GeoLift R package documentation. Open-source synthetic-control geo experiments library, released by Meta in 2022 and maintained in 2026. We pulled the recommended minimum detectable effect (5-10 percent) and test-window length (4-8 weeks) from the project README and the Meta Business documentation for Conversion Lift.
Google Ads Conversion Lift and Geo Experiments documentation. Google's support documentation specifies the user-list-based holdout approach for YouTube and Display and notes a practical minimum scale of approximately $50,000 a month on the tested channel. The CausalImpact R package is the productized version of the Brodersen et al. Bayesian structural time series methodology.
Haus customer case studies. The platform-reported ROAS versus measured iROAS gap range (1.5x to 3x overstatement) is drawn from public Haus case studies covering Bombas, True Classic, and Liquid Death. We have not converted that range into per-channel point estimates; the underlying case studies do not publish a clean per-channel breakdown.
Recast Bayesian MMM methodology. Recast's public blog posts on incrementality-test-as-prior calibration informed the 6-12 tests per year recommendation and the short-term iROAS versus long-term MMM iROAS distinction.
Adoption pattern. The adoption pattern by DTC revenue tier in this post is a directional read, not a survey output. It is informed by public vendor commentary (Haus, Recast, Northbeam) and the pattern we see across Eightx founder CFO calls. We are not citing a specific sample size or survey because we have not published one of our own and the public surveys we have seen do not provide a clean revenue-tier breakdown we can quote with a defensible n.
Limitations. The 1.5x to 3x overstatement range is drawn from three named Haus case studies (Bombas, True Classic, Liquid Death), not a representative sample. iROAS overstatement varies materially by category, brand age, and seasonality. The range is a directional anchor, not a per-brand prediction. The adoption pattern is directional and not survey-weighted.
Update cadence. This page is refreshed quarterly when new public case studies and survey data land. Next update target: September 2026.
Frequently asked questions
what is incrementality testing in simple terms?
It is a controlled experiment that measures the conversions your ad spend caused, not the conversions the platform claimed. You hold out a slice of geography or users from seeing the ad, then compare them to a treated group. The difference is the incremental lift. Output is iROAS (incremental ROAS), which is what you should actually budget against.
what's the difference between incrementality testing and attribution?
Attribution assigns credit for conversions to clicks or views, even when the customer would have converted anyway. Incrementality testing answers a causal question: would that revenue have happened without the ad? Attribution tells you who to thank. Incrementality tells you who to keep paying.
how is iroas different from roas?
ROAS is platform-reported revenue divided by ad spend, usually claimed by last-click or platform-modelled attribution. iROAS is incremental revenue (the lift over a holdout) divided by incremental spend. Across Haus and Recast public case studies, iROAS comes in 30 to 60 percent below the reported ROAS on the same channel.
do i actually have to run a holdout if i'm a small dtc brand?
Not yet, if you're under 5M revenue. Holdouts cost real revenue during the test (you turn off ads in a market) and you need 4 to 8 weeks of data for a stable read. Under 5M revenue the cost usually outweighs the read. Save it for after you cross 5M and your channel mix gets expensive enough that being wrong by 30 to 60 percent matters.
what's a geo holdout test and how do i run one?
Pick matched DMA pairs (similar revenue, similar customer profile). Run your ads in the treatment group only for 4 to 8 weeks. Compare revenue trajectories. If you can't get clean matched pairs, use Meta's open-source GeoLift R package or Google's CausalImpact, which build a synthetic counterfactual when matched markets aren't clean.
Browse the full ecommerce finance glossary for every metric and money term a DTC operator needs.