
eCommerce
What is inventory shrinkage in ecommerce? The 1.6% COGS leak most DTC brands ignore
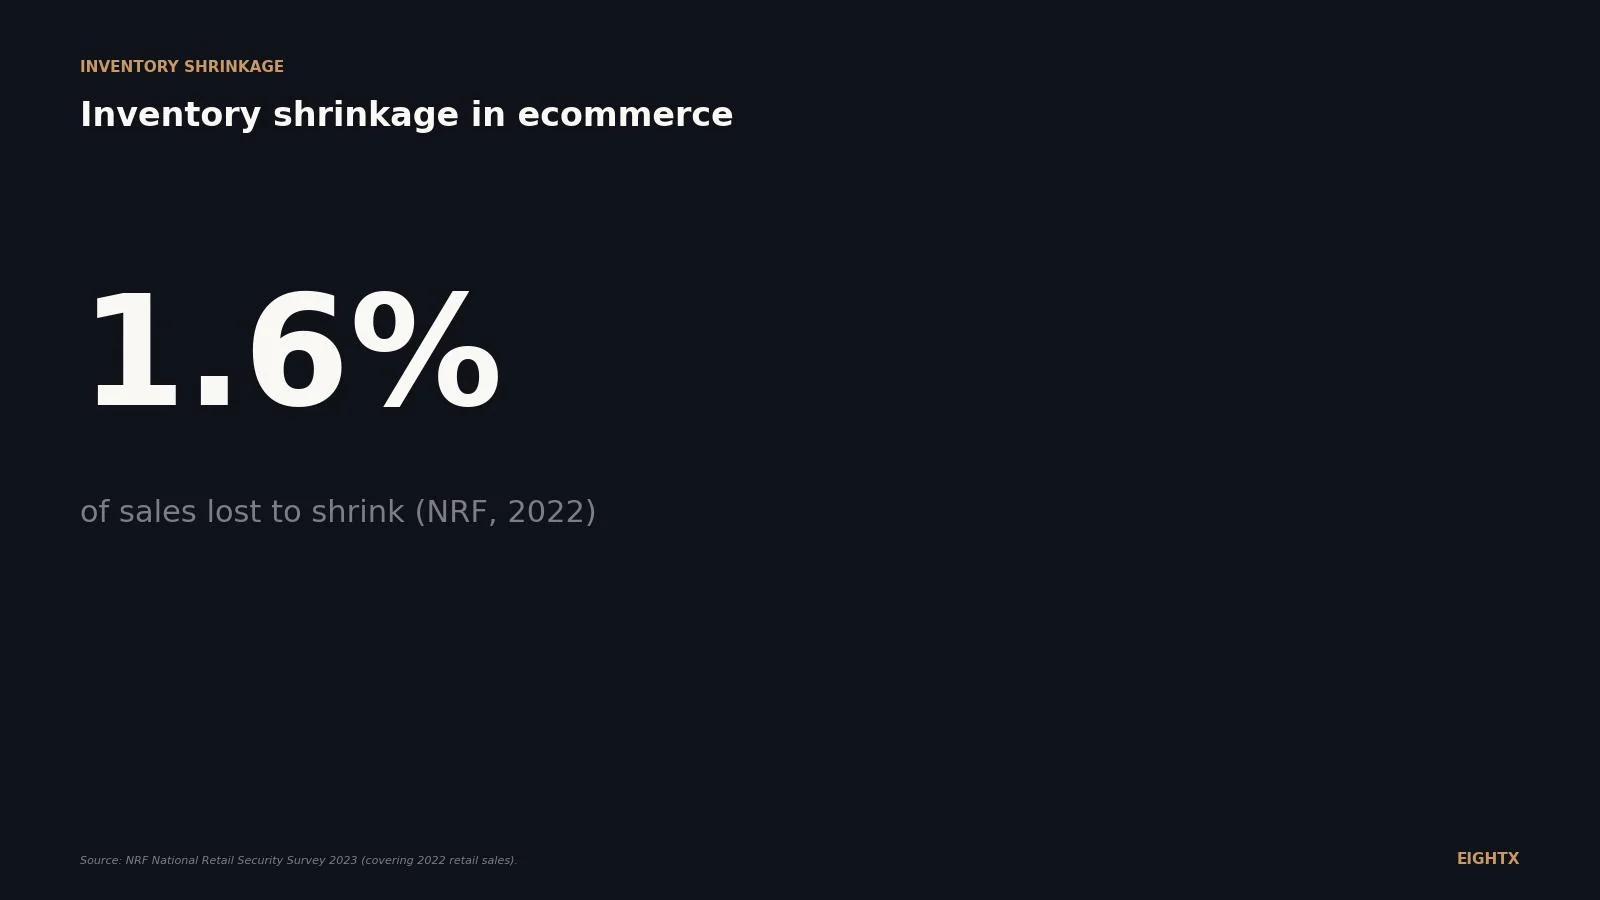
Inventory shrinkage is the gap between book inventory value and the physical count, and the National Retail Federation pegs US retail shrink at 1.6% of sales, meaning a $10M DTC brand loses roughly $160,000 per year before any deliberate write-down. For brands using 3PLs, contractual shrinkage allowances typically run 0.1% to 0.5% of inventory value, and shrinkage above the allowance flows directly to COGS (Cost of Goods Sold), reducing gross margin dollar for dollar.
Key Takeaways
- Inventory shrinkage is the gap between the inventory your books say you own and what you physically count. The NRF's most recent National Retail Security Survey puts US retail shrink at 1.6% of sales, or $112.1B.
- Every missing unit flows straight to COGS (Cost of Goods Sold). At a 40% gross margin, a 2% shrink rate eats 5% of your gross profit. At 60% gross margin it still eats 3.3%.
- For DTC brands the cause mix is different from the NRF average. Storefront theft is a small slice. The big leaks are 3PL receiving errors, putaway and pick mistakes, returns-fraud, and damage in storage.
- Most 3PL contracts allow 0.5% to 1.0% on-hand shrinkage as normal. Above 1.0% in a brand-owned warehouse or above 2.0% at a 3PL is a process failure, not a rounding error.
- The fix is monthly cycle counts plus reason codes at the 3PL. Variance you can't attribute is variance you can't fix, and most $5M to $30M brands don't run either discipline.
Inventory shrinkage is the gap between the inventory your books say you own and what you actually count. For an ecommerce brand that gap shows up in five places: external theft, employee theft, administrative or paperwork errors, supplier fraud, and damage or spoilage. Every missing unit flows straight to COGS, which means shrink compresses your gross margin one for one.
The reason this matters more than most DTC operators think: the National Retail Federation's most recent National Retail Security Survey pegs US retail shrink at 1.6% of sales, or $112.1B in losses. Most $5M to $30M Shopify brands don't track shrink at all, treat the year-end variance as noise, and lose roughly 5% of gross profit to a number that's measurable, attributable, and fixable.
What inventory shrinkage actually is (and where it hides on your P&L)
Inventory shrinkage is the dollar value of inventory you've paid for but no longer have. It's measured at the gap between two numbers: what your inventory system (Shopify, your ERP, your 3PL's WMS) says you own, and what shows up when somebody physically counts the bin.
The NRF reports it as a percentage of total sales because retailers are big and the share of sales framing scales. For a DTC brand that benchmark is useful as a ceiling check, not a target. The 2023 NRF survey (covering 2022 sales) put the headline figure at 1.6% of sales, up from 1.44% in 2021. The dollar value jumped from $93.9B to $112.1B in the same window, partly because shrink rates ticked up and partly because retail sales expanded.
Series source: NRF National Retail Security Survey, headline shrink-rate and dollar-loss figures. 2019-2022 points are taken from the NRF 2023 survey release and the prior NRF press release. The 2015-2018 historicals are commonly reported NRF year-over-year prints and have not been re-confirmed against the original NRF PDFs for this post; treat that portion of the series as directional. Note 2021 dipped to 1.44% (likely pandemic-related retail-mix and reporting effects) before climbing back to 1.6% in 2022.
For an ecommerce-only brand, the 1.6% figure overstates the relevant risk. Most NRF respondents are physical retailers and their headline cause mix is dominated by storefront theft. A pure DTC brand operating out of a 3PL has a different leakage profile: receiving errors, putaway mistakes, picking errors, damage in storage, and returns-fraud are the main drivers. The number that matters is your own variance against your book inventory at month-end.
How to calculate shrinkage rate
Two formulas. Both belong in your monthly close pack.
Shrinkage rate (%) equals (book inventory minus physical count) divided by book inventory, multiplied by 100. This is the unit-agnostic measure: you can compute it at the SKU level, the category level, or the total inventory level.
Dollar shrink equals recorded inventory value minus counted inventory value, at standard cost. This is the number your CFO and your accountant care about because it ties directly to the COGS journal entry.
Run both. A low percentage rate can still mask a meaningful gross-margin hit if the missing units are concentrated in premium SKUs. A worked example for a $10M Shopify brand:
Line Value Book inventory (per Shopify / ERP) $2,000,000 Physical count $1,960,000 Dollar shrink $40,000 Shrink rate (% of inventory) 2.0% Annual COGS $4,000,000 Shrink as % of COGS 1.0% Gross margin before shrink 60.0% Gross margin after shrink 59.6%
The brand above sees a 40 basis point gross margin hit from shrink that landed inside a normal-looking 2% inventory variance. That's $40K of gross profit gone and unattributed, which is what makes shrink so easy to ignore until somebody asks where it went.
The five causes of shrinkage in DTC ecommerce
The NRF cause-mix breakdown is the canonical reference for shrink categories, even if the DTC mix is different. The five buckets:
- External theft. Shoplifting and organized retail crime. For pure-DTC brands this is mostly negligible; for hybrid brands with a retail footprint or pop-up presence it matters more.
- Internal / employee theft. Warehouse staff, fulfillment workers, or returns processors removing inventory. A real risk at scale, smaller for brands using outsourced 3PLs (the 3PL absorbs it).
- Administrative and paperwork errors. Mis-receipts at inbound, putaway in the wrong bin, picking the wrong SKU, mis-keyed counts. This is the biggest DTC bucket.
- Vendor or supplier fraud. Shorted shipments from your contract manufacturer, wrong SKU counts on inbound POs. Catchable with disciplined receiving.
- Damage and spoilage. Units damaged in storage, units damaged in returns processing, expired consumables. Often categorized as shrink because the unit is no longer sellable.
For a Shopify brand running on a 3PL, the real cause mix skews heavily toward admin and pick-pack errors plus damage and returns-leakage, with supplier shorts a meaningful tail and storefront theft a small slice. In the variance reports we see from client brands, admin errors are roughly the largest bucket, damage and returns-leakage next, supplier shorts and pick-and-pack errors comparable, and everything else minor (this is an Eightx estimate from our client variance reports, not a published NRF cut). Directionally, that points the fix toward 3PL SLA language, receiving discipline, and cycle-count cadence rather than security cameras.
How shrinkage hits COGS and gross margin
The math is simple. Every dollar of shrink reduces gross profit by one dollar because the unit is written off through COGS. The relative bite depends on your gross margin.
Formula: percent of gross profit lost = (shrink rate divided by gross margin) times 100.
At 40% gross margin, a 2% shrink rate eats 5% of gross profit. At 60% gross margin the same 2% shrink rate eats 3.3%. The lower your gross margin, the more shrink hurts: a consumables operator at 35% gross margin feels a 2% shrink rate as a 5.7% gross-profit hit. On a $10M brand carrying roughly $2M of inventory, a 2% inventory shrink translates to $40K of dollar shrink and a 5.7% gross-profit hit (about $114K of gross profit lost on $2M of COGS at a 35% margin). Modest at the line-item level, but a quarter to a third of the year's gross profit improvement program, gone unattributed.
Accounting treatment. Under both GAAP (Generally Accepted Accounting Principles) and IFRS, shrinkage is recognized via an inventory write-down. The journal entry is a debit to COGS (or a dedicated Shrinkage Expense / Inventory Loss line if you want it visible on the P&L) and a credit to Inventory for the dollar value of the variance. The carrying value of inventory drops and gross profit falls in the period of the count.
We recommend booking shrink to a dedicated P&L line for any brand above $5M revenue. Burying it inside COGS makes the gross margin look noisy and prevents the operator from seeing whether the leak is getting better or worse over time. A discrete "Inventory Shrinkage" line on the P&L creates the accountability loop.
3PL-driven shrinkage: receiving, picks, returns
If you're on a 3PL, the contract is where your shrink risk gets defined or ignored. Most 3PL master service agreements treat shrinkage in one of three ways: a flat allowance (0.5% to 1.0% of on-hand inventory per quarter), a per-incident liability with a per-unit cap, or no language at all. The third option is the most common and the worst.
Operation type Excellent Healthy Investigate Serious problem Brand-owned warehouse under 0.5% 0.5% to 1.0% above 1.0% above 2.0% 3PL fulfillment under 0.5% 0.5% to 1.0% above 1.0% above 2.0% Consumables / high-spoilage SKUs under 1.0% 1.0% to 1.5% above 1.5% above 2.5%
What to write into your 3PL SLA: a quarterly cycle count requirement, a defined shrinkage threshold (we recommend 1.0% on-hand), 3PL liability for any variance above that threshold valued at your standard cost, mandatory reason codes on every variance line (received-short, picked-wrong, damaged-storage, damaged-return, unknown), and a 30-day cure window before liability kicks in.
If your 3PL renewal is up in 2026, the negotiating power is more on your side than it was 18 months ago. Warehousing labor demand has cooled and 3PLs are operating against a margin squeeze, which makes both the SLA language above and rate concessions easier to win at renewal than mid-contract. We covered the labor backdrop in the DTC layoff and hiring tracker.
Most $5M to $30M Shopify brands lose roughly 5% of gross profit to shrink they never tracked, never attributed, and never wrote into the 3PL contract. The fix isn't fancy. It's a monthly cycle count, a reason-code discipline, and an SLA threshold the 3PL is liable for. Operators who run that loop close the leak inside two quarters.
The CFO monitoring stack for a $5-30M DTC brand
Six things to put in place. None of them are expensive; all of them require somebody to own the cadence.
- Monthly cycle counts on the top 20% of SKUs by revenue. Cover roughly 80% of inventory value every month without committing to a full count.
- Quarterly cycle counts on the long tail. Cheaper SKUs leak too, but the cadence can be slower.
- Annual full physical count. Insurance and accounting still need it; tie it to your year-end close.
- Reason codes on every variance line. Received-short, picked-wrong, damaged-storage, damaged-return, theft-internal, theft-external, unknown. If "unknown" is your biggest bucket after six months, your process is broken, not your inventory.
- SKU-level shrink reporting in your monthly close pack. Show shrink dollars, shrink rate, and reason-code mix to whoever signs off on the close. Trend the last six months.
- Returns disposition tracking. Tag every returned unit with restock, liquidate, or destroy, and reconcile against the inventory adjustment. This is the single biggest source of unattributed shrink in a returns-heavy category.
If you want to map the full cash flow impact (shrink is one of several silent leaks), the cash conversion cycle benchmark walks through the working-capital math.
Sources and methodology
NRF National Retail Security Survey 2023. Headline figures used in this post: 1.6% shrink rate, $112.1B in losses (reflecting 2022 retail sales). Source: National Retail Federation, The Impact of Retail Theft and Violence 2025.
NRF prior-period press release. 1.44% shrink, $93.9B (reflecting 2021 sales). Source: NRF, Retail shrink a nearly $100B problem.
3PL contractual benchmarks. The 0.5% to 1.0% normal range and the 2.0% investigate threshold come from the 3PL contracts we have reviewed for client brands in the $5M to $30M range.
Cause-mix breakdown. The 36% external / 29% internal split is the NRF-cited industry headline summarized in third-party reporting; we have not re-confirmed those exact percentages against the NRF 2023 survey PDF for this post, so treat them as directional. The DTC-specific cause mix in section 3 (admin errors largest, storefront theft smallest) is our Eightx estimate based on the variance reports we see from client brands in the $5M to $30M Shopify cohort, not a published NRF cut. We have stated it directionally in the body for that reason. For category-specific shrink rates (apparel vs. beauty vs. consumables) the NRF 2023 survey PDF is the authoritative source; this post sticks to the cross-category headline.
Time-series caveat. Chart 1 plots NRF shrink-rate and dollar-loss figures from 2015 through 2022. The 2019-2022 points are taken from the NRF 2023 survey release and the prior NRF press release linked above. The 2015-2018 historical points are commonly reported NRF prints carried by third-party summaries; we have not independently re-validated them against the original NRF survey PDFs from those years, so treat the pre-2019 portion of the chart as directional.
Warehousing labor backdrop. The "labor demand has cooled" framing in section 5 is directional, based on BLS Current Employment Statistics warehousing-and-storage payrolls trending down through 2025 and into 2026. We have not pinned an exact month-over-month or year-over-year figure in the body for this post; operators should pull the latest BLS CES warehousing series before relying on that backdrop in a renewal conversation.
Accounting treatment. Standard GAAP and IFRS practice: debit COGS or Shrinkage Expense, credit Inventory, for the dollar value of the variance. Reference: Patriot Software, Inventory shrinkage accounting.
Update cadence. This is a living index. We refresh the NRF figures quarterly when new survey data lands, and update the 3PL benchmark ranges annually when contract terms shift in the market.
Frequently asked questions
what is inventory shrinkage in ecommerce?
Inventory shrinkage is the gap between the inventory your books say you own and what you physically count on the shelf, in the 3PL bin, or in transit. It covers theft, employee error, admin and paperwork mistakes, supplier fraud, and damage. Every missing unit gets booked through COGS, so shrink lands directly on your gross margin.
how do i calculate inventory shrinkage rate?
Shrinkage rate equals (book inventory minus physical count) divided by book inventory, times 100. Dollar shrink equals recorded inventory value minus counted inventory value. Run both: a low unit rate can still hide a big gross-margin hit on premium SKUs.
is inventory shrinkage a cogs or an operating expense?
Under both GAAP and IFRS, inventory shrinkage is recognized as an inventory write-down: you credit Inventory and debit COGS (or a separate Shrinkage Expense line if you want the visibility). It is not an operating expense. The carrying value of inventory drops and gross profit falls in the period of the count.
what's a normal shrinkage rate for a shopify brand?
Below 0.5% is strong for a controlled DTC operation. 0.5% to 1.0% is healthy. Anything above 1.0% in your own warehouse warrants a root-cause investigation. The NRF retail-wide 1.6% benchmark is dominated by brick-and-mortar shoplifting and is not the right target for an online-only brand.
what's a normal shrinkage rate for a 3pl warehouse?
Most 3PL contracts allow 0.5% to 1.0% on-hand inventory shrinkage as normal. Above 2.0% is a process or control failure that you should escalate in writing, and most well-written 3PL SLAs make the 3PL liable for the variance above the contracted threshold.
Browse the full ecommerce finance glossary for every metric and money term a DTC operator needs.