
Financial Strategy
Australia DTC cost of capital 2026: your real hurdle rate
Your real hurdle rate as an Australian DTC brand in 2026 is not the 4.35% RBA cash rate. It is a blend of bank debt near 7.2% and equity that typically demands 25-40%, which lands most $1-30M brands at a hurdle of roughly 18-30%. Anything that cannot clear that after tax destroys capital.
Key Takeaways
- The RBA cash rate is 4.35% as of June 2026, up 75bp from the 3.60% end-2025 trough after three consecutive +25bp hikes (February, March, and May 2026) reversed the Bank's 2025 easing cycle. The RBA's own May 2026 forecasts embed a 4.70% cash rate by end-2026, so debt is repricing up, not down.
- Australian small-business loan rates sit at roughly 7.2% (RBA Lenders' Interest Rates), about 3 points above the cash rate, versus around 6.0% for medium business. That is your real cost of debt, not the headline cash rate.
- A realistic blended hurdle rate for a $1-30M AUD DTC brand is 18-30%. With after-tax debt near 5.4% and equity demanding 25-40%, an all-equity brand's hurdle is around 30%; a 30%-debt structure lands near 22-23%.
- Nominal retail grew just 4.9% YoY to A$37.9bn in June 2025 while CPI ran 4.1%, so real retail growth is roughly flat. The top-line tailwind is gone. Capital efficiency is the lever left.
- Wages are trailing inflation: WPI rose 3.2% YoY in 2026-Q1 vs 4.1% CPI. The consumer's real income is shrinking just as your capital got more expensive. Discipline beats growth-at-any-cost.
The Reserve Bank of Australia (RBA) spent 2025 cutting, then reversed course: three consecutive +25bp hikes in February, March, and May 2026 have lifted the cash rate from its 3.60% end-2025 trough back to 4.35% by June 2026, and the RBA's own May 2026 forecasts pencil in 4.70% by the end of the year. That 4.35% is the number most founders quote when they talk about money getting expensive. But the cash rate is the floor, not your cost of capital. If you run a direct-to-consumer (DTC) brand in Australia, the real number you should be using as a hurdle rate on your next inventory buy or ad-spend decision is closer to 18-30%. This is the gap between what the headlines say money costs and what it actually costs you, and getting it wrong is how brands talk themselves into spends that quietly destroy value.
For how this feeds your financing and hiring calls, see how a fractional CFO puts cost of capital to work.
The cash rate is not your cost of capital
The 4.35% cash rate is the rate at which banks lend to each other overnight. You are not a bank. So when you take that number and use it to justify a spend, you are pricing your capital at a rate you will never actually pay.
Your money comes from two places. The first is debt: a bank or lender hands you cash and charges interest priced off the cash rate plus a margin for your risk. The second is equity: you, or investors, put capital in and expect a return for taking the risk of backing a single consumer brand that could go to zero. Both cost far more than 4.35%, and the blend of the two is your weighted average cost of capital, or WACC. That blended number is the real hurdle rate every dollar of spend has to clear.
When I talk to founders running a brand at this size, the cash rate is almost always the figure they anchor on. They will say "rates are 4.35%, so money is still pretty cheap" and then sign off on an inventory order or a paid-social budget on that basis. The problem is that none of their capital is priced at 4.35%. The cheapest dollar in the business costs more than that, and the most expensive one (equity) costs six to nine times that.
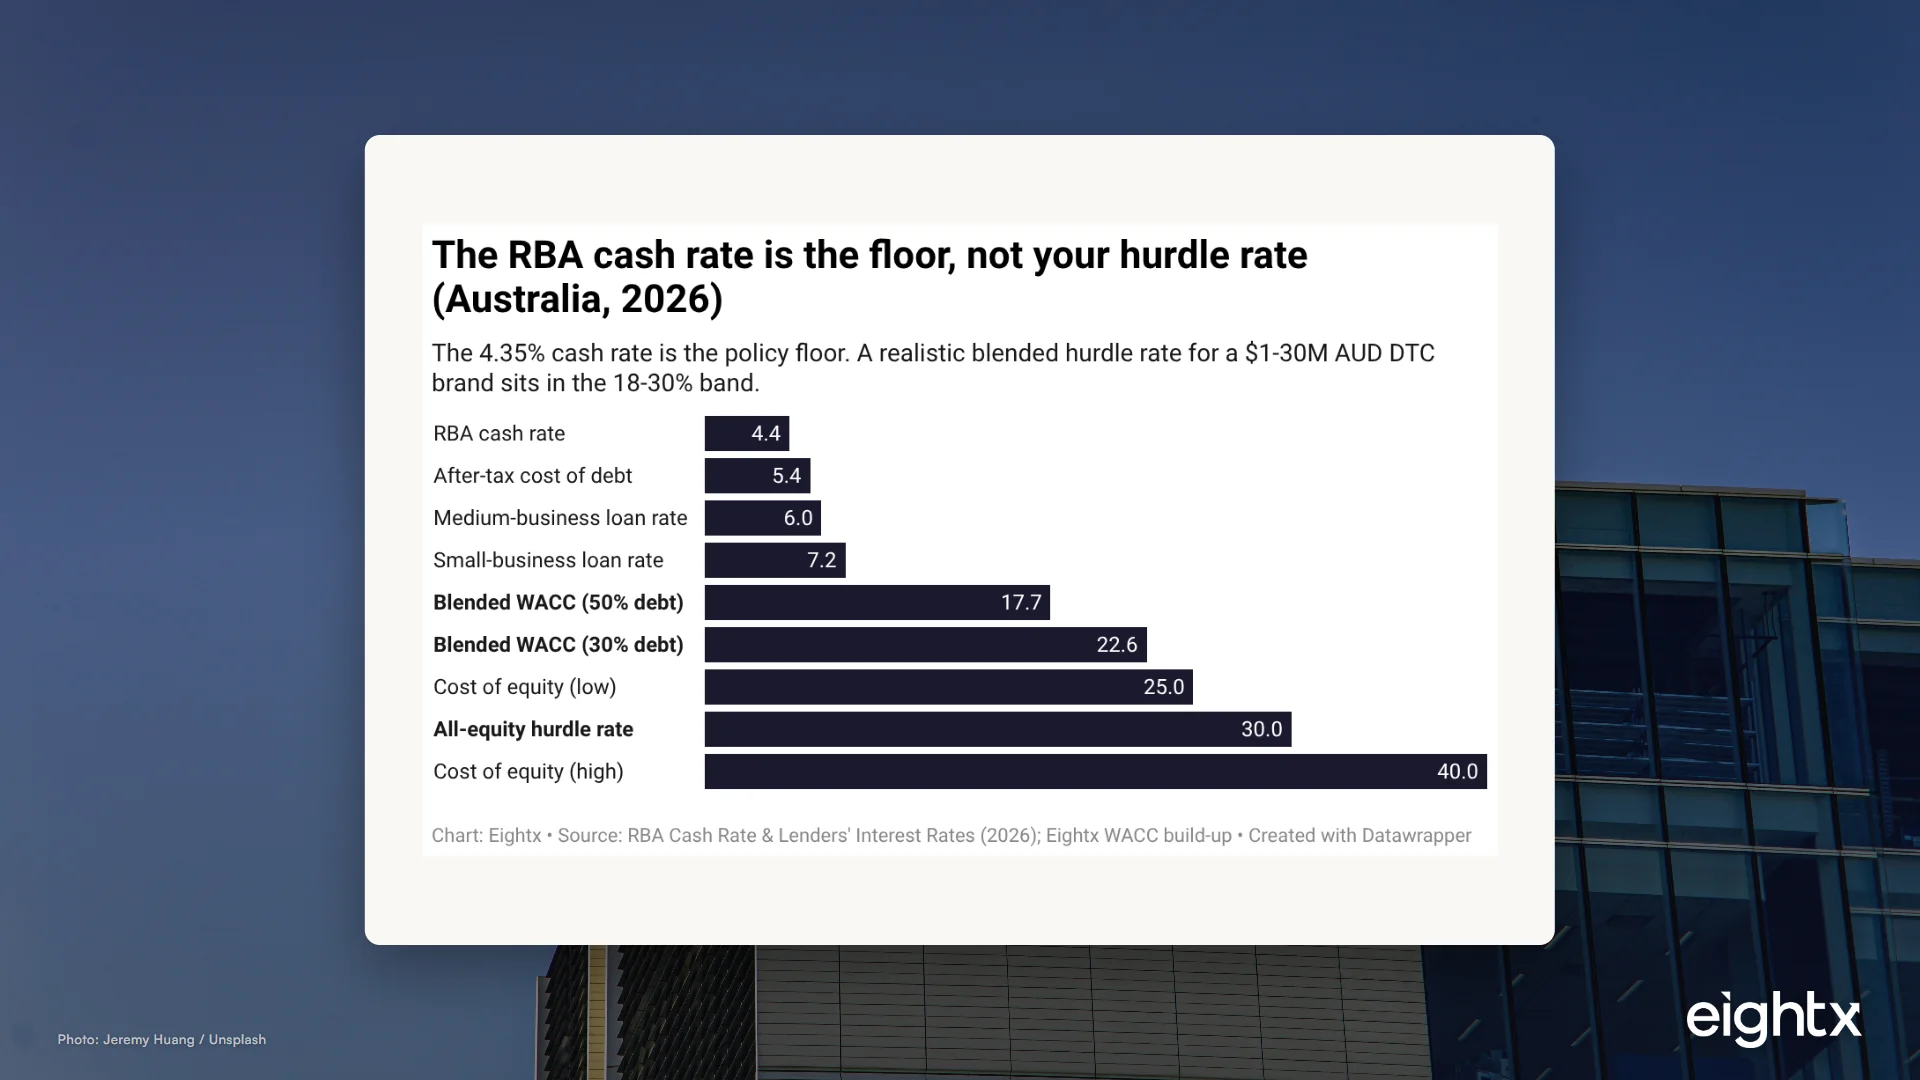
The chart below shows the ladder. The cash rate sits at the bottom. Your actual cost of debt is a few rungs up. And the blended hurdle rate most brands should run, depending on how they fund themselves, sits in the highlighted 18-30% band, with all-equity brands at the top.
The point of the ladder is simple. Stop using the bottom rung to make decisions when your money lives on the higher rungs.
What Australian debt actually costs a DTC brand in 2026
Start with the cheaper side of the blend: debt. The RBA's Lenders' Interest Rates data puts small-business variable lending at roughly 7.19-7.26% in 2026, and medium-business lending at around 5.95-6.07%. So the real cost of borrowed money for most sub-$10M DTC brands is about 7.2%, roughly three percentage points above the cash rate, before any unsecured or fintech premium.
That spread is not going away. Banks price business loans off the cash rate plus a margin, and after three hikes the cash rate has climbed from 3.60% to 4.35% with reaccelerating inflation behind the reversal. The RBA's own May 2026 forecasts embed a 4.70% cash rate by the end of the year, so a reasonable brand should stress-test its debt cost against a rate that is still rising, not betting on cuts. In plain terms: the policy rate that anchors your debt cost is drifting up, not down. Anyone modelling a near-term rate cut into their inventory financing is modelling a number the rate path is not currently giving them.
There is a tax wrinkle that works in your favour. Interest on a business facility is deductible, so the after-tax cost of debt is lower than the headline. At the 25% small-company tax rate, borrowing at 7.2% costs about 5.4% after tax. That is still above the cash rate, but it is the genuinely cheap end of your capital stack, which is exactly why getting access to debt matters so much.
The rate stack below lays out the full menu, from the policy floor up to what equity demands.
| Capital source | Rate (2026) | Notes |
|---|---|---|
| RBA cash rate | 4.35% | Policy floor; +75bp across 2026 (three hikes Feb/Mar/May), up from 3.60% end-2025 |
| Medium-business loan (RBA) | 5.95-6.07% | Secured, established brands |
| Small-business loan (RBA) | 7.19-7.26% | Most sub-$10M DTC brands sit here or above |
| Unsecured / fintech / RBF | 10-15%+ | Cards, merchant advances, revenue-based finance |
| Cost of equity (angel/VC) | 25-40% | Required return / dilution cost |
The pattern we see again and again is that the brands paying the unsecured/fintech rates (10-15%+) are the ones who never set up a proper facility while they had the trading history to qualify, and end up funding inventory off cards because that is the only door open. The time to arrange debt is before you desperately need it.
What equity costs, and why it is the expensive part of your blend
Here is the part most founders skip: equity is capital too, and it is the most expensive capital you have.
When an angel or a VC puts money into a consumer brand, they are not after 7%. They are pricing for the risk that most of the brands in their portfolio will underperform or fail, so the winners have to carry the book. In Australian early-stage venture practice, that required return sits in the 25-40% range. Even if you raised money and it is "just sitting in the bank," that capital still has a cost: the return your investors expect you to generate on it. And if you funded the business with your own cash and retained earnings, the cost is the return you gave up by not deploying it elsewhere.
This is why an all-equity brand has the highest hurdle rate of anyone. If every dollar in your business is equity demanding 30%, then every spend you make has to clear 30% to create value. Most sub-$10M Australian DTC brands are, in practice, all-equity or close to it, because they cannot yet access a bank facility. So the brands that feel like they have the cheapest capital (no loans, no interest bill) are actually carrying the most expensive blend.
When we have worked through this with founders, the lightbulb moment is realising that dilution is a cost. Giving away 15% of the company to fund an inventory expansion is not free money. It is some of the most expensive financing in the entire stack, and it never gets repaid. That reframe changes how people think about whether to raise at all.
Building your real hurdle rate: a worked WACC
Putting it together is straightforward arithmetic. Your blended hurdle rate is your after-tax cost of debt weighted by the share of capital that is debt, plus your cost of equity weighted by the share that is equity.
Take a brand borrowing at 7.2% (about 5.4% after tax at the 25% company rate) with a cost of equity at the 30% mid-point of the range. The table below shows how the blend moves as you add debt to the structure.
| Debt share | Cost of debt (after-tax) | Cost of equity | Blended WACC (hurdle) |
|---|---|---|---|
| 0% (all equity) | 5.4% | 30% | 30.0% |
| 30% debt | 5.4% | 30% | 22.6% |
| 50% debt | 5.4% | 30% | 17.7% |
Read the table as a lever, not a fixed fact. The single biggest move you can make on your hurdle rate is adding affordable debt to a structure that is currently all equity. Going from 0% to 30% debt drops the hurdle from 30% to about 22.6%, because you are swapping out 30%-cost equity for 5.4%-cost debt on that slice of the capital base. That is roughly an 18-points-above-cash-rate hurdle instead of a 26-points-above-cash-rate one, on the exact same business.
To build your own number, plug in three things: the share of your capital that is debt versus equity, the rate on your debt facility, and the return your equity needs to earn (your investors' target, or your own opportunity cost). The output is the one number that should sit above every major spend decision. For most Australian brands that genuinely cannot access debt, the honest answer lands at the top of the band: a hurdle rate of 25-30%, roughly six to seven times the cash rate they were quoting.
The demand side just got harder too
Expensive capital would be manageable if the top line were still booming. It is not.
Nominal Australian retail turnover grew just 4.9% year-over-year to A$37.9bn in June 2025 (ABS Retail Trade, current prices, seasonally adjusted; the body cites the latest single month, while the chart below smooths the series to quarter-averages). That sounds like growth until you set it against inflation: CPI rose 4.1% year-over-year in 2026-Q1 (ABS, All Groups). Strip the price effect out and real retail growth is roughly flat. The rising tide that floated every brand through 2021 and 2022 has gone out. Growth now has to come from share and margin, not from the market expanding underneath you.
The consumer side is tighter still. The ABS Wage Price Index rose 3.2% year-over-year in 2026-Q1, below the 4.1% CPI print. Real household income is shrinking, which is exactly the wrong backdrop for conversion and average order value. Your customer has less to spend in real terms at the same moment your capital costs went up.
When I talk to founders this size right now, the squeeze shows up as a slow bleed: CAC creeping up, AOV flat in nominal terms (so falling in real terms), and the spreadsheet still assuming last year's growth rate. One brand we worked with was happily reordering a hero SKU at a 14% return on the cash that order tied up, while their real hurdle, all-equity, was about 27%. The line looked profitable. It was quietly destroying capital on every reorder. Expensive capital plus a soft consumer is not a reason to panic. It is a reason to be ruthless about which spends actually clear the bar.
What to do with this number
Once you have your real hurdle rate, it becomes the filter for every capital decision. A few concrete moves.
Apply the hurdle to inventory buys. Before you commit to a reorder, ask whether the gross margin dollars that order will generate, net of the cash tied up while it sits in a warehouse, clear your hurdle rate. A buy that returns 12% on the capital it consumes is destroying value if your hurdle is 25%, even though 12% feels positive. The brands that get into inventory trouble are almost always the ones that financed slow-moving stock at a return below their true cost of capital.
Apply it to ad spend too. A marketing dollar is a capital deployment like any other. If a channel cannot clear roughly 20%+ after tax, the equity or debt funding it is being burned. That does not mean stop spending. It means scale the channels that clear the bar and cut the ones that do not, instead of spreading budget evenly and hoping.
Earn a cheaper blend by getting access to debt. The fastest structural way to lower your hurdle rate is to move off an all-equity base. If you have the trading history to qualify for a bank facility or an inventory line near 7.2%, arranging it can knock several points off your blended cost of capital, as the worked table showed. Do it while your numbers are strong, not when you are desperate.
Match the funding to the risk. Use debt for predictable, short-payback spends like reorders of proven SKUs. Use equity for genuinely risky, long-payback bets like a new category or a new market, where fixed repayments against an uncertain return would be dangerous. Mismatching the two (equity for boring reorders, debt for moonshots) is a common and expensive error.
If you want help building the number for your own brand, that calculation is core territory for a virtual CFO in Australia. For the rate input that drives the debt side of your blend, see our read on the RBA cash rate trend for 2026, and for how Australia compares to the wider market, the global DTC cost of capital benchmark.
The RBA cash rate is 4.35%. Your DTC brand's cost of capital is not. It is a blend of debt near 7.2% and equity demanding 25-40%, which puts most Australian brands' real hurdle rate at 18-30%. Price your inventory buys and your ad spend against that number, not the headline, or you will keep approving spends that feel profitable and quietly aren't.
Sources and methodology
RBA cash rate and Lenders' Interest Rates. The 4.35% cash rate (as of June 2026) is the RBA cash rate target from the RBA's published cash-rate series (table F1.1), consistent with our own RBA cash rate trend for 2026 read: the Bank cut through 2025 to a 3.60% end-2025 trough, then reversed with three consecutive +25bp hikes in February, March, and May 2026 to reach 4.35%. The RBA's May 2026 Statement on Monetary Policy embeds a 4.70% cash rate assumption by end-2026, so we stress-test the debt side against a still-rising path rather than assuming cuts. Small-business variable lending of 7.19-7.26% and medium-business lending of 5.95-6.07% are from the RBA Lenders' Interest Rates series for 2026. These are the cost-of-debt inputs for the WACC build. Source: https://www.rba.gov.au/statistics/interest-rates/.
ABS Retail Trade. Total retail turnover (current prices, seasonally adjusted) was pulled from the ABS Retail Trade release. The latest available point at the time of writing was June 2025 at A$37.9bn, a 4.9% year-over-year increase in nominal terms. Retail figures in the chart are quarter-average of the monthly seasonally adjusted series. Note that the latest ABS retail point available was June 2025, so the real-versus-nominal read uses the most recent release rather than a 2026 point.
ABS Consumer Price Index. All Groups CPI was taken from the ABS quarterly series. The 2026-Q1 index implies a 4.1% year-over-year inflation rate. CPI is used both to deflate retail turnover (showing roughly flat real retail) and as the inflation line against wages.
ABS Wage Price Index. Total hourly rates of pay (all industries) were pulled from the ABS WPI quarterly series, giving a 3.2% year-over-year increase in 2026-Q1, below CPI. Year-over-year rates for earlier quarters are computed from the published index series.
WACC build-up. The blended cost-of-capital figures are illustrative, not a quoted benchmark. After-tax cost of debt is 7.2% multiplied by (1 minus the 25% company tax rate), giving 5.4%. Cost of equity uses a 30% mid-point of a 25-40% range drawn from Australian early-stage venture practice; there is no single published AU equity-cost benchmark, so treat that band as a judgement input, not a primary statistic. Blends: all-equity 30.0%, 30% debt 22.6%, 50% debt 17.7%.
Limitations. The intra-2025 RBA easing path (the exact timing of the 2025 cuts) was inconsistent across secondary sources, so this post relies on the RBA's published cash-rate target levels (3.60% end-2025 trough, then three corroborated +25bp hikes in February, March, and May 2026 to 4.35%, with a 4.70% end-2026 forecast from the May 2026 SMP) and the published Lenders' rate levels rather than reconstructing every 2025 meeting. The equity cost band is venture practice, not a cited figure. The ABS retail series' latest point is June 2025, not a 2026 month. The store-count and online-share figures from the broader research were excluded from this post as off-topic for a cost-of-capital read.
A benchmark only pays off when someone acts on it, which is what an Australian virtual CFO does for a growing Australian brand.
Frequently asked questions
what is the cost of capital for an australian dtc ecommerce brand in 2026?
For most $1-30M AUD brands it is roughly 18-30%, not the 4.35% RBA cash rate. The blend depends on how much you fund with debt (around 7.2% before tax) versus equity (which typically demands 25-40%). The more equity-funded you are, the higher your real hurdle rate.
how does the rba cash rate affect borrowing costs for australian online retailers?
Banks price business loans off the cash rate plus a margin, so the three 2026 hikes back up to 4.35% have fed through to higher variable business rates. Small-business loans now sit around 7.2%. With the RBA forecasting a 4.70% cash rate by end-2026 and no cuts in sight, that debt cost is still drifting up, not down.
what wacc should an australian ecommerce founder use as a hurdle rate?
Use your actual blend, not the cash rate. Take your after-tax cost of debt (about 5.4% if you borrow at 7.2% at the 25% company rate), weight it against a cost of equity of 25-40%, and combine by your debt/equity split. For most sub-$10M brands that lands near 25-30% because they are effectively all-equity.
is inventory debt or equity cheaper for an australian dtc brand right now?
Debt is cheaper on paper, around 7.2% versus 25-40% for equity, and it does not dilute you. The catch is access: lenders want security and a track record, so many sub-scale brands cannot get a facility and fund inventory off cards or revenue-based finance at 10-15%+. If you can get bank debt for predictable reorders, it is usually the right call.
what capital structure do australian dtc brands typically use to fund inventory and growth?
Below roughly $5-10M revenue, most are effectively all-equity plus founder cash and cards, because they cannot access structured debt. Larger brands with assets and history blend a bank facility or inventory line with retained earnings. The shift from all-equity to a debt-inclusive structure is one of the biggest hurdle-rate reductions a growing brand can earn.
why is my real cost of capital so much higher than the 4.35% cash rate?
The cash rate is the rate banks lend to each other overnight. You are not a bank. Your money comes from a business loan priced above it, or from equity investors who want a 25-40% return for the risk of backing a single consumer brand. Blend those and you land well north of the headline.
should i raise equity or take on a debt facility to fund my next inventory order?
For a predictable reorder of a proven SKU, debt is almost always cheaper and non-dilutive, if you can get it. Raise equity when the use of funds is genuinely risky and long-payback (new category, new market, brand building) where you do not want fixed repayments against an uncertain return.
is now a bad time to scale ad spend in australia given interest rates?
It is a time to be disciplined, not frozen. With real retail roughly flat and consumer incomes shrinking, the easy top-line growth is gone. Apply your real hurdle rate: if a dollar of ad spend cannot clear roughly 20%+ after tax, the capital funding it is being destroyed, so scale only the channels that clear the bar.