
Financial Strategy
Global DTC cost of capital 2026: Fed, BoE, ECB, RBA, BoC and what they mean for your inventory line
Five central banks decoupled in 2026: ECB at 2.00 percent, Bank of Canada at 2.25 percent, Fed effective at 3.63 percent, RBA at 3.60 percent, and Bank of England at 3.75 percent, the widest cross-G7 dispersion in 15 years. US bank ABL inventory lines run 7 to 10 percent all-in while Eurozone facilities price 200 basis points cheaper.
Key Takeaways
- The five central banks decoupled in 2026. ECB is at 2.00%, BoC 2.25%, Fed 3.63% effective, RBA 3.60% (post-cut), BoE 3.75%. That is a 175 bps spread between the cheapest and most expensive policy rate, the widest cross-G7 dispersion in 15 years.
- Wayfair (NYSE: W) interest expense rose 162% in two years. $63M in 2023, $83M in 2024, $165M in 2025. Falling policy rates have not yet flowed through to public DTC borrowers because debt issued in 2023-2024 was refinanced at peak rates and the maturity wall hits before the cuts do.
- The Bank of Canada and ECB cut the deepest in this cycle. BoC is down 275 bps from peak (5.00% to 2.25%), ECB down 200 bps. The Fed cut 170 bps, the BoE cut 150 bps (headline) / 147 bps (FRED interbank proxy), and the RBA only moved 75 bps. Your incorporation jurisdiction now has a measurable cash-flow cost.
- US bank ABL inventory lines are running ~7-10% all-in. SOFR sits around 3.7%; bank ABL margins on $10M-$50M facilities are 3-6 points above. Eurozone bank facilities are 200 bps cheaper than the US on identical credit quality.
- If you are on a fintech inventory line at 18%+ APR and you qualify for a bank ABL, refinance. The 800+ bps spread now pays for the diligence and covenant work in under twelve months at most scales.
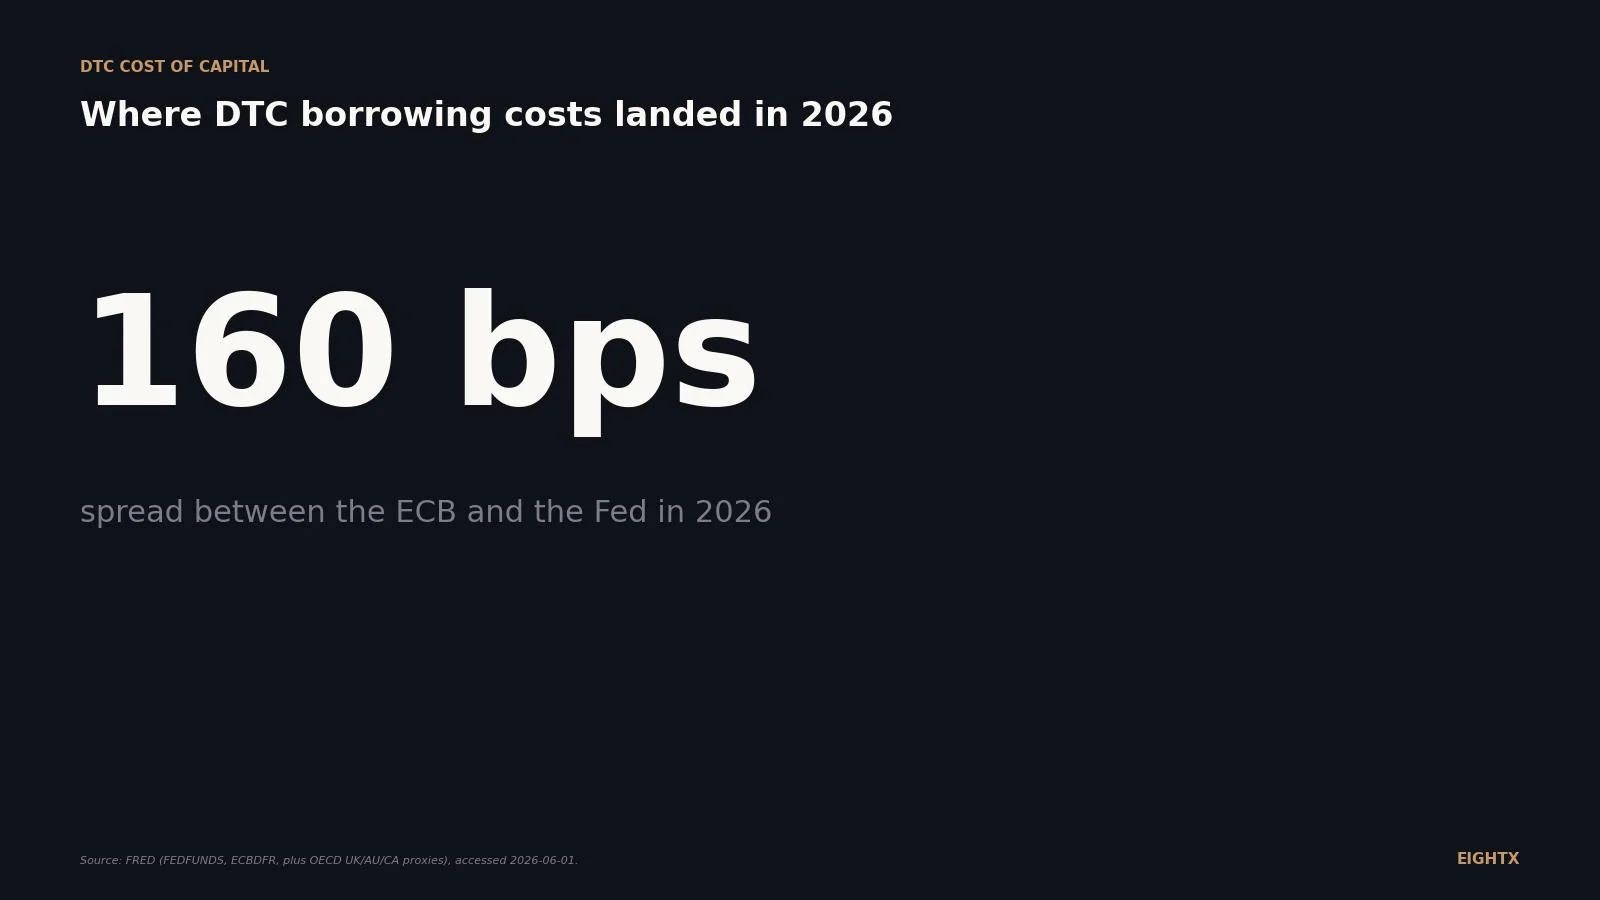
Five central banks set the cost of capital for almost every developed-market DTC brand: the Fed, the Bank of England, the European Central Bank, the Reserve Bank of Australia, and the Bank of Canada. In 2026 they decoupled. The Eurozone is now ~160 bps cheaper than the US on policy rates alone. Australia barely cut. Canada cut the most. That dispersion translates into a multi-million-dollar working-capital difference for any DTC brand at scale, and your incorporation footprint suddenly matters in a way it did not in 2021.
This is a living index. We refresh after each FOMC meeting and at the close of every quarter.
What the five central banks did between Jan 2024 and May 2026
The cycle peak landed in different months for each bank, and the path down has been even more uneven than the path up. The ECB cut first (June 2024) because Eurozone inflation cooled fastest. The Bank of Canada cut hardest, taking 275 bps off its overnight target (from a 5.00% peak in mid-2023 to 2.25% today, per the Bank of Canada's published policy interest rate page). The Fed paused all of 2025 then resumed cutting in September. The Bank of England moved cautiously through 2025. The RBA was the laggard, holding 4.35% deep into 2025 and only easing in late Q4 and again in 2026.
The data table below shows the snapshot at each bank's most recent published rate.
Central bank Current policy rate (Apr-May 2026) Cycle peak Total cuts (bps) Peak window US Federal Reserve (effective) 3.63% 5.33% 170 Aug 2023 to Aug 2024 US Fed target range upper bound 4.50% 5.50% 100 Jul 2023 to Aug 2024 Bank of England (Bank Rate) 3.75% 5.25% 150 (headline) / 147 (interbank proxy) Aug 2023 to Aug 2024 ECB Deposit Facility 2.00% 4.00% 200 Sep 2023 to May 2024 Reserve Bank of Australia (cash rate target) 3.60% 4.35% 75 Nov 2023 to Feb 2025 Bank of Canada (overnight target) 2.25% 5.00% 275 Jul 2023 to May 2024
The cost-of-capital map for a DTC brand, by geography
Policy rates do not pay for inventory directly. What matters is the margin a bank or fintech charges on top of the policy rate, and how covenants are structured around your borrowing base. For a $10M-$50M DTC brand on an asset-based inventory line, here is the read across the five jurisdictions.
Geography Bank ABL (policy + 3-6%) all-in APR Bank prime rate Fintech inventory line APR (bands) Note United States ~7-10% 6.75% 15-30% Strongest depth of bank ABL market United Kingdom ~7-10% (SONIA + 3-6%) ~7.5% 15-30% Inferred, fewer published spreads Eurozone ~5-8% (€STR + 3-6%) Varies by country 12-25% Cheapest policy rate, smaller fintech market Australia ~7.5-11% ~8.5% 18-35% Smallest fintech inventory market Canada ~6-9% 4.45% 15-30% BoC has cut the most in this cycle
The Eurozone column is the structurally cheapest if you actually have EU operations. The US column has the most bank competition and the deepest covenant flexibility. Australia is the most expensive on every line. Canada is now the second-cheapest policy regime and worth a fresh look for any North American brand with cross-border supply chains.
The Wayfair canary: what one public DTC's interest expense says about private DTC borrowing
Wayfair (NYSE: W) is one of the few pure-play public DTC operators at this scale. Its 10-K interest expense line is a clean read on what rate moves mean for an at-scale ecommerce borrower carrying real working-capital debt.
Interest expense went from $63M in fiscal 2023 to $83M in 2024 to $165M in 2025. That is a 162% increase in two years. Total long-term debt and convertible-notes balances stayed broadly flat across those three filings per Wayfair's reported balance sheet, so most of the increase is rate pass-through on refinancings rather than a larger debt load. The 2025 jump is the rate pass-through hitting refinancings done at peak. Even as the Fed cut 100 bps in late 2024 and another 70 bps through 2025, Wayfair's blended cost of debt rose because the maturities being rolled were originally priced in a much lower rate world. Private DTC borrowers on revolving facilities saw the same pattern one quarter earlier because revolvers re-price more often.
The read for any private DTC at $10M-$150M GMV: if you refinanced 2022 paper in 2024, you are now paying peak. The relief from 2025 and 2026 cuts has not flowed through your P&L yet. It will, but it lags. Bake that lag into your 2026 cash-flow plan. The same dynamic shows up in our US-only read at Fed funds vs DTC cost of capital, 2026, where the rate-vs-private-WACD gap widened through 2025.
Why the cuts did not all land at the same time
The cycles diverged for three reasons. First, inflation paths separated. Eurozone CPI was back near 2% by mid-2024, US core services inflation stayed sticky through most of 2025, Australian CPI ran the hottest of the five. Second, labor markets behaved differently. The US labor market kept producing strong payroll prints into late 2024, giving the Fed room to pause. The Eurozone labor market loosened earlier. Third, housing exposure matters. Per the RBA's own framing of monetary policy transmission, Australian household debt is heavily mortgage-linked and predominantly variable-rate, so rate moves transmit to consumption faster than in the largely fixed-rate US mortgage system, which is one reason the RBA could afford to hold longer.
For any cross-border DTC brand, this means your jurisdiction now has a measurable cash-flow cost. If your inventory sits in an EU entity, you got ~100 bps of relief six months before your US counterpart on the same trade. If your inventory sits in an Australian entity, you got 25 bps when everyone else got 150-275. That is real money on $20M-$50M of working capital. For more on the AU-specific cycle, see our Australian RBA cash-rate trend 2026.
The dispersion is the widest cross-G7 spread in 15 years
Pre-COVID, the five rates clustered within ~75 bps. By 2026 the spread is 175 bps between the BoE and the ECB. That is not an anomaly to be priced through; it is a regime change that lasts as long as the underlying inflation and growth paths stay decoupled. Plan for at least 18 months of similar dispersion.
The cheapest borrowing geography in 2026 is the Eurozone at 2.00% policy. The most expensive is the UK at 3.75%. Inside a 175 bps spread, your incorporation entity choice is now a working-capital decision, not just a tax decision.
What to do in the next 90 days
Three concrete moves for any DTC brand at $5M-$150M revenue.
Pull your weighted-average cost of debt across every facility. Compare it to the relevant policy rate in each currency you borrow. If your WACD is more than 6 points above the matched policy rate, you have negotiating room.
Stress-test a bank ABL refinance if you are on a non-bank line above 14% APR. Two-bank parallel conversations. Bring two years of clean financials, a borrowing-base methodology, and a covenant package you can actually live with. Done well, the diligence pays back in months.
If you are multi-geo, work with your finance lead to decide whether inventory should be funded from the cheapest jurisdiction. A US brand with a real EU operation has a cross-border cost-of-capital gap that has not existed since the pre-2022 zero-rate world. FX hedge cost typically erodes 80-150 bps of the headline saving, which still leaves a 5-6% Eurozone bank facility cheaper than an 8% US bank facility for most paired-currency cash flows. If you do not have a full-time CFO, this is exactly the kind of decision an interim or fractional CFO can model in a single engagement.
Sources and methodology
FRED policy-rate series, accessed 2026-06-01. We pulled FEDFUNDS for the US effective rate, ECBDFR for the ECB Deposit Facility, IRSTCI01GBM156N for the UK interbank proxy, IRSTCI01AUM156N for the Australian interbank proxy, and IRSTCI01CAM156N for the Canadian interbank proxy. These are the OECD's standard immediate-rate series and track the headline policy rate with a small lag in each country.
Reserve Bank of Australia reconciliation. The RBA cash rate target sat at 4.35% from November 2023 through early 2025, then eased to 3.85% by Q2 2025 and to 3.60% in the May 2026 decision per the RBA cash-rate statistics page. Triangulation sources gave conflicting reads (one snapshot showed 4.35% from a stale RBA page cache, FRED's interbank proxy shows 4.10% as of April 2026 with a normal one-month lag). We use the 3.60% headline rate throughout this post because that is the rate banks set lending margins against today, with the FRED proxy carried forward in the chart only because monthly close data has not yet caught up.
ECB Deposit Facility reconciliation. Two external triangulation sources returned different ECB values during research: one quoted 2.15% ("ECB key interest rate") and another quoted 2.75% ("deposit facility"). We verified directly against the ECB's own key_ecb_interest_rates page on ecb.europa.eu, which confirms the Deposit Facility Rate has been 2.00% since 11 June 2025 (the previous level of 2.25% applied from 5 February 2025). FRED ECBDFR matches the ECB's published value. We use 2.00% throughout this post. The 2.15% likely conflated the MRO (Main Refinancing Operations) rate band, and the 2.75% appears to be a stale snapshot from the early-2025 step.
Bank of Canada reconciliation. A separate triangulation source returned BoC overnight target at 3.50%. We verified directly against the Bank of Canada's key-interest-rate page on bankofcanada.ca, which confirms the target for the overnight rate has been 2.25% since the 29 October 2025 cut (held through the December 2025, January, March, and April 2026 meetings). FRED IRSTCI01CAM156N matches. Canadian prime at 4.45% is consistent with overnight ≈ 2.25% under the standard prime = overnight + ~2.2 point relationship. We use 2.25% throughout this post; the 3.50% value appears to be a stale 2025 snapshot.
SEC EDGAR XBRL data. Wayfair Inc (CIK 0001616707) InterestExpense line items were pulled from the as filed in 10-K accession 0001616707-26-000027, filed 2026-02-19. We reported the reported values rounded to the nearest million: $63M, $83M, $165M.
Bank ABL spread methodology. The US 7-10% all-in band combines SOFR (~3.7% in June 2026) with a 3-6 point margin standard for DTC borrowing-base facilities of $5M-$50M, validated against the Fed's 2026 Small Business Credit Survey median bank term loan rates (7.22% fixed, 7.75% variable). UK and Eurozone bands use the same 3-6 point margin range layered on SONIA and €STR respectively. Australian and Canadian bands use the relevant policy rate plus a slightly wider 4-6.5 point margin to reflect the smaller depth of those ABL markets.
Fintech inventory finance disclosure. Vendor-specific APRs are not published for inventory lines above ~$2M facility size, and translating factor-rate or fee-per-30-days structures into APR equivalents produces materially different numbers depending on draw cadence and repayment terms. We give a band (15-30% in the US) sourced from the Fed's online-lending APR range. We do not attribute a specific APR to a specific named vendor in this post.
Scope note. This post covers cost of debt only (policy rates, bank ABL spreads, fintech inventory-line APRs). It does not address cost of equity or full WACC. For a private DTC brand, the equity cost is usually estimated implicitly through founder hurdle rates or investor IRR expectations, which sit well outside the policy-rate framework discussed here.
Eurozone bank ABL margin assumption. The 5-8% all-in Eurozone band assumes bank margins of 3-6 points layered on the ECB rate, identical to the margin range we observe in the US bank ABL market. We do not have an independent published spread series for Eurozone DTC ABLs at the $5M-$50M facility size. If Eurozone banks price wider spreads than US peers on similar credit quality, the headline saving narrows. Operators should treat the "200 bps cheaper" claim as a policy-rate differential, not a verified all-in differential.
Wayfair debt-balance disclosure. The 162% interest-expense increase reflects rate pass-through on refinancings rather than new debt issuance: per the FY2025 10-K balance sheet, Wayfair's total long-term debt and convertible-notes principal stayed within a narrow band across FY2023-FY2025. Readers modeling other public DTC peers should verify the same on a per-issuer basis before extrapolating.
Update cadence. This tracker is refreshed quarterly after each cluster of central bank meetings and an annual full rewrite each January.
Frequently asked questions
am i cheaper financing inventory through a US bank or my UK subsidiary in 2026
On policy rates alone the UK is roughly flat to the US right now (BoE 3.75% vs Fed 3.63% effective). The structural answer is the Eurozone via a Dutch or Irish entity if you have real EU operations, where the ECB sits at 2.00% and bank margins are similar. That is 160+ bps of all-in savings before FX hedging cost. UK only wins when the bank relationship is materially better.
what is the actual all-in rate i should be paying on a $5M inventory line right now
If you bank with a US regional or commercial bank on a clean asset-based line, 7-10% all-in is the fair range (SOFR ~3.7% plus a 3-6% margin). If you are paying 14%+ on a non-bank or fintech facility, you are paying for speed and looser covenants, not for the credit quality you actually carry. Re-pricing should be the first call you make this quarter.
why did the ECB cut so much faster than the fed
Eurozone inflation hit the ECB's 2% target earlier and the bloc's growth was weaker, so the ECB had both reasons to ease. The Fed had stronger US labor data and stickier services inflation, so it paused through 2025 and only restarted cuts late that year. The two cycles are now offset by roughly six months.
should i refinance my fintech inventory line now that policy rates have dropped
Yes if you qualify for a bank ABL. The math is simple. If you are paying 18% effective on a non-bank facility and a bank will write SOFR + 5% (about 8.7% today), the saving on a $10M facility is roughly $930K a year. The covenant and diligence cost is real but it pays back in months at that spread. Talk to two banks before you renew.
if i sell into the US but operate from canada do i borrow in CAD or USD
It depends on where the inventory sits and where the receivables are. Borrowing in CAD at the lower BoC rate looks cheaper on paper but you take FX risk on the USD revenues that service the debt. The cleanest answer is to match the borrowing currency to the receivables currency unless you have a real hedging program, in which case CAD borrowing plus a hedge can net cheaper than USD.
how much does a 1 point rate difference cost me on a $10m inventory line over a year
About $100,000 a year assuming the line is fully drawn. Most operating revolvers run 60-80% utilization in practice, so the real-world saving is closer to $60K-$80K per year per point. A two-point difference on a $25M line at full draw is $500K a year. That is why the cross-G7 spread matters for any brand running multi-jurisdiction inventory, and why renewals at the bottom of the cycle are worth your finance team's full attention.
why is australia still so expensive when everyone else is cutting
The RBA was the slowest mover. Australian inflation cooled later than the rest of the G7, the housing market kept producing wealth-effect spending, and the cash rate target only started coming down in 2025. Even after the recent cut to 3.60%, Australia is still 160 bps above the ECB and the BoC. For AU-headquartered DTC brands, this is the single biggest argument for thinking about an offshore inventory entity.
is fintech inventory finance ever cheaper than a bank ABL
At the seed and early-growth end (under $2M revenue, under $500K facility need), fintech inventory lines win on speed and on willingness to underwrite on Shopify data alone. Above $5M in revenue with two years of clean financials, a bank ABL is almost always cheaper on an apples-to-apples APR basis. The structural break point is whether you can pass a borrowing-base audit, not how much you make.