
Insights
Average Canadian ecommerce margin by vertical (2026): Aritzia, Lululemon, Roots and StatCan benchmarks
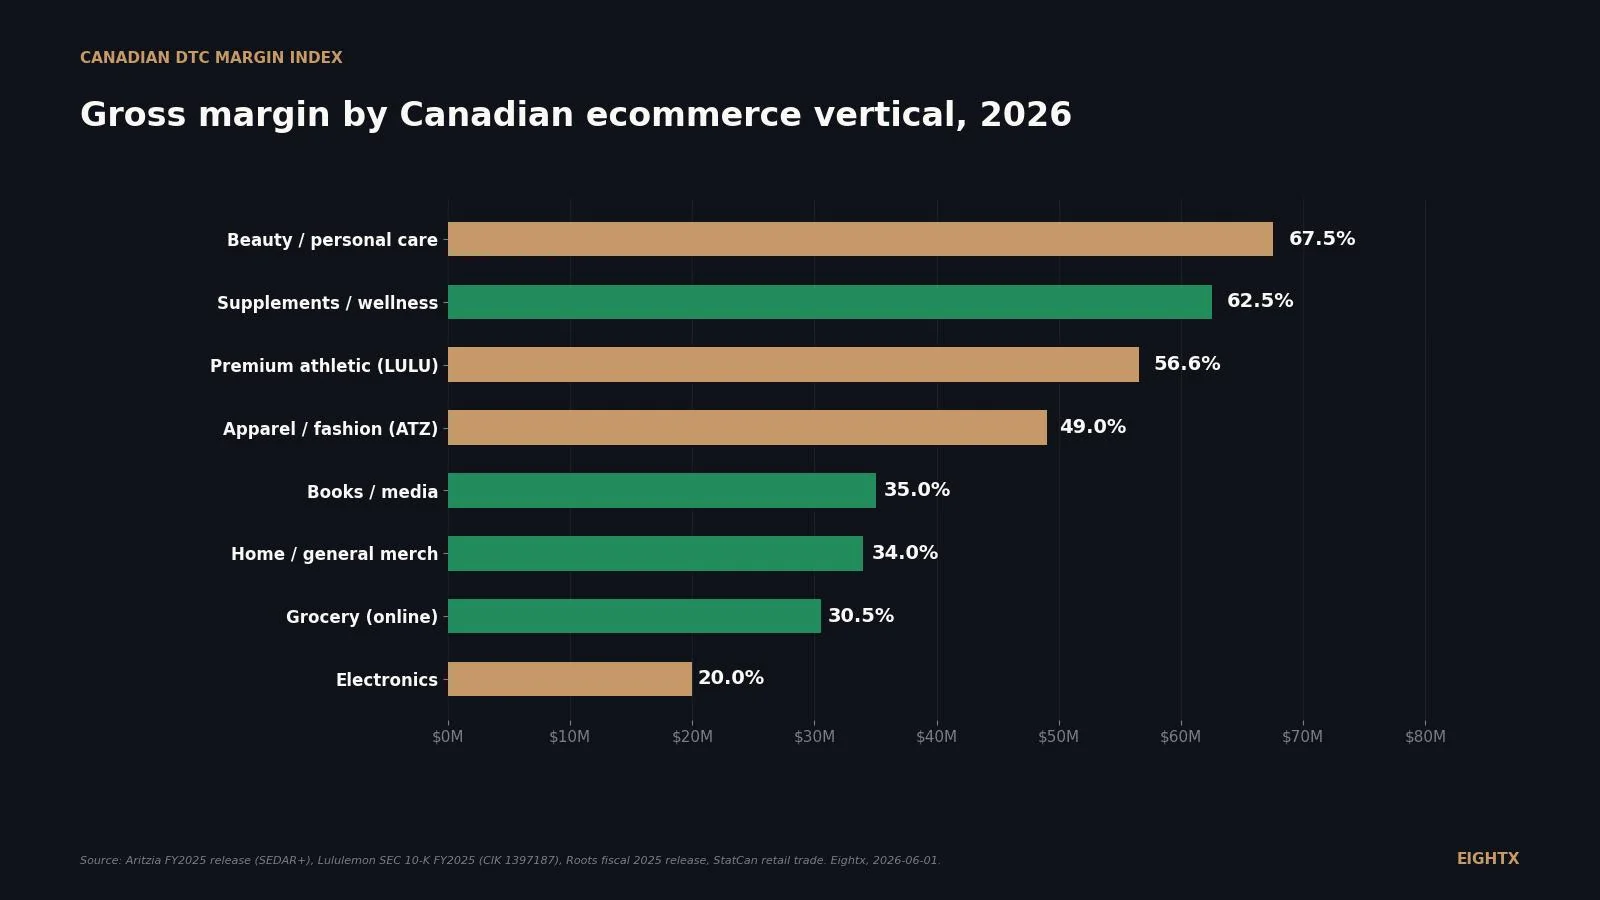
Canadian ecommerce gross profit margin by vertical in 2026 ranges from 18 to 22 percent for electronics up to 60 to 75 percent for beauty, anchored by Aritzia at 43.1 percent, Lululemon at 56.6 percent, and Roots at 61.3 percent from public SEDAR filings. Aritzia disclosed 410 basis points of gross-margin pressure from US tariff and de-minimis changes in a recent quarter. Sourcing, not promotions, is the first lever when your margin trails the public-comp band.
Key Takeaways
- Aritzia FY2025 (year ended March 2025) full-year gross margin hit 43.1%, up 460 bps from 38.5% in FY2024. Adjusted EBITDA margin 14.8%. FY2026 guidance is 15.5-16.5% Adj EBITDA, with explicit tariff drag flagged.
- Lululemon FY2025 gross margin was 56.6% on $11.10B revenue, with 19.9% operating margin. Down 260 bps and 380 bps year-over-year from FY2024's 59.2% / 23.7%. That is the global premium-athletic ceiling for Canadian operators.
- Aritzia disclosed 410 bps of recent-quarter gross-margin pressure from trade. One-third was US de-minimis elimination, two-thirds was tariffs. On $20M USD revenue that maps to roughly $820K of gross profit.
- Bank of Canada (BoC) is at 2.25% and the C.D. Howe Monetary Policy Council recommends holding through October 2026. Roughly 275 bps below the April 2024 peak of 5.00%. Cheaper inventory financing, weaker demand backdrop.
- Canadian ecommerce share of retail trade hit 7.1% in March 2026, up from 6.0% in October 2025. Still mid-single-digit, but the trend line is real. Online clothing share is roughly 3.8%.
A Canadian DTC operator running a $15M apparel brand asked us last month what gross margin she should be targeting in 2026. The honest answer used to be: we don't really know, because the Canadian public-comp data was thinner than the US set. That excuse is gone as of mid-2026. Aritzia (TSX:ATZ), Lululemon (NASDAQ:LULU, Vancouver-anchored), Roots (TSX:ROOT), Dollarama, Loblaw, and Canadian Tire have all reported through Q1 calendar 2026 with explicit gross margin, EBITDA margin, and channel-mix disclosures. Aritzia in particular has quantified the tariff and de-minimis hit on Canadian sellers shipping into the US. This post is the operator read on what those filings mean for your 2026 plan.
Gross margin (revenue less cost of goods sold, divided by revenue) is a vertical question, not a country question. Beauty sits in the 60-75% band, apparel in the 43-59% band, electronics in the 18-22% band. Where the Canadian-specific context actually shows up is EBITDA margin, where tariff exposure, FX translation, and the Bank of Canada rate path all play out. If your gross margin is 5+ points below your vertical's public-comp Canadian anchor in 2026, the gap is almost always sourcing or landed cost, not pricing.
The 2026 Canadian DTC margin reset
Three public Canadian apparel names define the spread. Aritzia closed fiscal 2025 (year ended March 2, 2025) at 43.1% full-year gross margin, up 460 basis points from 38.5% the prior year, with 14.8% adjusted EBITDA margin. Lululemon closed fiscal 2025 (year ended February 1, 2026) at 56.6% gross margin on $11.10 billion revenue, with 19.9% operating margin (per the 10-K filed March 17, 2026, CIK 1397187). Roots ran a record 61.3% gross margin in fiscal 2025, up 150 bps year-over-year, with DTC (stores plus ecommerce) carrying roughly 86.5% of Q1 sales.
That spread (43% to 56% to 61%) is the story. Aritzia is the contemporary-premium anchor, Lululemon is the global premium-athletic ceiling, Roots is the heritage full-price anchor. If your Canadian apparel brand is below 43% gross, the operator question is sourcing. If you are between 43% and 56%, you are in the Aritzia-to-Lululemon corridor and the levers are mix and markdown. If you are at or above 56%, you are running Lululemon-class economics and the question is whether your top line can scale at that margin.
The vertical spread holds across the rest of the table. Beauty and personal care (60-75%) and supplements and wellness (55-70%) sit at the top because product cost is a small share of price and retention drives marketing efficiency. Grocery (28-33%), electronics (18-22%), and books and media (30-40%) sit at the bottom because the unit economics are structurally tight. If you are reading this and you operate in one of the bottom-table verticals, the EBITDA discipline is everything (look at Dollarama's 33.9% Q4 FY2026 EBITDA margin on a sub-40% gross margin: lean SG&A is the moat).
Apparel and premium athletic: the converging trajectory
The most interesting chart in Canadian retail right now is Aritzia and Lululemon side by side over four years. Aritzia has climbed from 32.1% gross margin in FY2023 to 38.5% in FY2024 to 43.1% in FY2025 to 45.3% H1 FY2026 (Q1 47.2%, Q2 43.8%, Q3 46.0% sequentially). Lululemon has gone the other direction, from 58.3% in FY2023 to 59.2% in FY2024 to 56.6% in FY2025.
The gap was 26 points two years ago. It is roughly 11 points now. Two things drove the convergence. Aritzia worked through aggressive markdowns from its FY2023 inventory mess and rebuilt full-price share. Lululemon hit the scale where lapping a 59% gross margin gets harder every quarter (currency, mix, and the cost of running a global store network all bite at the margin). Neither move is permanent. Aritzia's FY2026 guidance flags "partially offset by higher U.S. tariffs," so the climb has a ceiling. Lululemon's 56.6% is still a global benchmark, not a problem.
For your own Canadian brand: if you have been compressing margin since 2023, the comparator is Lululemon, not the calendar. If you have been expanding margin, the comparator is Aritzia, and the question is whether the expansion is sustainable or you are lapping a discount-cycle low.
The tariff and de-minimis hit, quantified
Aritzia's CFO commentary in May 2026 is the single best Canadian-specific data point on tariff exposure for a DTC seller with material US revenue. The disclosure: 410 basis points of gross-margin pressure in one recent quarter from "trade-related challenges," with one-third attributable to US de-minimis elimination and two-thirds to tariffs.
That number is portable. We have run the math for a hypothetical $20M USD-revenue Canadian DTC selling into the US, using Aritzia's bps split as the starting point.
Scenario Gross margin impact Equivalent dollar on $20M USD revenue Tariff exposure only (two-thirds of 410 bps) -273 bps -$546K gross profit De-minimis elimination only (one-third of 410 bps) -137 bps -$274K gross profit Combined -410 bps -$820K gross profit Partial USDCAD translation offset (assume +120 bps revenue tailwind) +120 bps +$240K revenue Net hit, illustrative -290 bps ~$580K gross-profit reduction
On the ground, this matches what we have been hearing on operator calls for over a year. A $30M Canadian apparel brand sourcing from Asia has been running tariff-sensitivity models since early 2024. Whether the brand passes the cost through to consumers or absorbs it, the consumer-behavior impact still shows up. A separate $15M wellness DTC client has been using an internal tariff calculator to model the P&L hit before deciding whether to reroute supply. The play is the same in both cases: get ahead of the shock instead of reacting at quarter-end.
One operator-side caveat. We have seen reports of couriers offering tariff or duty workarounds to mid-market sellers. Some of those arrangements turn out to be sketchy on the labor-sourcing side. Do not chase the shortcut. The bps you save on duty are not worth the brand or legal exposure you take on.
Beauty, wellness, and the 60%+ gross-margin verticals
Beauty and personal care brands typically sit at 60-75% gross margin in Canada in 2026. Supplements and wellness sit at 55-70%. The math is straightforward: product cost is a small share of retail price, retention is high, and subscription models pull AOV up over time. That is why a Saje Natural Wellness (private; margins inferred from peer specialty wellness benchmarks) or a comparable Canadian beauty DTC can absorb a tariff hit that would crush an apparel brand. A 410 bps tariff hit on a 70% gross margin still leaves you at 66%. The same hit on a 43% gross margin takes you to 39%, which is below the operating threshold for most apparel cost structures.
The EBITDA math holds the same shape. Beauty and personal care plans to 12-18% EBITDA, with 20%+ for top operators. Supplements and wellness plans to 10-15%. Premium athletic (Lululemon-class) plans to 18-22%. If you operate in one of these verticals and you are below the EBITDA band, the diagnostic question is usually marketing efficiency, not COGS.
The grocery, electronics, and books reality check
The bottom of the table is honest about its constraints. Loblaw runs grocery at roughly 32% gross margin and 3-5% mid-cycle EBITDA. Canadian Tire runs general merchandise at roughly 35% gross and 7-10% EBITDA. Dollarama runs discount value at 33.9% Q4 FY2026 EBITDA (margin not gross) on a 30-40% gross margin. Indigo (TSX:IDG, delisted May 2024 after Trilogy Retail took it private at C$2.50) ran books and media in the 30-40% gross range with negative operating margin in its last reported years before privatization.
For an online operator in these verticals, the planning constraint is not "what is my vertical's gross margin ceiling." You already know it. The constraint is operating-cost discipline. Dollarama's 33.9% EBITDA on a sub-40% gross is the case study: you get there by treating SG&A like the moat instead of treating brand as the moat. That is the trade-off.
What the macro means for your 2026 plan
Three macro lines matter for a Canadian DTC operator right now. Bank of Canada overnight rate. Canadian apparel CPI year-over-year. USDCAD. They all sit on one chart with a secondary axis because USDCAD operates at a totally different scale than the percentage figures.
BoC is at 2.25% (May 2026), down 275 bps from the 5.00% peak in April 2024. C.D. Howe's Monetary Policy Council recommends holding at 2.25% through October 2026, with a potential rise to 2.50% by April 2027. Canadian apparel CPI was +1.5% year-over-year in April 2026 (index 94.8 vs 93.4) compared to +4.2% YoY for US apparel CPI in the same month. USDCAD has hovered between 1.36 and 1.42 across the window. The combination is: cheaper financing, soft demand, weak loonie giving translation tailwind on US revenue.
What to do this quarter. First, reprice your line of credit. If you have not had a credit conversation in 12 months your rate is stale by 100-200 bps. Second, if 30%+ of your revenue is USD, build a layered USDCAD hedge program (50-70% of expected USD inflows on 12-month forwards). Third, do not lean on price increases to recover tariff drag. Canadian apparel CPI at +1.5% means the consumer is not absorbing what your US peers can push through, so margin expansion has to come from sourcing.
Gross margin in Canadian ecommerce is a vertical question first. The Aritzia, Lululemon, and Roots spread (43% to 56% to 61%) defines the apparel band; beauty and wellness sit above it; grocery, electronics, and books sit below it. Where Canada actually differs from the US is at the EBITDA line, where the BoC rate, USDCAD, and the tariff and de-minimis drag all play out. If you are 5+ points below your vertical's Canadian public-comp anchor, the gap is almost always sourcing, not pricing.
What we're watching next
Aritzia's FY2026 full-year results land in roughly June 2027 and will be the first clean read on a full year of tariff impact. Lululemon Q1 FY2026 reports in mid-2026 and will tell us whether the 56.6% gross margin holds or compresses further. StatCan retail ecommerce share for April and May 2026 will print over the summer; we will refresh the 7.1% March figure once those land. Bank of Canada's next rate decision is scheduled for July 30, 2026.
For more on how to use these numbers in your own model, see our average ecommerce profit margins explainer, the DTC layoff and hiring tracker, and our fractional CFO services overview.
Sources and methodology
Aritzia (TSX:ATZ) FY2025 annual results release for fiscal year ended March 2, 2025: full-year gross margin 43.1%, adjusted EBITDA margin 14.8%. We also pulled the FY2026 Q1 release (47.2% gross margin), Q2 release (43.8% with explicit "partially offset by additional tariffs" language), and Q3 release (46.0%). The FY2026 EBITDA guidance range of 15.5-16.5% was disclosed in the Q2 release.
Lululemon Athletica Inc. (CIK 1397187, ticker LULU) financial statements were pulled via the SEC EDGAR API for annual filings. FY2025 (fiscal year ended February 1, 2026): revenue $11,102.6M, COGS $4,818.5M, gross profit $6,284.1M, gross margin 56.59%. SG&A $4,066.6M, operating income $2,210.6M, operating margin 19.91%. FY2024 (FYE February 2, 2025): revenue $10,588.1M, gross profit $6,270.8M, gross margin 59.22%. FY2023 (FYE January 28, 2024): revenue $9,619.3M, gross profit $5,609.4M, gross margin 58.32%. Source: 10-K filed March 17, 2026.
Roots Canada (TSX:ROOT) fiscal 2025 results release: full-year gross margin 61.3% (+150 bps year-over-year), Q1 61.5%, Q2 60.7%, Q4 61.8%. Dollarama (TSX:DOL) Q4 FY2026 release: EBITDA margin 33.9%. Indigo (TSX:IDG) was delisted on May 31, 2024 after Trilogy Retail took it private at C$2.50 per share, a 69% premium to the February 1, 2024 close of C$1.48. We used FY2022-FY2024 SEDAR+ MD&A for the historical book-and-media range.
Statistics Canada retail ecommerce share data via TD Economics' summary of the March 2026 release: 7.1% of total retail trade (up from 7.0% in February). Marcus & Millichap's December 2025 brief reported the October 2025 ecommerce share at 6.0%. StatCan's 2021 annual retail trade survey reported 26.9% all-retail gross margin and 5.5% operating profit margin (latest full annual published as of June 2026). Bank of Canada policy rate history sourced directly from bankofcanada.ca. BLS CPIAPPSL for US apparel CPI (+4.2% YoY April 2026) for the cross-border comparison.
Limitations. Lululemon is a US-listed company with Canadian origin. Treating it as a Canadian anchor is defensible because design, brand, and a material share of revenue are Canadian-anchored, but its 56.6% gross margin reflects global scale and US-store economics, not domestic Canadian ecommerce alone. Aritzia's FY2026 full-year is not yet reported; we have Q1, Q2, and Q3 only. Saje Natural Wellness is private with no audited margin disclosure and is treated as inferred from peer benchmarks. StatCan retail ecommerce table reports with roughly six weeks of lag. The Canadian retail trade survey from StatCan releases annually with significant lag (2021 is the latest published full annual as of June 2026).
Update cadence. This is a living index refreshed quarterly when major Canadian and US public-company filings land and when the StatCan ecommerce share update prints. Next update target: September 2026 after Aritzia FY2027 Q1 and Lululemon FY2026 Q2 report.
Frequently asked questions
what's the average gross margin for canadian ecommerce in 2026 by vertical?
Beauty and personal care sits at 60-75%, supplements and wellness 55-70%, premium athletic (Lululemon-anchored) 55-60%, apparel and fashion 43-55%, books and media 30-40%, home and general merchandise 30-38%, pet 28-38%, grocery 28-33%, electronics 18-22%. Gross margin (revenue minus cost of goods sold, divided by revenue) is a vertical question first and a country question second.
how does my canadian dtc apparel brand compare to aritzia's 43% gross margin?
If you sit at or above 43% you are in line with the public-comp Canadian apparel anchor. Roots ran 61.3% in fiscal 2025 because the heritage segment carries higher full-price share. The gap between Aritzia's 43% and your number is usually landed cost (tariffs, freight, FX) plus markdown discipline, not pricing power. If you are 5+ points below 43% the first lever is sourcing, not promotions.
how much did the us tariff and de-minimis change actually cost canadian dtc sellers in 2026?
Aritzia disclosed 410 bps of gross-margin pressure in a recent quarter from trade-related challenges, with one-third from US de-minimis elimination and two-thirds from tariffs. On a $20M USD-revenue Canadian DTC selling into the US, that is roughly $820K of annual gross profit, partially offset by 100-200 bps of USDCAD translation tailwind from a weak Canadian dollar.
should i be hedging usdcad if 30%+ of my revenue is US?
If USD revenue is 30% or more of your top line and your COGS is largely CAD or third-currency, a 12-month layered forward program (hedging 50-70% of expected USD inflows) is the standard play. The BoC at 2.25% sits well below the US Fed funds target range, which gives USDCAD a structural carry. Talk to a CFO before you put on the trade; ratio and tenor matter more than the headline.
why is lululemon's gross margin falling while aritzia's is rising?
Lululemon is lapping a high base (59.2% in FY2024) and absorbing currency, mix, and markdown drag at scale. Aritzia is climbing from a 38.5% FY2024 base on sourcing improvement and a higher full-price share. The gap was 26 points in FY2023 and is roughly 11 points in FY2026 YTD. Both moves are real. Neither is permanent.
what gross margin should a canadian beauty or wellness brand target in 2026?
65-70% gross margin is the planning range for an established Canadian beauty or wellness DTC, with 12-18% EBITDA at the base case and 20%+ for the top quartile. Saje is the named Canadian wellness reference (private, so margins are inferred from peer specialty wellness benchmarks). If you are below 60% gross, the gap is almost always promotional intensity or oversized retainer marketing spend, not COGS.
is the canadian ecommerce market still growing or has online share plateaued?
Still growing, slowly. StatCan retail ecommerce share was 6.0% in October 2025, 7.0% in February 2026, and 7.1% in March 2026 per TD Economics. That is roughly +110 bps in five months. The Canadian ceiling is still meaningfully below US (around 16%) and Australia (around 13%), so vertical mix matters more here than in either market.
how does the bank of canada holding rates at 2.25% affect dtc demand in canada?
Two effects. First, cheaper inventory financing (your line of credit and your factoring rate both reprice lower over six to nine months). Second, modest consumer-spending support as mortgage renewals reprice off the BoC's 5.00% peak from April 2024 (per bankofcanada.ca policy-rate history). The C.D. Howe Monetary Policy Council recommends BoC holds at 2.25% through October 2026, so plan for stable, not accelerating, demand.
what ebitda margin should i target if i'm a $5m to $20m canadian dtc brand?
Apparel and fashion: 10-15% base case, 18% top quartile. Beauty and personal care: 12-18%, with 20%+ for the best operators. Supplements and wellness: 10-15%. Premium athletic: 18-22%. Below those bands you are underearning the vertical; well above them you are either underinvesting in growth or running an unusually efficient operation worth studying.