
Insights
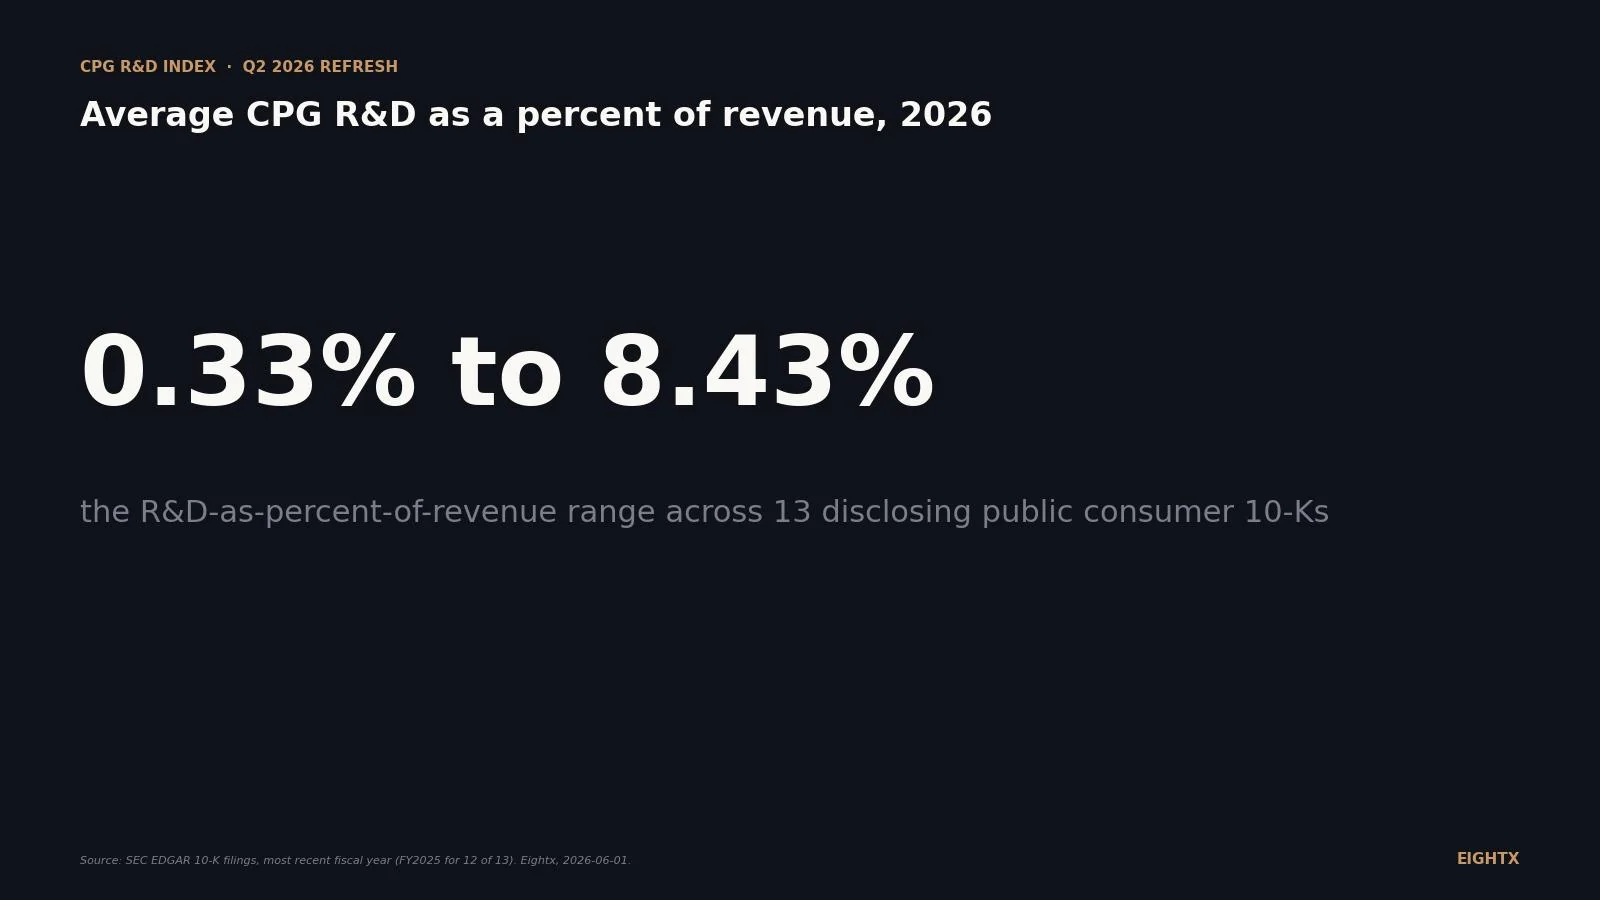
Average CPG R&D as a percent of revenue (2026): 0.33% to 8.43% across 13 public 10-Ks
CPG R&D as a percent of revenue ranges from 0.33 percent (Hain Celestial) to 8.43 percent (Beyond Meat) across 13 public companies disclosing a separate R&D line in their 10-Ks. HPC majors like P&G and Kenvue run 1.7 to 2.6 percent. Food and beverage majors like PepsiCo and Colgate run 0.4 to 0.9 percent. Private DTC brands at $5M to $50M typically land near 1 percent because contract manufacturers absorb most formulation cost into per-unit COGS.
Key Takeaways
- Public CPG R&D ranges 0.33% to 8.43% of revenue in FY2025 across 13 disclosing 10-Ks. Hain Celestial is the floor at 0.33%. Beyond Meat is the ceiling at 8.43%. The cross-vertical median is 1.80% (Colgate-Palmolive).
- Household and personal-care majors cluster 1.7% to 2.6%. P&G 2.49%, Kenvue 2.53%, Church & Dwight 2.35%, Edgewell 2.59%, Colgate 1.80%, Clorox 1.70%. Big-cap food and beverage runs lower at 0.4% to 0.9% (PepsiCo 0.89%, Simply Good Foods 0.38%, Hain 0.33%).
- 5 of 17 public consumer brands in our pull do not disclose R&D as a separate line item. Coca-Cola, e.l.f. Beauty, Vital Farms, Olaplex, and Estée Lauder (last disclosed FY14). Any screener-derived average silently excludes 30%+ of the relevant peer set.
- R&D dollars are sticky, percent of revenue is the wrong KPI for private brands. Most of the 13 disclosers moved R&D dollars less than 5% year-over-year. Beyond Meat cut R&D 17% in FY25 for cash conservation. Public CPG treats R&D as fixed overhead, not a variable of revenue.
- For a private $5M to $50M DTC or CPG brand, the realistic 2026 benchmark is 0.5% to 3.0% of revenue. Matt's working assumption on Eightx founder calls is 1% of revenue at $10M to $25M. Below the public median because contract manufacturers absorb most formulation cost into COGS.
Public CPG and consumer-brand R&D ranges from 0.33% of revenue at Hain Celestial up to 8.43% at Beyond Meat across the 13 public 10-Ks that disclose R&D as a separate income-statement line. The household and personal-care (HPC) majors cluster 1.7% to 2.6%. The food and beverage majors cluster 0.4% to 0.9%. Cross-vertical median sits at 1.80% (Colgate-Palmolive). The story underneath the headline range: there is no single "CPG R&D benchmark" because the number is structurally determined by vertical, brand maturity, and whether the company even calls product-development spend "R&D" at all.
5 of 17 public consumer brands we pulled (e.l.f. Beauty, Vital Farms, Olaplex, Coca-Cola, and Estée Lauder, which last disclosed in FY14) do not report R&D as a separate income-statement line. That fact reshapes the benchmark conversation for any private $5M to $150M operator trying to size an innovation budget. Don't benchmark a private DTC supplement brand at 2% R&D because that's what P&G runs. Benchmark against the disclosing public peer in your vertical, and recognize that for most private brands the relevant comparable is "innovation as a percent of operating expenses," not "R&D as a percent of revenue."
This post is a living index. We refresh it quarterly as new 10-Ks land on SEC EDGAR (P&G in August, the December-FY filers in February, retail-FY filers in March and April).
What the public CPG 10-Ks actually disclose
Pulling the most recent 10-K from each of the 17 public consumer brands on our list gives 13 companies that disclose R&D as a separate income-statement line under US GAAP tag ResearchAndDevelopmentExpense. The other 5 (Coca-Cola, e.l.f. Beauty, Vital Farms, Olaplex, and Estée Lauder) do not break R&D out as a separate line at all. We treat the 13 disclosers as the leaderboard sample throughout this post.
The spread tells most of the story by itself. Beyond Meat at 8.43% is the structural outlier. The next-highest cluster (Edgewell 2.59%, Kenvue 2.53%, P&G 2.49%, Church & Dwight 2.35%) is HPC and consumer-health. The bottom of the table (Hain 0.33%, Simply Good Foods 0.38%, BellRing 0.69%, PepsiCo 0.89%) is food and beverage with mature SKU bases and outsourced formulation cycles.
Company Vertical Most recent FY end Revenue ($M) R&D ($M) R&D % of revenue Beyond Meat Alt-protein food 2025-12-31 275.5 23.24 8.43% Edgewell Personal Care Personal care 2025-09-30 2,223.5 57.6 2.59% Kenvue Consumer health 2025-12-28 15,124 382 2.53% Procter & Gamble Household & personal care 2025-06-30 84,284 2,100 2.49% Church & Dwight Household & personal care 2025-12-31 6,203 145.6 2.35% Honest Company Baby & personal care 2025-12-31 371.3 7.35 1.98% Colgate-Palmolive Household & personal care 2025-12-31 20,382 366 1.80% Clorox Household 2025-06-30 7,104 121 1.70% USANA Health Sciences Supplements 2026-01-03 925.3 10.69 1.16% PepsiCo Food & beverage 2025-12-27 93,925 839 0.89% BellRing Brands Nutrition shakes 2025-09-30 2,316.6 16 0.69% Simply Good Foods Better-for-you food 2025-08-30 1,450.9 5.5 0.38% Hain Celestial Natural & organic food 2025-06-30 1,559.8 5.22 0.33%
Why R&D percent of revenue is so different by vertical
HPC and consumer health run higher because the product-development job is technical and continuous. Formulation chemistry, dermatological safety, packaging engineering, and regulatory work all sit inside a centralized R&D function at companies the size of P&G or Kenvue. That R&D line typically captures a couple thousand scientists, a global lab footprint, and clinical-trial spend that flows through GAAP R&D in a textbook way. Edgewell at 2.59% is the highest non-alt-protein number on the list because shave and feminine-care formulation tends to be technical and IP-protected.
Food and beverage runs lower because product development at scale is mostly flavor extension, packaging refresh, and supply-chain reformulation. PepsiCo at 0.89% on $93.9B in revenue is still spending $839M a year on R&D, but the work skews toward minor SKU changes that don't carry the technical depth (and therefore the centralized lab cost) of an HPC formulation cycle. Simply Good Foods at 0.38% and Hain Celestial at 0.33% sit at the floor because both companies rely heavily on contract manufacturers for formulation work, and that spend gets booked into per-unit COGS rather than into a standalone R&D line.
Alt-protein and clinical-supplement brands run materially higher. Beyond Meat at 8.43% is the structural outlier: it is closer to a food-science startup than a typical CPG brand, with ongoing protein-chemistry and texture research that has no equivalent inside a P&G or a Colgate. USANA at 1.16% is supplement formulation. Honest Company at 1.98% is unusually high for its revenue scale ($371M) because clean-ingredient positioning requires substitution research and claims testing that other personal-care brands at similar revenue would not separately budget for.
The three-year trend confirms the structural reading. P&G stayed flat in a tight band around 2.4% to 2.5%. PepsiCo flat at 0.88% to 0.89% across all three years. Kenvue is the most interesting line because it normalized from FY24 (2.64%) back to FY25 (2.53%) as post-spin-off integration costs unwound. Beyond Meat fell from 11.51% in FY23 to 8.43% in FY25, a 308-basis-point compression driven by a 17% cut in R&D dollars (FY24 $28.15M to FY25 $23.24M) as part of cash conservation. R&D percent for Beyond Meat is falling because they are spending less, not because revenue is growing.
The hidden R&D problem: brands that bury it
Five public consumer brands in our 17-company pull do not disclose R&D as a separate income-statement line. That is roughly 30% of the relevant peer set, which means any "average CPG R&D" pulled from a screener silently excludes a meaningful share of the comp universe.
Company Vertical Most recent FY end Revenue ($M) Disclosed R&D Coca-Cola Beverage 2025-12-31 47,941 Not disclosed as separate line e.l.f. Beauty Mass-market color cosmetics 2026-03-31 1,636.5 Not disclosed as separate line Vital Farms Better-for-you food 2025-12-28 759.4 Not disclosed as separate line Olaplex Prestige haircare 2025-12-31 423.0 Not disclosed as separate line Estée Lauder Prestige beauty 2025-06-30 14,326 Last separately disclosed FY2014 ($157.9M)
None of these brands spend zero on product development. e.l.f. ships dozens of new shades a quarter and would not be hitting the cadence it is hitting without internal innovation muscle. Olaplex's patent portfolio sits on prestige-haircare chemistry that took years of formulation work. The spend exists. It is just being classified into cost of revenue (formulation booked as per-unit COGS at the contract manufacturer), selling and general expenses (consumer research, claims testing, innovation-team salaries), or marketing (new-SKU launch work).
Why this matters for your business: if you are a private $10M to $50M brand and you read a public benchmark that says "CPG R&D averages 2-4% of revenue," and your own P&L shows 0% R&D because all your formulation work runs through your contract manufacturer, you have not under-invested. You have classified consistently with how Olaplex or e.l.f. classify. The benchmark comparison only works if you adjust for classification.
What the right benchmark looks like for a $5M to $50M private brand
The vertical-matched comparable is what does the work. If you run a private supplement brand at $10M, USANA at 1.16% is your closest disclosing public peer, not P&G at 2.49% or PepsiCo at 0.89%. If you run a clean-ingredient personal-care brand at $20M, Honest Company at 1.98% is the comparable. If you run a better-for-you food brand at $40M, Simply Good Foods at 0.38% (or Hain at 0.33%) is the comparable.
The scatter plot shows two useful things. First, R&D dollars don't scale linearly with revenue. At $20B of revenue, you can be spending $366M (Colgate) or $839M (PepsiCo, four times larger revenue, two times the R&D). Second, Beyond Meat sits visibly above the trend at its revenue scale, which is what the 8.43% number tells you. PepsiCo sits visibly below it, which is what 0.89% tells you.
For a private brand, the practical playbook is to set a dollar number, not a percent. Pick your closest disclosing public peer by vertical, look at the dollar spend at the revenue scale just above yours, and translate down. A $25M supplement brand looking at USANA's $10.69M on $925M revenue can reasonably budget $250K to $400K a year on formulation and claim-substantiation work and be inside the right operational band even if it shows up as 1% to 1.6% of revenue rather than 1.16%.
On a 2025 Eightx founder call, Matt walked a client through the same arithmetic and landed at the working number Eightx uses across the portfolio: "the other one was R&D, so I put 1% of revenue on R&D." That sits below the public median (1.80%) because contract manufacturers absorb most formulation cost into COGS for private brands. A private brand that hits 1.0% to 1.5% R&D as a separately tracked line item is investing at roughly the same rate as a disclosing public peer, once you correct for the classification gap.
Why R&D dollars are stickier than R&D percent
The empirical pattern across the 13 disclosing companies: R&D dollars moved less than 5% year-over-year at most of them. P&G grew R&D 5% to a record $2.10B. Colgate roughly flat. Kenvue stepped down slightly as post-spin-off integration spend unwound. The clear material mover was Beyond Meat, down 17% as cash conservation kicked in.
The implication for private operators is mechanical. Public CPG treats R&D as fixed-ish overhead, not as a variable of revenue. The $2.1B P&G spends would be roughly $2.1B whether revenue lands at $82B or $86B in any given year because the lab footprint, scientist headcount, and clinical-trial commitments are sticky. That means R&D-as-percent-of-revenue moves mostly because the denominator moves, not because the numerator does. If revenue falls 5%, R&D percent rises 5%. The signal is largely an arithmetic artifact.
For a $10M to $50M private brand, the practical translation is to build R&D as an annual dollar budget tied to your reformulation cadence and new-SKU plan, not as a fixed percent of revenue. Three operator levers fit inside this: cost per SKU reformulation (typically $15K to $40K for a contract-manufacturer-led reformulation), new-SKU launch budget (target 2 to 4 launches per year at $25K to $75K each for a $10M to $25M brand), and regulatory or claim-substantiation work (highly category-dependent: trivial for apparel, six-figure for clean-ingredient supplements). Net those out at a target dollar number first, then back into the percent of revenue for board reporting.
Cross-vertical CPG R&D is broken as a benchmark and useful as a vertical-matched one. Hain at 0.33% and Beyond Meat at 8.43% are both correct numbers from real 10-Ks. The median (1.80%) is mathematically real and operationally misleading. Set your R&D budget as a dollar number first, anchor it to your closest disclosing public peer in the same vertical, and reverse-engineer the percent only for board reporting.
What this means for your business at $5M to $150M revenue
Three things to do this quarter.
Map your "real" R&D spend before benchmarking it. Pull your last 12 months of contract-manufacturer fees, formulation work, claim-substantiation testing, consumer research, and any new-SKU launch costs allocated to marketing. Total them. That dollar number is your real R&D, whether or not it sits on a separate line in your P&L. Most private DTC brands at $10M to $25M will land at $80K to $250K once they total honestly. Compare that to the dollar spend at your closest disclosing public peer, scaled to your revenue, before deciding whether you are under- or over-investing.
Pick your peer and lock it. For a supplement brand: USANA at 1.16%. For a clean-ingredient personal-care brand: Honest Company at 1.98%. For a better-for-you food brand: Simply Good Foods at 0.38%. For mass-market color cosmetics: e.l.f. (acknowledging the classification gap; assume 1.5% to 2.5% adjusted for the COGS shift). For prestige haircare: Olaplex (same caveat). For alt-protein: Beyond Meat at 8.43% (and recognize that's a category-structural number, not an aspirational one).
Budget R&D in dollars, then translate to percent. Pick a launch cadence (2 to 4 new SKUs a year for a $10M to $25M brand). Multiply by per-SKU formulation cost ($25K to $75K). Add reformulation work on existing SKUs ($15K to $40K each, twice a year). Add claim-substantiation if your positioning requires it ($30K to $150K depending on category). Sum to a dollar budget. Divide by revenue. That's your R&D percent, derived bottom-up. It will land between 0.5% and 3.0% for almost any private DTC or CPG brand, which lines up with where the public 10-Ks actually sit.
For the related read on how public-DTC P&L benchmarks line up by vertical, see our public DTC margin leaderboard and the P&G beauty gross-margin teardown. For the COGS half of the picture (which is where most private R&D actually hides), see the average CPG COGS as a percent of revenue by platform benchmark.
Sources and methodology
Primary source. SEC EDGAR 10-K filings, accessed 2026-06-01 via the SEC EDGAR API. For each named issuer, we pulled the consolidated income statement and extracted total revenue and the line tagged ResearchAndDevelopmentExpense for the three most recent fiscal years. R&D percent of revenue is computed as R&D expense divided by revenue, multiplied by 100. Most-recent FY ends range from June 30, 2025 (P&G, Clorox, Hain Celestial, Estée Lauder) through March 31, 2026 (e.l.f. Beauty). For each disclosed value we cross-checked against the company's own press release and earnings deck.
Companies pulled (17 total). PG, CL, ELF, HNST, VITL, BYND, KO, PEP, CHD, CLX, KVUE, EL, OLPX, BRBR, SMPL, HAIN, EPC, USNA. Of these, 13 disclose R&D as a separate income-statement line. 5 do not (KO, ELF, VITL, OLPX, EL, where Estée Lauder last separately disclosed an R&D line in FY2014 at approximately $158M).
Fiscal-year end variation. P&G, Clorox, Hain Celestial, and Estée Lauder use June fiscal year-ends. Edgewell, BellRing, and Simply Good Foods use August or September. e.l.f. Beauty uses March. USANA Health Sciences uses a 52/53-week year ending in early January. Coca-Cola, PepsiCo, Colgate, Kenvue, Church & Dwight, Clorox (calendar), Honest Company, Olaplex, and Beyond Meat use December calendar fiscal years. We use each company's most recently filed annual 10-K and label the FY end in the table.
Triangulation layer. We cross-referenced our public 10-K pulls against three external benchmark sources to confirm directional accuracy. Perplexity surfaced consumer-goods sector R&D intensity of 2% to 4% (NielsenIQ, PwC) and confirmed Beyond Meat 8.43% and Honest Company 1.98% from independent sources. NYU Stern's 2026 sector R&D tables (Damodaran) confirmed the 1% to 4% range for branded consumer-goods companies. Foundernest's enterprise innovation-budget benchmark put consumer-goods at 2% to 4% of revenue with retail-heavy models at 1% to 3%. Pinecone-indexed Matt-recorded founder calls (5,400+ calls across the Eightx portfolio) returned a 2025-01-19 segment with the working private-brand R&D assumption of 1% of revenue.
Limitations. This benchmark is a public-company snapshot. Private DTC and CPG brands at $5M to $150M revenue do not file 10-Ks, and the private-brand R&D number we cite (1% of revenue at $10M to $25M) is inferred from operator calls, not measured. Companies that bucket R&D under a different XBRL tag (for example, ResearchAndDevelopmentExpenseExcludingAcquiredInProcessCost) may have a marginally different headline number than what the consolidated income statement shows. The 5 non-disclosing brands almost certainly spend on product development; the absence of an R&D line is a classification choice, not a budget signal.
Update cadence. This index refreshes quarterly. Next pull target: late August 2026 (after the June 30 FY-end filers like P&G land their fiscal-year 10-Ks). We bump dateModified on the post and update the variableMeasured values inside the Dataset JSON-LD when we refresh.
Frequently asked questions
what is the average r&d as a percent of revenue for public cpg companies in 2026?
Across the 13 public consumer brands that disclose R&D as a separate income-statement line, the naive simple-mean R&D is 2.10% of revenue and the median is 1.80% (Colgate-Palmolive). The range runs from Hain Celestial at 0.33% to Beyond Meat at 8.43%. The simple mean is mathematically real but operationally misleading because the spread is 26x wide. It understates the typical HPC major and overstates the typical food and beverage major, so benchmark against your vertical, not the cross-vertical average.
how much should my private dtc brand spend on product development as a percent of revenue?
For a $5M to $50M private DTC or CPG brand, 0.5% to 3.0% of revenue is the realistic 2026 benchmark, depending on category. Most operators at $10M to $25M land near 1% because contract manufacturers absorb the bulk of formulation cost into per-unit COGS. Supplements and clean-claim positioning push higher (1.5% to 2.5%). Apparel and accessories push lower (under 0.5%). Set a dollar budget, not a percent.
why does beyond meat spend 8% of revenue on r&d when pepsi spends less than 1%?
Two reasons. Beyond Meat is a food-science company solving an ongoing reformulation problem (taste, texture, ingredient cost, plant-protein supply chain). PepsiCo is a category leader where the R&D job is incremental flavor and packaging work on a stable core. Add to that Beyond Meat's revenue base ($275M) being roughly 340x smaller than PepsiCo's ($93.9B), so the same absolute R&D dollar shows up at a much higher percent. Compare R&D dollars at similar revenue scale, not percent.
do e.l.f. beauty and vital farms actually do r&d or do they really spend zero?
They do R&D. They just do not disclose it as a separate income-statement line. e.l.f. runs an aggressive shade-and-formulation cadence with the spend allocated to COGS, marketing, or contract-manufacturer fees. Vital Farms invests in sourcing standards, packaging, and quality assurance, again booked outside a GAAP R&D line. The 10-K shows near-zero GAAP R&D because of classification, not because of zero spend. Treat absent R&D lines as a classification choice, not a budget signal.
where does r&d hide on the income statement if it's not a separate line?
Three places. Cost of revenue (formulation, ingredient testing, and packaging engineering booked as per-unit COGS at the contract manufacturer). Selling, general and administrative (consumer research, claims testing, and innovation-team salaries). And occasionally as a marketing line item for new-SKU launch work. The CFO read: if you see no R&D line, the spend has not disappeared. It has been re-classified into a bucket that does not look like innovation.
what's the right r&d benchmark for a $10m dtc supplement brand?
USANA Health Sciences at 1.16% of revenue is the closest disclosing public peer for supplements. For a $10M brand, that benchmarks to roughly $100K to $150K a year in product-development spend, weighted toward formulation work with your contract manufacturer plus claim-substantiation testing. The public-CPG cross-vertical median (1.80%) is too high for most private supplement P&Ls because the public number absorbs centralized clinical, regulatory, and lab overhead a private brand outsources.
is r&d as a percent of revenue a useful benchmark or is it broken?
It is broken as a single number and useful as a vertical-matched number. The naive cross-vertical simple mean of 2.10% is statistically real but operationally misleading because the spread is 26x wide. Inside a vertical, R&D percent is a useful sanity check (HPC majors should look like P&G or Colgate, food and beverage should look like PepsiCo or Simply Good Foods). The fix is to benchmark inside vertical, not across CPG broadly.
why is honest company's r&d % so high at almost 2% on $371m revenue?
Honest Company positions on clean ingredients and pediatric-safe formulation, which requires ongoing claims testing and ingredient substitution work that other personal-care brands at similar revenue would outsource into COGS. At $371M in revenue, the $7.35M R&D line is small in absolute dollars but unusually visible because Honest treats it as a positioning expense rather than burying it. Most $5M to $50M DTC brands with similar clean-claim positioning run a comparable percent if they classify the spend consistently.