
eCommerce
Average stock-out rate by ecommerce vertical: 2-5% healthy, 8% average, 10% on promo (2026 benchmarks)
A 2 to 5% stock-out rate is healthy. At 8% you are losing sales without realizing it. At 10% during a promo, you are paying for demand you cannot fulfill. Stock-outs compound: a customer who hits an out-of-stock once has a meaningfully lower repurchase rate. Track this weekly, not monthly, and set a hard ceiling before you plan your next promotion.
Key Takeaways
- The healthy DTC ecommerce target is 2-5% out-of-stock (95-98% in-stock). Anything north of 5% on your hero SKUs and you are leaving demand on the table.
- The all-retail global average stock-out rate is around 8%, rising to roughly 10% on promoted items. If you are running at the industry average on a $20M consumer-packaged-goods (CPG) or DTC brand, that is roughly $1.1M to $1.2M of revenue gated by inventory each year (after a 25% substitution recapture assumption), before any marketing lever moves.
- 51% of ecommerce SKUs experience at least one stock-out per year, with average duration of 35 days. A 500-SKU Shopify catalog typically sees roughly 255 SKUs out for five weeks each.
- IHL Group puts global retail losses from out-of-stocks at $1.157 trillion a year, or 67% of the $1.73T inventory-distortion total. Asia-Pacific alone accounts for $642 billion (37%) of the global distortion bill.
- In apparel, 52% of shoppers walk to a competitor when their item is out of stock, even when you offer a substitute. Back-in-stock notifications are the single highest-ROI recovery tool: 91% of shoppers will sign up if asked.
Stock-outs are the largest source of preventable revenue loss in ecommerce and consumer-packaged-goods (CPG), and almost no operator benchmarks their own rate against the public data. That is because the public data is fragmented across paid vendor reports (Cogsy, Cin7, Inventory Planner, NetSuite Brainyard, IHL Group) plus the older Gruen-Corsten academic audit. When you pull them together, three numbers anchor the conversation: 2-5% out-of-stock (OOS) is the healthy direct-to-consumer (DTC) and CPG target, 8% is the all-retail global average, and IHL Group's 2025 estimate puts global retail losses from stockouts alone at $1.157 trillion a year.
CPG categories (food and beverage, beauty and personal care, household and health) sit at the tightest end of the OOS-tolerance band because their economics are repeat-purchase and subscription-led: a missed refill cycle compounds across the customer lifetime, not just the lost order. The benchmark ladder and behavioral data below applies to both digitally-native DTC brands and CPG brands selling through Shopify, Amazon, and grocery omnichannel.
This page is the living index of the stock-out, fill-rate, and on-shelf availability (OSA) benchmarks operators should plan against in 2026. We refresh quarterly as IHL Group, Cogsy, Cin7, McKinsey, and the named-vendor reports publish updates.
The three numbers every operator should know: 2-5%, 8%, 10%
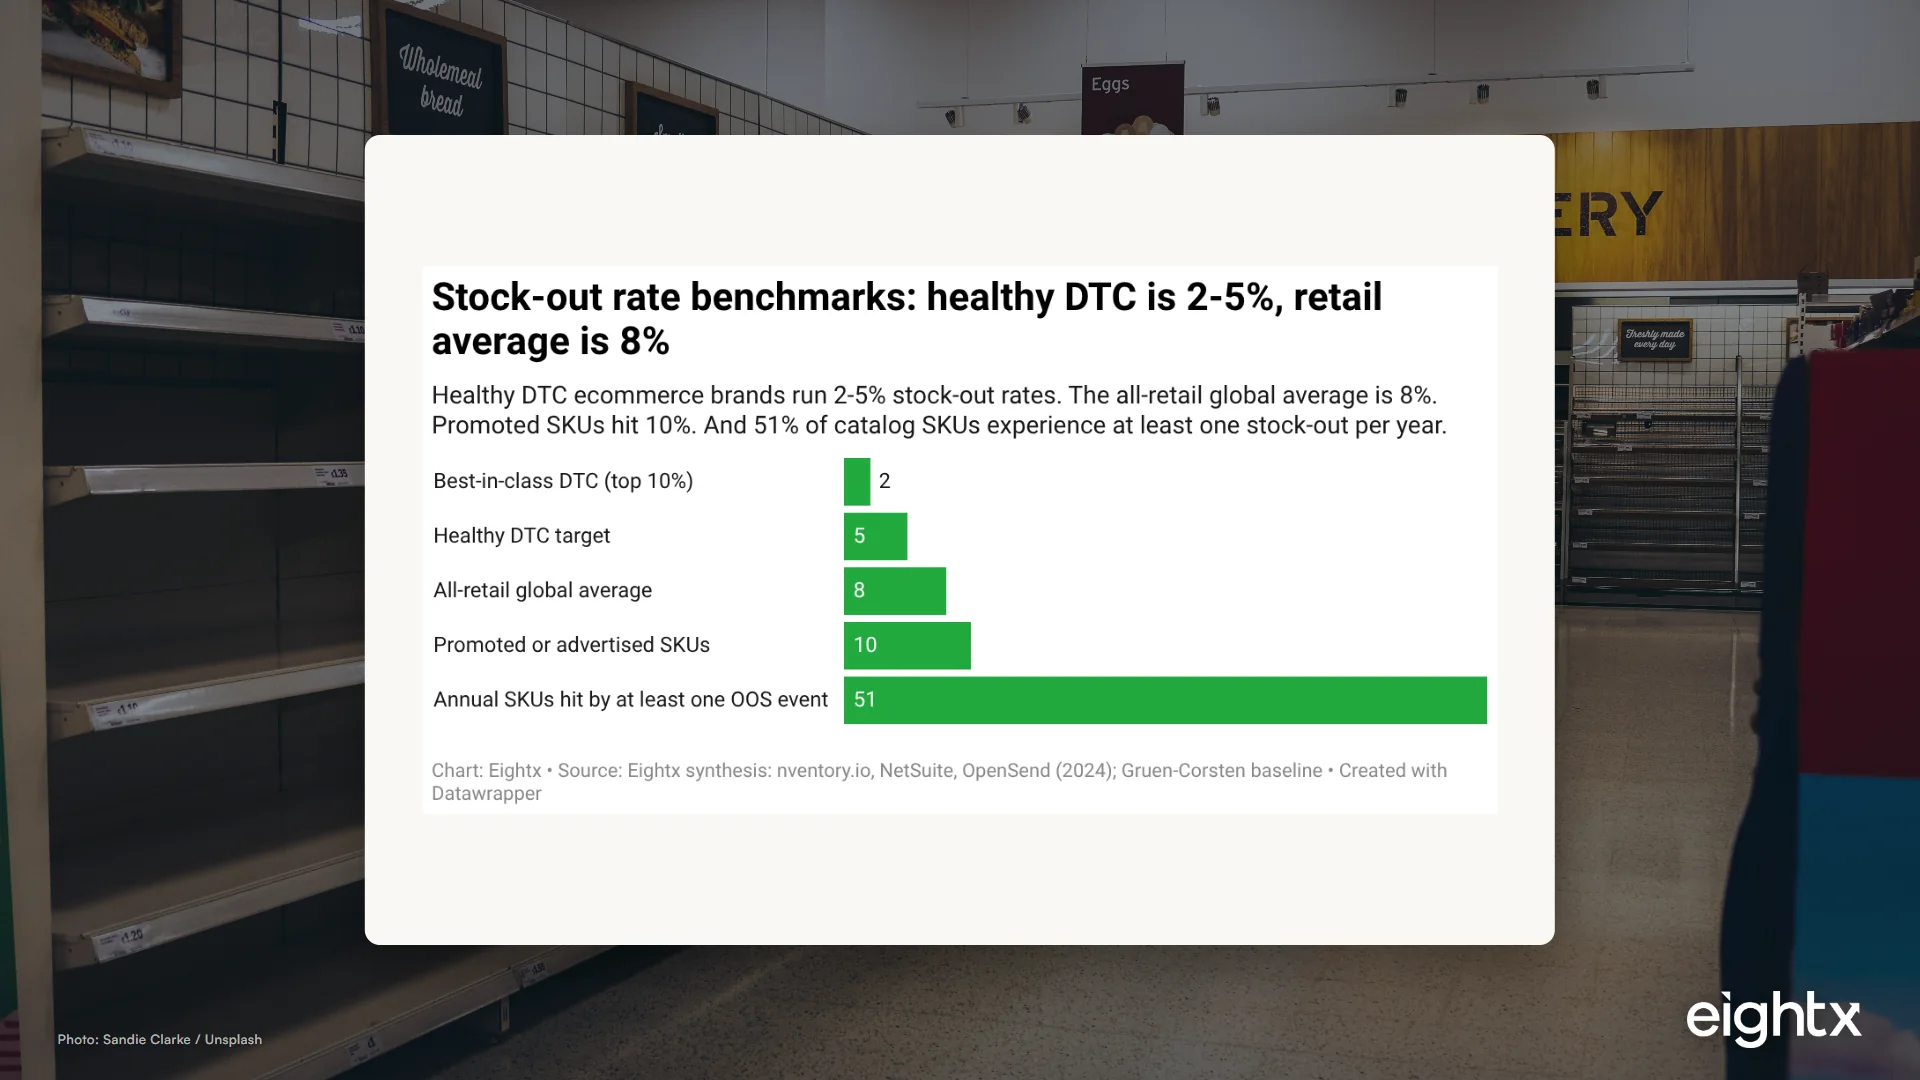
If you remember nothing else, remember the benchmark ladder. Top DTC brands sit at about 2% out-of-stock, the "healthy" target is 5%, the all-retail global average is 8%, and promoted or advertised SKUs run at roughly 10%. And 51% of all ecommerce SKUs experience at least one stock-out event in a given year, with average duration of about 35 days per event.
The 8% all-retail baseline traces back to the Gruen and Corsten academic audit of 540 stores across 32 categories in 9 countries, summarized in the NetSuite stockouts explainer. NetSuite confirms the same 8% number for the current period and notes the rate rises during promotional and sales events, which lines up with the 10% promoted-SKU figure synthesized by OpenSend in their 2024 industry meta-review.
For DTC specifically, the practical target is tighter than the broad-retail average. The nventory.io ecommerce inventory benchmark sets a 95-98% in-stock service level on A and B SKUs as the operational norm for healthy mid-market brands. That maps to 2-5% OOS in stock-out-rate language. Hit it on your core 20% of SKUs and the long-tail tolerance can stretch wider without much economic damage.
Benchmark Stock-out rate What it means Top DTC operators (top 10%) around 2% Hero SKUs almost always available; requires forecasting plus safety stock investment Healthy DTC and CPG target 2-5% 95-98% in-stock on A and B SKUs; the operator North Star All-retail global average around 8% Gruen-Corsten baseline; confirmed by NetSuite and OpenSend syntheses Promoted or advertised SKUs around 10% Demand spike outruns the safety-stock buffer; tier 1.5x on promo SKUs Annual SKU exposure 51% Share of all ecommerce SKUs hit by at least one OOS event in a year
How stock-out rate is calculated (and why your team's number probably is not comparable)
Three definitions of "in stock" are in common use, and they answer different questions. If you swap one for another mid-quarter, your trendline will look like a problem when it is just a measurement change.
The SKU-days method (days unavailable divided by total SKU-days in the period) is the easiest to pull from a Shopify or NetSuite inventory log. It treats every SKU equally, which is a flaw: a zero-velocity SKU contributes the same as a hero. Order-line fill rate is the operational fulfillment metric. It tracks the share of order lines shipped complete on first attempt, which misses demand that never converted into an order because the customer saw "sold out" and bounced.
The most accurate definition for demand impact is session-weighted in-stock rate: the share of sessions where the requested SKU was available, weighted by demand. It tells you what shoppers actually experienced. The catch is most Shopify brands do not have session-level inventory logging wired in, so the rate gets estimated from a sample.
On-shelf availability (OSA) is the retail-store and Amazon-buy-box equivalent. Consultants including McKinsey typically cite 95-97% OSA on A and B SKUs as the realistic top-tier target in omnichannel retail, including grocery and fashion (consistent with McKinsey's State of Fashion 2026 inventory framing).
Metric Formula What it tells you Common pitfall Stock-out rate (SKU-days) SKU-days unavailable / total SKU-days Share of catalog unavailable at any moment Does not weight by demand Order-line fill rate Order lines shipped complete on first ship / total order lines Operational ability to fulfill what was promised Misses lost demand (orders that never placed) In-stock rate (session-weighted) Sessions where SKU available / total sessions where SKU requested Customer experience truth Requires session-level inventory logging On-shelf availability (OSA) Percent of promised SKUs available at the time of visit Retail-store or Amazon-buy-box equivalent of in-stock Originally a brick-and-mortar metric Promoted-SKU stock-out rate Stock-out rate on SKUs in active promotion Demand-spike preparedness Industry baseline is around 10% vs. 8% all-SKU
Vertical context: apparel vs. CPG (beauty, food and beverage) vs. home vs. electronics
Here is the honest read on vertical-specific stock-out rates: the named-vendor benchmark reports (Cogsy, Cin7, Inventory Planner, NetSuite Brainyard) do not publish cross-merchant percent-OOS numbers by vertical in any publicly accessible PDF as of May 2026. Cin7's 2025 State of Inventory Intelligence Report surveyed 530 inventory professionals across 7 countries and confirmed that 55% cite operational costs as their biggest challenge, but the survey did not break out stock-out percent by vertical in the public summary.
So the only defensible vertical view is the public-data proxy: inventory turnover and days-sales-of-inventory (DSI) by vertical, which is derivable from public 10-K filings of category-leader retailers. Turnover is the upper bound on how tight a vertical's stock-out rate can feasibly run, because faster turns force more frequent replenishment cycles.
Vertical Typical turns per year Days sales of inventory (DSI) Implied stock-out exposure Apparel and fashion 4-6 (fast fashion 6-10) 61-91 days High. Long cover means slower replenishment cycles. Electronics and consumer tech 8-12 (pure-play 10-15) 30-46 days Moderate. Short cover but high SKU-count complexity. Beauty and personal care 6-10 (subscription 10-15) 37-61 days Low to moderate. Subscription cadence smooths demand. Food and beverage ecommerce 15-30+ (shelf-stable 12-20) 12-24 days Lowest. Short cover forces frequent replenishment. General merchandise 6-9 41-61 days Moderate Home and furniture (estimated) 3-5 73-122 days Highest. Long cover plus long lead times. Health and supplements (estimated) 6-10 37-61 days Low to moderate. Subscription tail similar to beauty.
The economic stack matters too. Beauty runs about 69% gross margin, apparel about 62%, and food and beverage about 63% (Polar Analytics 2026 vertical benchmarks). The higher the gross margin and customer acquisition cost (CAC), the more expensive each stock-out is. That is why CPG brands in beauty and food and beverage (which lean heavily on subscription and replenishment) routinely push stock-out targets tighter than the broad 5% line: a missed refill order can erode lifetime value (LTV) for years, not just one order. The triangulation research supports working CPG benchmarks of roughly 2-4% blended for beauty and 1-3% for food and beverage subscription SKUs, vs. 3-6% for apparel.
The cost in dollars: IHL Group's $1.157 trillion out-of-stock estimate
IHL Group's September 2025 report is the most-cited industry number for the cost of retail inventory problems. The headline: $1.73 trillion in annual retail inventory distortion globally. That breaks into $1.157 trillion from out-of-stocks (67%) and $572 billion from overstocks (33%). Asia-Pacific alone accounts for $642 billion (37%) of the global bill, with the food and grocery segment showing the largest year-over-year improvement (43.5% better on inventory accuracy).
The $1.73T number works out to roughly 6.5% of global retail sales. Put another way, the average retailer is leaking about 4% of revenue to out-of-stocks and another 2% to overstock markdowns. That is consistent with the older Gruen-Corsten audit (4% annual revenue impact) and with a 2025 inventory-guide synthesis citing the same 4% global benchmark. Mirakl's HBR-sourced view goes further, finding retailers lose nearly half of intended purchases when a specific product is unavailable, with about 20% of all online cart abandons attributable to stockouts.
To translate it to your brand: at an industry-average 8% OOS rate with a working assumption of 25-30% substitution recapture (a writer judgment for DTC, not a sourced benchmark), a $20M Shopify or CPG brand is leaking around $1.1M to $1.2M annually. A $50M brand running the same rate loses $2.8M to $3.0M. Those numbers are uncomfortably close to what most operators in that revenue band budget for paid acquisition over the same period.
Stock-outs are the single biggest preventable revenue leak in ecommerce, and the gap between the healthy DTC and CPG target (2-5%) and the all-retail average (8%) is where the money sits. If you cut your OOS rate in half on your top 20% of SKUs, you typically recover more profit in 90 days than any single paid-media optimization can deliver in a year.
Consumer behavior at stockout: the 52% competitor walkaway
The demand-side data on what shoppers actually do at stockout is sharpest in apparel, thanks to the Cogsy / Lucidworks 800-consumer survey. The headline numbers:
- 57% of shoppers say their desired item is "almost never in stock"
- 85% have at least one item type they refuse to substitute on (shoes, jeans, intimates)
- 91% will sign up for a back-in-stock notification if the brand offers one
- 76% will buy an alternative product when offered a substitute at stockout
- But 69% of those who buy an alternative buy it from a competitor
The compounded math is brutal. Multiply 0.76 by 0.69 and you get 52%: the share of apparel shoppers who walk to a competitor on stockout even when you offer a substitute.
Shopper behavior at stockout (apparel) Share of shoppers Say their desired item is "almost never in stock" 57% Have at least one item they refuse to substitute (shoes, jeans, intimates) 85% Will sign up for back-in-stock notification when offered 91% Will buy an alternative product when offered a substitute 76% Of those who buy an alternative, buy it from a competitor 69% Net: walk to a competitor on apparel stockout (0.76 times 0.69) 52% Convert via back-in-stock notification when item returns 5-15% Share of apparel brands that recommend substitutes at stockout 70%
The recoverable demand is where most operators leave money on the table. Back-in-stock notification adoption is the single highest-ROI software fix: 91% of shoppers will sign up if offered, and typical conversion when the SKU returns runs 5-15% of subscribers. That is roughly 8-12% of otherwise-lost revenue clawed back automatically.
Three operator decisions sit on top of this data:
- Audit your true OOS rate this week. Pull SKU-days unavailable for the last 90 days and segment by A, B, and C SKU class. Anything north of the 2-5% healthy band on A SKUs is the highest-priority fix.
- Install back-in-stock notifications if you do not have them. Klaviyo, Back in Stock, and Restock Rocket all do this. 8-12% revenue recovery on an 80-hour install is the best ROI in the inventory stack.
- Tier safety stock 1.5x on promoted SKUs. Promo days drive OOS rates to 10% precisely because the safety-stock buffer was sized for baseline demand. Stretch it.
For the upstream forecasting question (how to actually set safety-stock policy), see our 2026 DTC demand stress read and the related inventory turnover benchmarks by vertical.
Sources and methodology
IHL Group, "Retail Inventory Crisis Persists Despite $172 Billion in Improvements" (September 2025). The headline $1.157 trillion stock-out figure (and the $1.73T total inventory-distortion estimate) comes from IHL Group's annual model. The underlying methodology is proprietary, but the figures are repeatedly cited by Chain Store Age, Retail Dive, and Board.com, and align directionally with the HBR-cited "nearly $1 trillion" stockout estimate and the older Gruen-Corsten 4% annual-revenue-loss baseline.
Gruen, Corsten, and Bharadwaj (early 2000s), "Retail Out-of-Stocks: A Worldwide Examination." The academic origin of the 8% retail OOS baseline. 540 stores across 32 categories and 9 countries, roughly 41,000 item-store observations. Mostly brick-and-mortar grocery and mass-retail. Summarized in the current NetSuite stockouts explainer, which confirms the same baseline applies in the current period and rises on sale or promotion events.
nventory.io Inventory Turnover Benchmarks for Ecommerce (2024). Source of the 95-98% in-stock target for healthy DTC brands and the turns and DSI ranges by vertical. Derived from public ecommerce financial filings; sample size not disclosed.
Cogsy, "The True Cost of an Apparel Stockout" (citing the Lucidworks 800-consumer survey). Source of the apparel-specific shopper-behavior cascade (76% substitute, 69% buy-from-competitor, 91% notification sign-up). N is 800 consumers, apparel-only. Behavior in beauty, food, and electronics likely differs and is not in the public Cogsy data.
OpenSend, "29 Inventory Stock-out Rate Statistics for eCommerce Stores" (2024). Meta-review of ecommerce stock-out literature. Confirms the 8% baseline, 10% promoted-SKU rate, 51% annual SKU exposure, and 35-day average stockout duration. We note OpenSend's $1.2T global lost-sales figure is the stockout-only number, while IHL's $1.73T is the broader inventory-distortion total (OOS plus overstock); the two figures are reconcilable and not in conflict.
Polar Analytics, ecommerce vertical benchmarks (2026). Source of the cross-vertical gross margin figures: beauty around 69%, apparel around 62%, food and beverage around 63%. Used to weight the economic cost of a stock-out by category. URL: polaranalytics.com/ecommerce-benchmarks.
Mirakl, "Out-of-Stocks: An Ecommerce Inventory Management Problem" (citing Harvard Business Review). Source of the "retailers lose nearly half of intended purchases when a product is unavailable" and "about 20% of online cart abandonments are stockout-attributable" claims. These are HBR-originated figures surfaced in Mirakl's industry write-up. URL: mirakl.com/blog/out-of-stocks-ecommerce-inventory-management-problem.
McKinsey, State of Fashion 2026 and NRF 2026 inventory commentary. Source of the 95-97% OSA top-tier target framing for A and B SKUs in omnichannel retail. McKinsey does not publish a single numeric OOS benchmark for 2026; the figure cited is the firm's consistent long-running framing across omnichannel and fashion-supply-chain pieces. URL: mckinsey.com/industries/retail.
Limitations. Vertical-specific stock-out percentages (apparel X%, beauty Y%, food and beverage Z%) are not publicly available in any source we found with disclosed sample size and methodology. Cin7's 2025 State of Inventory Intelligence Report (N is 530 inventory professionals across 7 countries) is the largest recent survey, but the public summary does not break out percent-OOS by vertical. We use turnover and DSI by vertical (which IS public via 10-K filings) as the proxy. The apparel behavioral data comes from a Cogsy / Lucidworks survey and applies to apparel only.
Update cadence. This page is refreshed quarterly. Next refresh: Q3 2026 after IHL Group publishes their 2026 inventory-distortion update (typically September).
Frequently asked questions
what is a good stockout rate for an ecommerce brand?
Healthy direct-to-consumer (DTC) and consumer-packaged-goods (CPG) brands run a 2-5% stock-out rate, which is the same thing as 95-98% in-stock. Top operators push that down to around 2% on core SKUs. The all-retail global average sits at roughly 8%, so anything below that is above-average performance.
how is stock-out rate actually calculated?
Three definitions are in common use. SKU-days unavailable divided by total SKU-days is the easiest to pull from Shopify. Order-line fill rate measures shipped-complete on first attempt and reflects fulfillment execution. Session-weighted in-stock rate measures what shoppers actually saw and is the closest to true demand impact. Pick one definition and stick with it across quarters.
how much revenue do i lose to stockouts each year if i run at the industry average?
Rough math: annual_revenue times your stock-out rate times (1 minus your substitution recapture rate). At a $20M DTC or CPG brand running 8% OOS with a working assumption of 25% substitution recapture, that is $20M times 0.08 times 0.75, or about $1.2M of annual revenue gated by inventory before any marketing or CRO lever moves.
what percent of shoppers actually leave for a competitor when an item is out of stock?
In apparel specifically, 76% of shoppers will buy a substitute when offered one, but 69% of those buy from a competitor. The net walkaway rate is roughly 52%. Behavior differs by vertical: beauty subscriptions are stickier (lower walkaway) and food and beverage shoppers substitute more readily within the same brand.
why does ihl group say the retail industry is losing $1.7 trillion to inventory distortion?
IHL Group's September 2025 estimate splits $1.73T into $1.157T from out-of-stocks (67%) and $572B from overstocks (33%). Asia-Pacific is the largest regional share at $642B of the total inventory-distortion bill (OOS plus overstock combined), not OOS alone. The model is proprietary but the figure is repeatedly cited by Chain Store Age, Retail Dive, and HBR and aligns directionally with the older Gruen-Corsten retail audit baseline of around 8% OOS.
is shopify's out of stock rate different from amazon fba stranded inventory?
Yes. Shopify out-of-stock is a demand-side metric (the SKU is unavailable to buy). Amazon FBA stranded inventory is the opposite problem: the unit physically sits in a fulfillment center but is delisted or unsellable. Amazon-seller rule of thumb is to keep stockout time under 2% on primary SKUs and stranded inventory under roughly 10% of stored units.
what's a realistic stockout rate for a $10m to $50m dtc brand on shopify?
Target 2-5% overall and under 2-3% on your core or hero SKUs. Mid-market DTC and CPG brands typically run at 6-9% blended once tail SKUs are included, which is normal. Where it stops being normal is when your top 20% of revenue SKUs spend more than 5% of days unavailable: that is where the dollar leak compounds fast.
how do back in stock notifications change the stockout math?
91% of shoppers will sign up for a back-in-stock alert if it is offered. Typical conversion rate when the SKU returns is 5-15% of subscribers. Net effect: a notification list can recover 8-12% of the revenue you would have lost outright on a stockout, which is the single highest-ROI software fix in the demand-recovery stack.