
Insights
Inventory management for D2C brands: the working capital, frameworks, and cash playbook (2026)
Key Takeaways
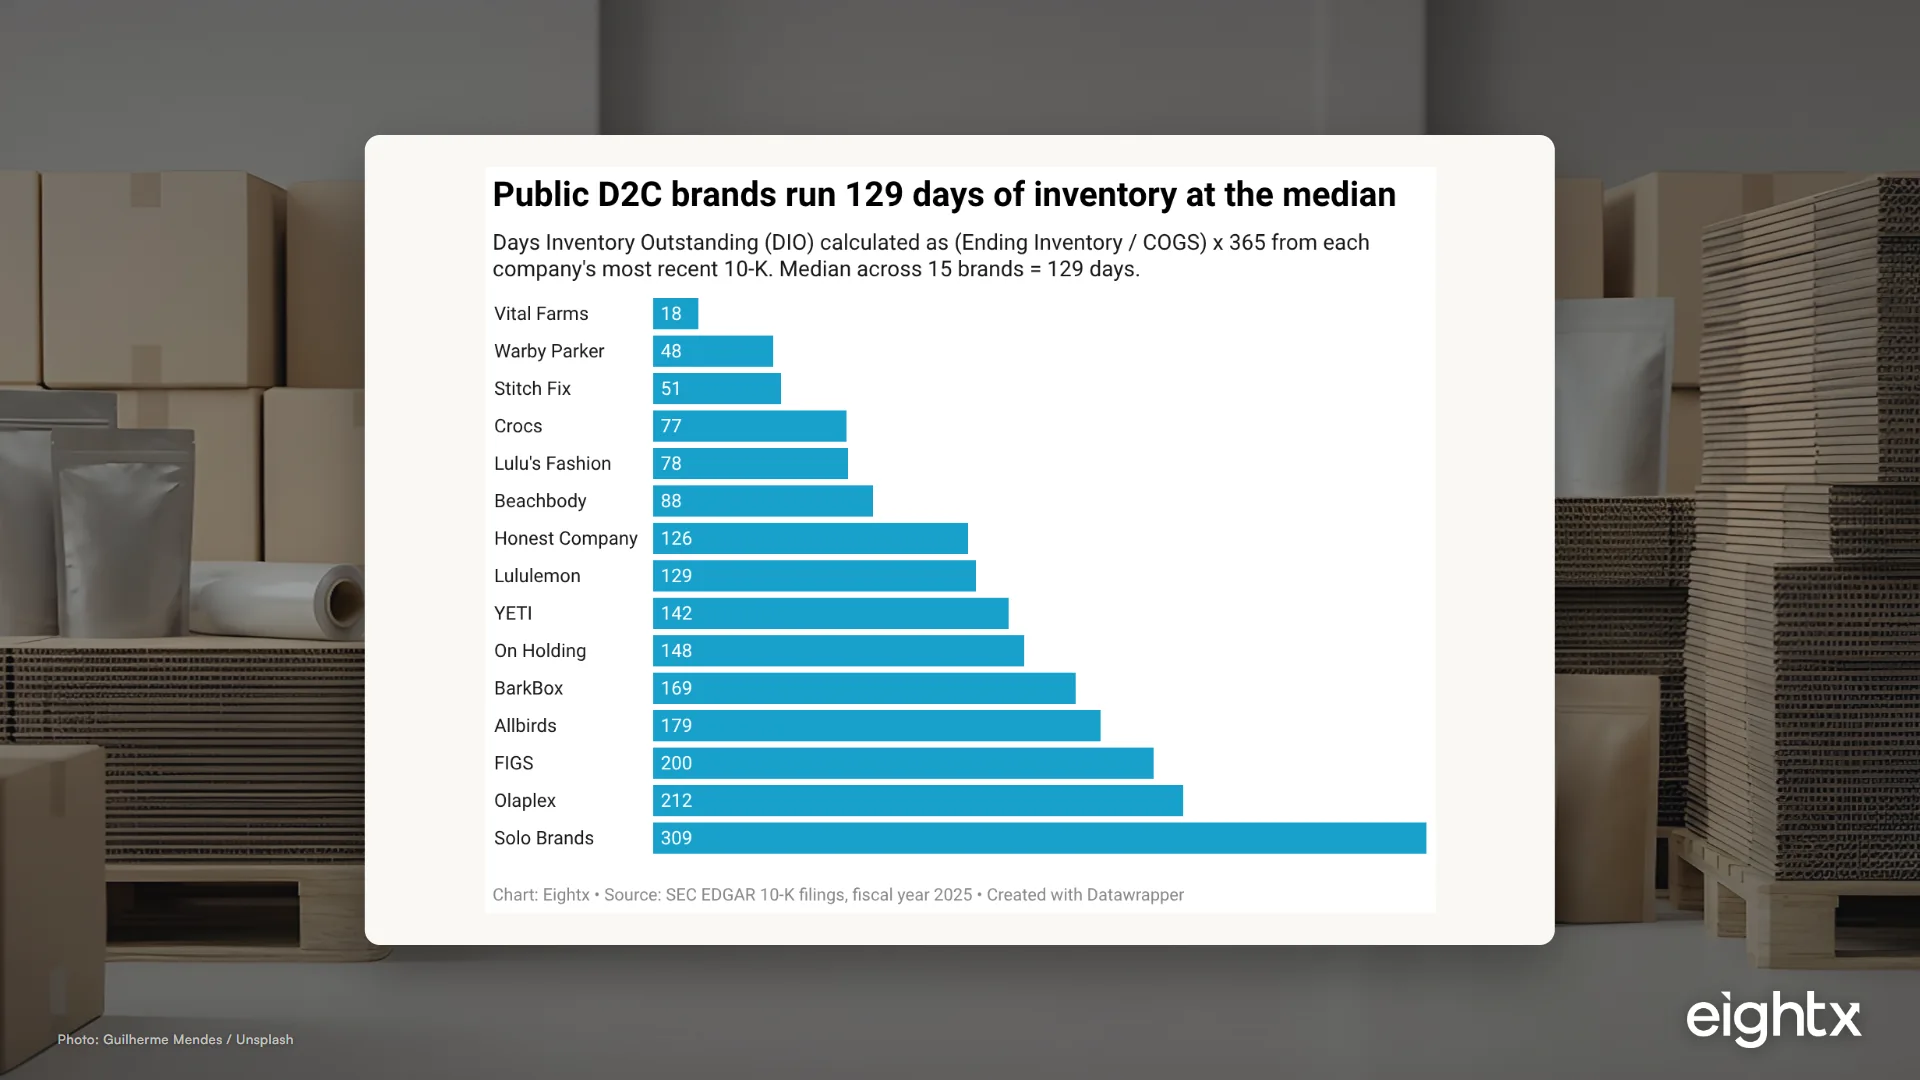
- Public D2C brands carry a median of 129 days of inventory (DIO). Best quartile is under 78 days (Vital Farms, Warby Parker, Stitch Fix, Crocs). Worst quartile is 179+ days (Allbirds, FIGS, Olaplex, Solo Brands). Median Gross Margin Return on Inventory (GMROI) is $3.58 of gross profit per $1 of average inventory.
- Every 30 days of DIO improvement releases about 8% of annual COGS in cash and saves about 2 points of revenue in annual carrying cost. On a $20M D2C brand at 2026 capital costs (prime 6.75%, inventory-loan APR ~11.75%), moving from 200-day to 129-day DIO frees up roughly $1.96M of trapped cash and saves ~$490K/yr in carry.
- The frameworks that actually pull weight in D2C are Pareto, ABC, XYZ, and the ABC-XYZ 9-cell matrix. Bain, McKinsey, BCG, APICS, Newsvendor, and EOQ are useful as vocabulary but rarely run from scratch by operators. Tools like Inventory Planner and Cogsy implement reorder-point + safety stock under the hood, and that is what runs the day-to-day reorders.
- Tool picks should track revenue band, not feature parity. Below $5M: Shopify native plus Cogsy or Inventory Planner. $5-20M: add Cin7 Core. $20-50M: Cin7 Omni or Unleashed plus Flieber. $50-100M: NetSuite or Acumatica plus Streamline. $100M+: ToolsGroup, RELEX, or Anaplan.
- Inventory accounting is where margin quietly bleeds. ASC 330 writedowns cannot be reversed. IAS 2 can. Dead-stock policy needs aging thresholds (180 / 365 days), markdown cascades (30% / 50% / 70%), and monthly reserves of 4-8% on mixed catalogues. The trap is hiding writedowns inside COGS for a year, then dumping a $400K to $600K hit in one quarter.
The fastest way to find $1M of working capital inside a $20M direct-to-consumer (D2C) brand is rarely a new ad strategy. It is sitting in the warehouse. Across 15 public D2C and consumer brands we pulled from the U.S. Securities and Exchange Commission (SEC) EDGAR system for fiscal year 2025, the median brand carries 129 days of inventory and earns $3.58 of gross profit per $1 of average inventory. The best quartile runs under 78 days. The worst quartile runs 180 to 309 days. At 2026 capital costs (bank prime 6.75%, inventory-loan APR around 11.75%), every 30 days off Days Inventory Outstanding (DIO) releases about 8% of annual cost of goods sold (COGS) back to the balance sheet and saves around 2 points of revenue in annual carrying cost. That is the headline. The rest of this guide is the math, the frameworks, the tool picks by revenue band, the accounting that quietly bleeds margin, the financing options, and the moves we see actually work across the Eightx D2C portfolio.
Part 1: The economic frame (working capital, margin, cash)
Inventory is a cash conversation in operations costume. Before any framework, get the four numbers any CFO would test you on. They are not optional.
The four metrics
Days Inventory Outstanding (DIO) = (Ending Inventory / COGS) x 365. How many days of cost of goods sold are sitting on your balance sheet right now. Lower is better, with caveats for category.
Inventory turns = COGS / Average Inventory. How many times per year you rotate the stock. Turns is just 365 / DIO restated. Pick one and stick with it.
Gross Margin Return on Inventory Investment (GMROI) = Gross Profit / Average Inventory. For every $1 sitting in inventory, how many $ of gross profit does it generate. Above $3 is healthy. Above $5 is strong. Below $2 is a red flag.
Cash Conversion Cycle (CCC) = DIO + DSO (Days Sales Outstanding) - DPO (Days Payable Outstanding). For most D2C, DSO is near zero (Shopify and Amazon settle within days), DPO sits around 30 to 45 days, so CCC is mostly DIO minus the supplier float. Under 60 days is healthy.
DIO = (Ending inventory / COGS) × 365. Turns = 365 / DIO. Target 60–120 days for most D2C; the public median is 129.
GMROI = Gross profit / Average inventory. Above $3 is healthy, above $5 is strong, below $2 is a red flag. Panel median is $3.58.
CCC = DIO + DSO − DPO. Under 60 days is healthy for D2C. Inventory is almost always the dominant lever because DSO sits near zero.
What good looks like in 2026
We pulled the most recent 10-K (or 20-F for On Holding, which files in IFRS) for 15 public D2C and consumer brands. The numbers below are fiscal year 2025 closing balances against trailing 12-month COGS, calculated consistently across the panel.
Ticker Company DIO (days) Inventory turns GMROI Inventory % of assets VITL Vital Farms 18 16.71 $10.10 7% WRBY Warby Parker 48 7.00 $8.21 8% SFIX Stitch Fix 51 6.16 $4.93 20% CROX Crocs 77 4.54 $6.36 7% LVLU Lulus Fashion 78 4.62 $3.52 31% BODI Beachbody 88 3.30 $8.94 9% HNST Honest Company 126 2.90 $1.45 34% LULU Lululemon 129 3.06 $4.00 20% YETI YETI 142 2.46 $3.32 24% ONON On Holding 148 2.47 $4.49 11% BARK BarkBox 169 1.76 $3.58 28% BIRD Allbirds 179 1.77 $1.23 23% FIGS FIGS 200 1.80 $3.58 23% OLPX Olaplex 212 1.51 $3.43 4% DTC Solo Brands 309 1.18 $1.73 22%
The pattern. Food and beverage (VITL at 18 days) wins on DIO because perishables force discipline. Eyewear (WRBY at 48 days) wins on durables thanks to vertical integration and made-to-order Rx lenses. Apparel clusters between 50 and 200 days. Specialty hard goods (BARK, YETI, DTC) and beauty (OLPX) cluster at 140 to 310 days because of long Asian lead times and style-cycle risk. Solo Brands at 309 days is the cautionary tale: Solo Stove fire pits with massive overhang post-2022 peak.
The destock cycle since 2022
The current 129-day median is the result of a brutal two-year destock. Across the 14 brands with comparable 2022-2024 inventory data, the median brand cut inventory 30%. Allbirds cut 62%. Beachbody cut 70%. Stitch Fix cut 50%. Only Lululemon held inventory roughly flat (which is itself a signal of clean demand and efficient buying). The post-COVID Just-in-Case (JIC) overshoot is unwound. Brands sitting on JIC inventory today are structurally over-inventoried versus the market.
The macro view confirms it. The U.S. retail inventory-to-sales ratio (FRED RETAILIRSA) sat at 1.45 to 1.50 from 2016 to 2019, spiked to 1.68 in April 2020, troughed at 1.19 in early 2022, and recovered to 1.26 in March 2026. That is still 13% leaner than pre-COVID norms. Retail as a whole is running lean. D2C brands carrying 180+ DIO in 2026 are operating against the macro.
Carrying cost: the full stack
Most D2C operators underestimate carrying cost because they only count the capital piece. The full stack is closer to 25% per year of average inventory.
| Component | Typical % per year |
|---|---|
| Capital cost (cost of cash tied up) | 8 to 12% |
| Storage (3PL or self-op warehouse) | 4 to 8% |
| Insurance | 0.5 to 1.5% |
| Obsolescence and shrinkage reserve | 4 to 8% |
| Opportunity cost (foregone ad spend or debt paydown) | 2 to 5% |
| All-in carrying cost | ~25% |
Industry standard for the full carrying cost is 20 to 30%. We use 25% as the working benchmark below. If your category is fashion or beauty (LTO and short lifecycles), use the high end. If your category is supplements or evergreen CPG, use the low end.
Worked examples at $5M, $20M, and $50M revenue
Using public-D2C median gross margin of 49% (so COGS = 51% of revenue) and 2026 capital costs (bank prime 6.75% + 5 percentage point inventory financing spread = 11.75% APR), the carrying-cost numbers fall out like this. All-in carry is the 25% number.
Case A: $5M revenue D2C brand
| Metric | Best quartile (50 DIO) | Median (129 DIO) | Worst quartile (200 DIO) |
|---|---|---|---|
| Annual COGS | $2.55M | $2.55M | $2.55M |
| Inventory tied up | $349K | $901K | $1.40M |
| Capital cost at 11.75% | $41K | $106K | $164K |
| All-in carry at 25% | $87K | $225K | $349K |
| Carry as % of revenue | 1.7% | 4.5% | 7.0% |
At $5M, the median brand is bleeding $225K/yr to carry inventory. That is typically the entire owner's draw. Going from 129 days to 50 days frees up $552K of cash and saves $138K/yr in carry. Payback on a low-five-figure IMS + implementation investment (Eightx implementation observations across $5M-tier clients) is under six months.
Case B: $20M revenue D2C brand
| Metric | Best quartile (50 DIO) | Median (129 DIO) | Worst quartile (200 DIO) |
|---|---|---|---|
| Annual COGS | $10.2M | $10.2M | $10.2M |
| Inventory tied up | $1.40M | $3.60M | $5.59M |
| Capital cost at 11.75% | $164K | $423K | $657K |
| All-in carry at 25% | $349K | $901K | $1.40M |
| Carry as % of revenue | 1.7% | 4.5% | 7.0% |
At $20M, the gap between worst-quartile and best-quartile is $4.19M of trapped cash and roughly $1.05M/yr of carry savings. That is the difference between fundable and unfundable on a $3M growth-capital raise. Bring DIO down and the brand self-funds growth.
Case C: $50M revenue D2C brand
| Metric | Best quartile (50 DIO) | Median (129 DIO) | Worst quartile (200 DIO) |
|---|---|---|---|
| Annual COGS | $25.5M | $25.5M | $25.5M |
| Inventory tied up | $3.49M | $9.01M | $13.97M |
| Capital cost at 11.75% | $410K | $1.06M | $1.64M |
| All-in carry at 25% | $873K | $2.25M | $3.49M |
| Carry as % of revenue | 1.7% | 4.5% | 7.0% |
At $50M, the worst-quartile case is carrying $14M of inventory. On a healthy D2C at 8 to 10% EBITDA margin, that is 3.5x EBITDA. The brand effectively is its warehouse. Moving from 200-day to 129-day DIO releases $5M of working capital.
The Eightx working-capital headline
Across the three cases, every 30 days of DIO improvement releases about 8.2% of annual COGS in cash and saves about 2% of revenue in annual carry. A CFO can present it exactly this way to the board:
Every 30 days off DIO equals two points of revenue back to the bottom line, and another quarter-turn of cash freed up to redeploy.
That is the lens. Now the frameworks.
Part 2: Classification frameworks (the compendium)
The published frameworks for inventory classification are dense. We tested 12 of them against what our portfolio operators actually run. Four (Pareto, ABC, XYZ, ABC-XYZ) pull weight in the body of the playbook. The rest are useful as vocabulary, as board-level framing, or for specific edge cases. We are honest about which is which.
2.1 Pareto principle and the whale curve
Vilfredo Pareto observed in 1896 that 80% of Italian wealth sat with 20% of the population. Joseph Juran coined the "vital few and trivial many" framing in mid-20th-century quality management. The Lorenz curve (Max Lorenz, 1905) is the visual companion: cumulative share of profit on the y-axis, cumulative share of SKUs on the x-axis. Sorted descending, this is the "whale curve" of modern SKU analytics.
The rule. Roughly 20% of SKUs produce 80% of revenue. The exact ratio varies, 90/10 in extreme tail businesses, 60/40 in narrow-catalogue brands. The diagnostic value is the humpback. When the cumulative profit curve climbs above 100% and sinks back, the tail is destroying profit after fully-loaded fulfillment, returns, and carry.
D2C application. In a 200 to 5,000 SKU Shopify catalogue, 15 to 25% of SKUs typically produce 80 to 90% of contribution margin. The bottom 30 to 50% of SKUs frequently sit at break-even or negative after fully-loaded fulfillment cost (pick and pack labor, parcel surcharge, returns). The whale curve drives assortment rationalization, hero-SKU marketing prioritization, and the "kill list" for SKU cuts.
When it works. Quarterly SKU review. Pre-cataloging an Amazon launch. Pre-merchandising a new fulfillment node.
When it breaks. Brands with strong bundle or subscription dynamics, where the "C" SKU is the loss-leader funneling AOV. Launch ramps (new SKUs always look "C"). Seasonal styles that look weak on annualized data.
Named example. Allbirds 2022-2024: extension SKUs (Tree Flyer running shoe, merino apparel, performance lines) accumulated as the long tail of the whale curve. Post-IPO, the SKU rationalization cut performance and apparel back to the lifestyle core. Cumulative loss $419M on $1.24B revenue over five years.
2.2 ABC analysis (Dickie, 1951)
H. Ford Dickie, materials manager at General Electric, formally described ABC analysis in 1951, explicitly citing Pareto and the Lorenz curve. Objective: focus managerial attention on the critical few.
Formula. For SKU i, annual usage value V_i = q_i x c_i (units x unit cost, or substitute revenue or gross profit). Sort descending, compute cumulative share, bucket: A = 0 to 80% cumulative (~10 to 20% of SKUs), B = 80 to 95% (next 20 to 30%), C = 95 to 100% (remaining 50 to 70%). Thresholds are policy choices, not theoretical constants.
D2C application. Modern D2C runs multi-dimensional ABC: separate stratifications on (a) revenue, (b) gross-profit dollars, (c) order velocity and pick frequency, (d) inventory value on hand. The matrix surfaces "high-margin slow movers" (good for content and email) vs. "low-margin fast movers" (good for paid acquisition). Decision rules differ per tier. A SKUs get weekly cycle counts, priority forecast attention, premium safety stock. B SKUs get monthly cycle counts and standard policies. C SKUs get annual counts and bulk replenishment or drop-ship.
Best parts. Industry standard since 1951. Embedded in every IMS (Inventory Management System) from NetSuite to Cogsy. Easy to teach.
Worst parts. Static snapshot, ignores demand volatility (a stable C can be safer than a volatile A). Reclassification cadence is often wrong, leaving SKUs misclassified for full cycles.
When it breaks. Pure new-product brands (everything is unrated). Seasonal-fashion brands where annualized buckets miss the in-season shape.
2.3 XYZ analysis (CV-based)
XYZ emerged in European inventory-management practice as the variability complement to ABC. It is the operational application of the coefficient of variation (CV = standard deviation / mean) to demand time series.
Formula. For SKU i with demand series d over T periods, compute mean d-bar and standard deviation s, then CV = s / d-bar. Common D2C-applicable buckets: X = CV under 0.20 to 0.25 (stable), Y = 0.20 to 0.50 (moderate, seasonal), Z = over 0.50 (erratic, spiky, intermittent). The right cutoff calibrates to the brand's demand shape.
D2C application. D2C demand is structurally more variable than retail or wholesale because of direct paid-media and creator-driven spikes. XYZ on weekly SKU demand surfaces (a) steady replenishment items that suit auto-reorder, (b) seasonal Y items needing pre-season build, (c) Z viral or launch items that should run on responsive supply or pre-order. CV directly drives safety-stock multipliers. Z items need higher Z-scores in the safety stock formula even at the same target service level.
Best parts. Decoupled from value. Tells you forecastability, which is what actually drives buffer cost. Excel-implementable.
Worst parts. CV is sensitive to zeros (intermittent demand) and outliers (one influencer spike skews everything). Requires 12+ months of clean demand history.
When it breaks. New SKUs (under 12 weeks of history). Sparse intermittent demand (use Croston's method instead).
2.4 ABC-XYZ 9-cell matrix (the workhorse)
Cross the ABC value axis with the XYZ variability axis. The result is a 3x3 = 9-cell policy matrix. Each cell gets its own service level, safety-stock multiplier, replenishment cadence, and assortment treatment.
X (stable) Y (moderate) Z (erratic) A (high value) AX: hero SKUs. Lean SS, continuous review, 99%+ service. Auto-reorder. AY: seasonal bestsellers. Pre-build for peaks, moderate-high SS, S&OP review. AZ: viral/launch hits. High SS or responsive supply, consider pre-order or MTO. Most expensive to get wrong. B (medium value) BX: standard continuous review, moderate SS. BY: periodic review, seasonal forecasting. BZ: flexible ordering, higher SS, careful monitoring. C (low value) CX: bulk orders, low-attention, simple policy. CY: periodic review, minimal effort. CZ: drop-ship, MTO, or discontinue. Classic dead-stock candidate.
This is the workhorse. Inventory Planner, Cogsy, Flieber, and Streamline all surface ABC-XYZ-like views. The highest-impact cell to manage is AZ (high revenue, high variability), because that is where viral upside collides with stockout penalty. The cell to cut is CZ. Every CZ SKU you stock is dead-stock risk with no upside protection.
Worst parts. 9-cell matrix has 9 policies to maintain (operational overhead). Threshold sensitivity (SKUs on the border flicker classification quarterly). Doesn't capture lifecycle stage explicitly.
When it breaks. Brands with under 100 SKUs (too few to populate 9 cells meaningfully). Pure-launch portfolios. Subscription-bundle SKUs where the unit of decision is the bundle.
2.5 Bain and Company inventory frameworks
Bain treats inventory primarily through the working-capital diagnostic and the supply-chain-resilience lens. The closest thing to a published Bain inventory framework is "Ten ways to improve your inventory management" (Bain Insights, via WSJ), which frames inventory as a ten-question diagnostic testing whether a company can break inventory into safety, replenishment, and excess-obsolete buckets and whether actions are linked to each bucket.
Synthesised Bain framework. (1) Categorize: safety stock vs. replenishment stock vs. excess and obsolete. (2) Diagnose: what % of inventory is in each bucket, and is each bucket sized to a stated rule. (3) Act: every bucket has an owner and a tied action (safety = service-level review, replenishment = forecast and lead-time review, excess = liquidation and writedown calendar). (4) Sustain: monthly governance, cash conversion cycle as the KPI.
D2C application. The Bain 10-question diagnostic is genuinely useful for $20M to $100M D2C operators because it forces the safety / replenishment / excess split, a split most D2C brands have not actually computed. Apply it as a quarterly board-pack page.
Best parts. Action-linked. CFO-credible framing. Anchors inventory inside working-capital strategy.
Worst parts. Generic, not D2C-tailored. Light on SKU math and forecasting methodology. Bain's published bench is shallower on inventory tooling than McKinsey's.
When it breaks. Pure operational decisions (which forecasting model, what safety-stock multiplier). The Bain frame is strategic, not tactical.
2.6 McKinsey: inventory health map and Supply Chain 4.0
McKinsey has the most published bench in inventory optimization, anchored on Supply Chain 4.0 (digital, AI, autonomous planning) and the "inventory health map" framework. Key published references include "Supply Chain 4.0: the next-generation digital supply chain," "Supply Chain 4.0 in consumer goods," "How medtech companies can create value via inventory optimization" (where the inventory health map first appears in published form), and "Autonomous supply chain planning for consumer goods companies."
Synthesised McKinsey framework. (1) Inventory health map: visualize every SKU x node combination, flag excess vs. deficit. (2) Segmentation: combine ABC, XYZ, lifecycle stage, strategic role. (3) Differentiated policies: by segment, set service level, replenishment cadence, network placement. (4) Digital enablement: AI and ML demand sensing, autonomous replanning, integrated S&OP. (5) Governance: cross-functional council, monthly cadence.
D2C application. The inventory health map is the single most useful artifact for multi-node D2C (FBA + 3PL + retail). Most brands do not have a single dashboard showing inventory by SKU x node x age. Build it in Looker or Sheets before buying enterprise multi-echelon inventory optimization (MEIO) software.
Best parts. Methodologically deep. Tool-agnostic. Strong on the digital and autonomous side.
Worst parts. Written for $500M+ enterprises. Overengineered for $5M to $20M D2C. The Supply Chain 4.0 tooling stack (Kinaxis, o9, ToolsGroup) is enterprise-priced.
When to use. $50M+ D2C with multi-node fulfillment and an internal data team.
2.7 BCG: portfolio matrix applied to SKUs
BCG's inventory work descends from the Growth-Share Matrix (Bruce Henderson, 1970). Stars, Cash Cows, Question Marks, Dogs. The same portfolio logic applies to SKU portfolios.
SKU-portfolio mapping. Stars = AX/AY (high-value, growing, defend with high service). Cash Cows = BX/BY (milk for working-capital efficiency). Question Marks = AZ (high-value but volatile, invest selectively, watch closely). Dogs = CZ (divest, drop-ship, or kill).
When to use. Board or investor narrative around SKU portfolio. Forces capital-allocation discipline.
When it breaks. Operational reorder decisions. BCG language doesn't drive PO math.
2.8 APICS / CSCMP standards (CPIM + SCOR)
APICS founded 1957, CPIM (Certified in Production and Inventory Management) certification launched 1973, APICS merged into ASCM in 2018. CSCMP (Council of Supply Chain Management Professionals) is the parallel body. SCOR (Supply Chain Operations Reference) model standardizes the supply chain into six Level-1 processes: Plan, Source, Make, Deliver, Return, Enable.
Core formulas codified in CPIM. EOQ Q* = sqrt(2DS/H). Reorder point ROP = d x L (+ SS for stochastic demand). Safety stock SS = Z x sigma_L for normal demand during lead time. Inventory turns = COGS / Average Inventory. Days on hand = 365 / Turns.
D2C application. Use SCOR's six-process map to audit the D2C chain: Plan (forecast), Source (factories), Make (manufacturing or P2P), Deliver (3PL + parcel), Return (reverse logistics, huge in D2C apparel), Enable (data and governance). Use CPIM math at the operational layer.
When to use. Hiring planners. Building S&OP. Implementing an ERP. Documenting process for due diligence.
When it breaks. Small D2C teams without dedicated planners. The CPIM stack is overkill below $20M revenue.
2.9 Theory of Constraints (Goldratt, 1984)
Eliyahu Goldratt's The Goal (1984, with Jeff Cox) is the foundational text. Core concepts. (a) Every system has a constraint (bottleneck) limiting throughput. (b) Five Focusing Steps: Identify, Exploit, Subordinate, Elevate, Repeat. (c) Throughput accounting: Throughput (T) = sales-generated money; Inventory (I) = money tied up; Operating Expense (OE) = money spent converting I to T. Rule: maximize T, minimize I and OE. (d) Drum-Buffer-Rope (DBR): Drum = constraint's pace, Buffer = inventory or time protecting the constraint, Rope = release signal synchronizing upstream work. (e) Dynamic Buffer Management (DBM): buffer monitored in green/yellow/red zones, adjust up or down by ~1/3 based on penetration frequency.
D2C application. The D2C constraint is rarely manufacturing. It is inbound supply (factory MOQs, overseas lead times) or peak fulfillment capacity (Black Friday pick and pack). DBR logic identifies the constraint, buffers the SKUs that protect it, and releases upstream POs only on the buffer signal. DBM is essentially automated dynamic safety stock. Modern IMS like Cogsy and Flieber implement DBM logic under different names.
When it breaks. Pure capital-allocation questions (TOC's "throughput dollar" lens is not the same as gross-margin-dollar). Brands where the constraint shifts week-to-week (early-stage D2C).
2.10 Lean and Just-in-Time (Toyota, 1948-1975)
Toyota Production System developed by Taiichi Ohno and Shigeo Shingo. Three pillars: Jidoka (autonomation), Just-in-Time (pull, not push), Kaizen (continuous improvement). Eliminates muda (waste), mura (unevenness), muri (overburden).
D2C application. Pure JIT rarely fits D2C finished goods (you can't reorder a Vietnam container in 3 days). But Lean principles apply: pull replenishment between fulfillment center and supplier where lead times allow (domestic CPG, US-made apparel), Kanban-style FC-to-3PL replenishment for high-velocity SKUs, cross-docking at FC for predictable AX SKUs, waste elimination in pick and pack and returns.
When it breaks. Overseas-sourced D2C with 90 to 120 day lead times. Highly seasonal brands. Brands whose marketing spikes (creator collabs, PR moments) outpace any pull system's reaction time.
2.11 Just-in-Case (the COVID rebound)
Not a formally codified method. JIC is the descriptive antonym of JIT. The term gained currency in 2020 to 2022 as COVID broke single-source global JIT chains. Operationalized via higher target service levels (98 to 99.5%), multi-sourcing (two qualified suppliers per critical SKU), nearshoring, longer contracts, redundant fulfillment capacity.
D2C application. 2020 to 2021 saw mass D2C JIC adoption. Allbirds, FIGS, Solo Stove, Beachbody all over-ordered into the COVID demand bump on JIC reasoning. 2022 to 2024 was the unwind: demand normalized, JIC inventory remained, writedowns followed. Best practice is selective JIC: JIC for critical-path SKUs and long-lead overseas, JIT-ish for short-lead and predictable.
Named example. Solo Brands at 309 days DIO is the JIC overhang. Allbirds wrote off $30.3M in 2023 and $9.1M in 2024 against discontinued styles. FIGS flagged the balance between availability and overstock as growth slowed.
When it breaks. Across the whole catalogue. JIC for everything is the pattern that created the 2022-2024 writedown wave.
2.12 Newsvendor model (Edgeworth, 1888)
Earliest precursor: Francis Edgeworth, 1888. Modern critical-fractile formulation: Arrow, Harris and Marschak, 1951.
Formula. For a single-period stocking decision with stochastic demand D, underage cost C_u (lost margin per unit short), and overage cost C_o (carry or disposal per unit excess), optimal stocking quantity Q* = F^-1(C_u / (C_u + C_o)) where F^-1 is the inverse cumulative distribution function of demand.
D2C application. The right model for any one-shot stocking decision: holiday capsule, creator collab drop, limited-edition SKU, end-of-life SKU final order. Compute C_u (lost gross margin per stockout) and C_o (markdown cost or writeoff net of salvage), then stock to the critical quantile of the demand forecast distribution.
When it breaks. Anything continuously replenishable. Brands with terrible demand forecasts (the model is only as good as F).
Cross-framework synthesis: when each wins
| Decision context | Best framework |
|---|---|
| First-pass SKU classification | Pareto + ABC |
| Differentiated stocking policies | ABC-XYZ 9-cell |
| Board-level working-capital narrative | Bain 10-question + BCG portfolio |
| Multi-node placement at $50M+ | McKinsey inventory health map + MEIO software |
| Hiring, S&OP, ERP rollout | APICS CPIM + SCOR |
| Persistent bottleneck constraint | TOC, Drum-Buffer-Rope, Dynamic Buffer Management |
| Domestic short-lead-time ops | Lean, JIT principles |
| Post-disruption resilience review | Selective JIC for critical SKUs |
| One-shot drops, capsules, end-of-life | Newsvendor |
| Steady CPG replenishment, single SKU | EOQ (cautiously) |
| Ongoing replenishment decisions | Reorder point + safety stock, (R,Q) or (T,S) policies |
The honest read for Shopify operators
Across 30+ Eightx founder calls in the last 90 days, none cited Bain, McKinsey, BCG, APICS, or Goldratt by name. Operators run an informal version of Pareto and ABC. They use JIC as a posture decision and JIT as a vocabulary. They trust their IMS to handle XYZ and reorder point under the hood. The pillar above teaches the full vocabulary because it is genuinely useful, but be honest about adoption: in the wild it is informal, tool-mediated, and gut-driven more than formal-9-cell.
Part 3: Reorder and stocking math
The math that runs your day-to-day reorders.
3.1 EOQ (Harris, 1913)
Ford Whitman Harris, 1913, "How Many Parts to Make at Once," Factory magazine. The first published derivation of the order-quantity trade-off between ordering cost and holding cost.
Formula. Q = sqrt(2DS / H). D = annual demand (units), S = order or setup cost per order (admin + freight allocation), H = annual holding cost per unit (capital + storage + insurance + obsolescence + shrink). Total annual cost TC(Q) = (D/Q)S + (Q/2)H is minimized at Q.
D2C reality. EOQ is conceptually useful but rarely used in pure form for D2C finished goods. Demand is not deterministic. Order cost is not the binding constraint (factory MOQs and container economics are). Holding cost is hard to compute correctly (most brands underestimate the carrying cost stack at 20 to 30% per year). Lead time is non-trivial and stochastic. Use EOQ as a teaching frame. Don't bet your reorder cadence on it.
EOQ = √(2DS / H). A teaching frame, not a reorder rule — sanity-check it against your factory MOQ and container economics before ordering.
3.2 Reorder point with safety stock
The math every IMS implements. Reorder Point (ROP) = mu_LT + SS, where mu_LT = mean demand during lead time. Safety stock SS = Z x sigma_LT. If demand has standard deviation sigma per period and lead time is constant L, then sigma_LT = sigma x sqrt(L), so SS = Z x sigma x sqrt(L). Z is the standard-normal quantile for the cycle service level (Z = 1.65 for 95%, Z = 2.33 for 99%).
Worked example. AX SKU with mean weekly demand 200 units, weekly standard deviation 40 units, 4-week lead time, 99% service level. mu_LT = 200 x 4 = 800. sigma_LT = 40 x sqrt(4) = 80. SS = 2.33 x 80 = 186. ROP = 800 + 186 = 986 units. When stock hits 986, place the next PO. See our deeper explainer at what is safety stock and reorder point.
ROP = (demand × lead time) + Z × σ × √(lead time). Use 99% (Z = 2.33) on hero SKUs, 95% (Z = 1.65) on the rest.
3.3 (s,S), (R,Q), and (T,S) policy comparison
| Policy | Mechanic | Pros | Cons | D2C fit |
|---|---|---|---|---|
| (s,S) | Order when inventory position is at or below s; order up to S. Variable order quantity. | Handles intermittent demand. Avoids tiny frequent orders. | Tuning two parameters. Variable PO sizes complicate supplier relationships. | Mid. Useful for B and C SKUs with lumpy demand. |
| (R,Q) | Continuous review; when inventory at or below R, order fixed quantity Q. | Simple, responsive, widely supported by IMS. | Fixed Q can clash with supplier MOQ or case-pack. | High. Most D2C IMS implement this. |
| (T,S) | Review every T periods; order up to S. Fixed cadence, variable quantity. | Easy to coordinate with weekly or biweekly supplier schedules. Low monitoring burden. | Less responsive between reviews. Needs more SS to maintain same service level. | High. Fits weekly S&OP rhythms. |
Most D2C brands run a hybrid: (R,Q) for AX and AY hero SKUs (auto-PO when ROP is hit), (T,S) for the rest (weekly buyer pass). (s,S) gets used selectively for C-tier intermittent items.
3.4 Forecasting methods comparison
| Horizon and context | Recommended method | Why |
|---|---|---|
| Short-term, stable SKU, weekly | Holt-Winters or auto.arima | Strong on stable seasonal series; lightweight |
| Daily brand-level with seasonality and holidays | Prophet (Meta) | Handles missing data, multiple seasonalities, holiday regressors |
| Promotion or price-lift estimation | Gradient boosting (XGBoost, LightGBM) | Captures non-linearities and exogenous drivers |
| Long-range complex multi-driver | LSTM, seq2seq | Captures long-range patterns with enough data |
| Sparse intermittent demand | Croston's method | Specialized for many-zero series |
For D2C up to $50M, Holt-Winters and Prophet are usually enough. ML wins on M5-style competitions with rich exogenous features (price, promo, calendar) but the data-engineering cost is hard to justify below $50M.
3.5 The bullwhip effect
Jay Forrester first described it in 1961. Lee, Padmanabhan and Whang (1997) gave it the canonical modern treatment with the four rational causes: (1) demand forecast updating, (2) order batching, (3) price fluctuations, (4) rationing and shortage gaming.
D2C symptoms. Social-media-driven forecast revisions causing swings in PO quantities to overseas factories. Container MOQs aggregating continuous Shopify orders into 30 to 90-day batches. Flash sales and Black Friday peaks not pre-built into supplier plans, causing erratic upstream orders. Multi-channel allocation gaming when D2C, Amazon, and wholesale compete for constrained supply.
Mitigation. Share point-of-sale data with manufacturers. Increase PO frequency where possible. Use everyday-low pricing on core hero SKUs. Reduce lead times via nearshoring or postponement.
Part 4: Accounting and the P&L impact
This is where margin quietly bleeds. Skip this section and you will write down $400K to $600K in one quarter that should have been recognised monthly.
4.1 LIFO vs FIFO vs WAC
| Method | US GAAP | IFRS (IAS 2) | D2C fit |
|---|---|---|---|
| FIFO | Yes | Yes | Best when SKU traceability, batch and lot tracking, expiry, or trend and seasonal margin matter (beauty, fashion, food) |
| Weighted Average Cost (WAC) | Yes | Yes | Best for broad-catalogue D2C. Simpler to administer, smooths margin volatility. The default for most $5M to $50M D2C |
| LIFO | Yes | No (banned under IFRS) | Rarely a fit for D2C |
Default to WAC for D2C unless you have a specific reason to use FIFO (beauty expiry, fashion seasonality, lot tracking compliance). Avoid LIFO. Changing method later requires Form 3115 for U.S. tax purposes (meaningful friction).
4.2 Lower of Cost or Net Realizable Value (ASC 330 vs IAS 2)
The single most important divergence between US GAAP and IFRS for inventory.
US GAAP (ASC 330): measure inventory at the lower of cost and net realizable value (NRV = expected selling price minus completion costs minus disposal and selling costs). Writedowns are recognised in earnings in the period of the decline. Once written down, inventory cannot be written back up if NRV recovers.
IFRS (IAS 2): same lower of cost or NRV principle. Reversal IS allowed when NRV recovers, capped at the amount of the original writedown. Worked example: cost $100, NRV drops to $80 (writedown $20), NRV recovers to $95. IFRS allows a reversal of $15. US GAAP keeps it at $80.
ASC 330 disclosure requirements. Inventory measurement method (FIFO, WAC, standard cost). Nature and reason for material writedowns (obsolescence, markdown risk, demand decline). Carrying amount plus material reserves. If standard cost is used, how it approximates actual cost. Material inventory risk factors in MD&A.
4.3 Dead stock writedown policy template
Copy this and adapt to your category. Operators will thank you.
| Age | Action |
|---|---|
| 0 to 180 days | Normal sell-through management; weekly SKU and collection review |
| 181 to 365 days | Aging review; require markdown plan, bundles, paid-media suppression, liquidation readiness |
| 365+ days | Classify as high-risk obsolete; move to liquidation OR full write-off |
| Damaged, expired, recalled, contaminated | Immediate write-off regardless of age |
Decision rules. If expected liquidation recovery exceeds liquidation cost, route to liquidation before writeoff. If NRV is under carrying value, revalue downward and reserve or write off the difference. If liquidation is not commercially viable, approve full writeoff.
Approval matrix. Category manager initiates aged-inventory review. Finance calculates reserve, markdown impact, writeoff entries. Operations confirms physical counts and condition. CFO or controller approves writeoff or liquidation above materiality threshold.
Monthly process. (1) SKU aging report by cohort, collection, channel. (2) Flag items with zero sales in 90 days and no forecasted demand. (3) Document condition, seasonality, recovery options. (4) Assign disposition: continue, markdown, bundle, liquidate, donate, write off.
4.4 Markdown cascade math
| Stage | Discount | When |
|---|---|---|
| Initial markdown | 30% off | Style needs momentum but demand exists |
| Second markdown | 50% off | Inventory remains; conversion still weak |
| Final markdown | 70%+ off | End-of-season clearance, last-chance sell-through |
| Liquidation channel | 80 to 95% off cost recovery | If still unsold after final markdown |
| Write-off | Not applicable | No viable resale path |
Markdown if the item can still be sold profitably (or at break-even cost recovery). Write off if obsolete, damaged, lost, or with no reasonable path to sale.
4.5 Slow-mover reserves and shrinkage benchmarks
| Risk profile | Obsolescence reserve | Annual writedown as % of COGS |
|---|---|---|
| Low (basics, supplements, evergreen) | 3 to 5% of inventory value | 0.5 to 1.0% of COGS |
| Mid (consumer goods, mixed catalogue) | 4 to 8% of inventory value | 1.0 to 2.0% of COGS |
| High (apparel, fashion, beauty LTO, seasonal) | 8 to 15% of inventory value | 2.0 to 5.0% of COGS |
D2C shrinkage target is under 1% of inventory value (vs. broader retail target of under 2%). Industry estimates put U.S. retail shrink at roughly $112B by 2026 (per icape.io industry estimate; NRF's last published figure was $94.5B in 2021). Starting reserve for D2C with strong controls is 0.5 to 1.0% of inventory value. D2C with mixed 3PL footprint or high-touch returns can run 1.5 to 2.5%.
4.6 The reported-vs-recoverable gap
A D2C brand reporting $5M of inventory on the balance sheet is often carrying $1M to $1.5M of unrecoverable inventory once you net out slow-mover obsolescence reserve (4 to 8%), shrink reserve (0.5 to 1.5%), NRV markdown exposure on aged SKUs (5 to 15% depending on aging), and returns-in-transit that have not been graded yet (1 to 3%). When reviewing inventory on the balance sheet, demand the aging report alongside it. Headline inventory value lies if the policy is conservative on reserves and aggressive on age.
Part 5: Financing inventory
The CFO's biggest near-term decision. Most operators undercapitalise inventory and overpay for short-term financing because they treat the loan as growth fuel instead of insurance.
5.1 The financing landscape
| Vendor / facility | Product | 2026 pricing | Deal size | Fit |
|---|---|---|---|---|
| Settle | Bill pay + inventory financing | ~17% APR on 7-month deals (third-party example) | $20K to $15M | CPG and D2C; no personal guarantee, no dilution. Best for supplier-payment-led inventory builds |
| Wayflyer | Revenue-based financing, term loan, rolling | Fixed fee 2 to 8% (~20% annualised typical) | Up to ~£20M revenue band | D2C and Amazon brands under ~£20M revenue |
| Kickfurther | Crowdfunded inventory financing (pay-on-sell-through) | Monthly subscription tied to annual revenue (new 2026 model) | Up to 100% of inventory cost | CPG-first; sell-through risk sits with capital |
| 8fig | Growth Plan eCommerce working capital | Built-in fee; typical $6K to $10K remit per $100K funded | Plan-based | Amazon and Shopify operators |
| Choco Up | Revenue-based financing | One-time flat fee; pricing not publicly disclosed | $10K to $10M USD | APAC and global D2C |
| Bank revolver / LOC | Traditional bank line | SOFR + 2 to 5%; all-in 5.6 to 8.7% | Brand-by-brand | Brand has clean financials and a real borrowing base |
| Inventory-backed lending (ABL) | Stock-secured | SOFR + 3 to 8%; all-in 6.6 to 11.7% | Brand-by-brand | Stock is the main asset; brand growing through inventory |
| AR financing / factoring | Receivables-secured | SOFR + 4 to 10%; all-in 7.6 to 13.7% | Brand-by-brand | D2C with thin bank support, fast receivables growth (more B2B-coded) |
Hidden costs to model. Unused-line fees. Field exams. Borrowing-base reserves. Minimum usage fees. Advance-rate haircuts. These can move effective APR by 100 to 300 basis points (bps).
For a deeper comparison of the two most-discussed vendors with D2C, see Settle vs Wayflyer.
5.2 Cost-of-capital math: when financed inventory beats equity
The decision rule. Debt beats dilution when ROIC (Return on Invested Capital) on the inventory build exceeds after-tax debt cost plus an operating risk buffer. Stated for operators: incremental gross profit from the next $1 of inventory must exceed financing cost plus inventory risk cost.
Worked example. A $20M D2C brand at 60% gross margin needs $1M of Q4 inventory. Options.
- Debt at 11% APR (Settle or inventory-backed): carry cost over a 6-month sell-through is roughly $55K. If inventory turns at 60% GM and sells through cleanly, incremental gross profit is $600K. Net contribution after financing is approximately $545K.
- Equity at 20% implied cost (a 5x revenue exit lens): $1M raised at $20M post = 5% dilution. On a future $100M exit, that is $5M of opportunity cost.
Conclusion. Below ~15% APR on inventory-backed debt, debt almost always wins for D2C brands with predictable turn. Above 20% APR (some revenue-based deals when fully loaded), the math gets close to equity for slow-turn or fashion-risk inventory. Caveat: in higher-rate environments, both debt cost and equity hurdle rise. What matters is the spread between them, not the headline rate. And debt that pushes the balance sheet into covenant or liquidity risk territory can become more expensive than dilution in expected-loss terms.
5.3 Negotiating supplier terms
Net 30, 60, 90 terms are real B2B language. They are mostly fiction for first-time orders with Asian factories.
| Stage | Common terms |
|---|---|
| First order, new supplier, custom tooling | 30% deposit / 70% balance before shipment, OR 20% deposit / 50% after QC / 30% after delivery |
| Repeat order, 6+ months of trust | 20% deposit / 80% on shipment, or LC at sight |
| Established 12+ month relationship | Net 30 from shipment date; rare but reachable |
| Long-tenured strategic supplier | Net 60 (rare); only with volume guarantees |
Negotiation moves. Smaller deposit with more milestones (20% deposit, 50% after production and QC, 30% on delivery) is more attainable than pure Net 60 on first orders. Trading company or sourcing agent intermediation can effectively get you to Net 30 because the agent floats the float. Order frequency over order size: smaller, more frequent POs improve CCC dramatically vs. one big PO per quarter.
Part 6: Tools landscape
The single most-asked question in our CFO calls: which tool stack at which revenue band. Answer below.
6.1 IMS apps (Shopify-attached, $1M to $50M band)
| Tool | Starting price | Use case | Revenue band |
|---|---|---|---|
| Inventory Planner (by Sage) | ~$249.99/mo | Demand forecasting, replenishment, multi-location | $1M to $50M Shopify |
| Cogsy | $199/mo flat | Demand planning, replenishment, multi-location, subscription | $1M to $25M Shopify-first D2C |
| Flieber | ~$299 to $599/mo | Multi-channel demand planning (Amazon + Shopify + Walmart + 3PL) | $5M to $100M multi-channel |
| Stocky (Shopify) | Bundled with POS Pro | Sunset 31 Aug 2026 (do not recommend for new builds) | n/a |
| Streamline (mid-tier) | $100 to $500/mo | AI demand forecast, ERP-connected replenishment | $5M to $100M distributors and manufacturers |
| Sumtracker | Free to install, usage-based | Multi-store inventory sync | $0 to $10M Shopify-first |
For a deeper comparison of the two most-discussed Shopify forecasting apps, see Inventory Planner vs Cogsy.
6.2 Inventory-led ERPs ($20M to $100M+)
| ERP | 2026 pricing signal | Revenue band | Notes |
|---|---|---|---|
| Cin7 Core | $349 / $599 / $999 per month | $5M to $25M | Best Shopify ERP entry point |
| Cin7 Omni | One pricing edition, quote-based | $25M to $100M | Cloud ERP-grade, WMS-capable |
| Unleashed | Add-ons public ($149 each), base quote-based | $5M to $50M | Cleanest published add-on pricing; AU/NZ stronghold |
| Brightpearl (by Sage) | Quote-only, scaled by order volume | $20M to $100M+ omni-retail | "Retail OS" positioning |
| NetSuite | ~$999/mo base + $99 to $199 per user | $25M to $1B+ | Default for $50M+; inventory + pricing automation depth |
| Acumatica | ~$7K/yr (Essentials) to ~$40K/yr (Prime) | $10M to $100M | Best per-user economics for high-user counts |
| SAP Business One | Quote-only | $5M to $50M | Strong inventory features for inventory-heavy SMBs |
For a deeper comparison of Cin7 and Unleashed (the two most common at the $5M to $50M crossover), see Cin7 vs Unleashed.
6.3 Enterprise forecasting (above the ERP)
| Tool | Pricing | Best fit |
|---|---|---|
| ToolsGroup | Quote-based, enterprise norm | $100M+ supply chains, CPG, manufacturing |
| RELEX Solutions | Quote-based | $250M+ retail, wholesale, manufacturing |
| GMDH Streamline (enterprise) | Quote-based | $50M+ ERP-connected operations |
| Anaplan Supply | ~$30K to $50K/yr entry, $150K+ enterprise | $100M+ multi-function enterprises |
6.4 Tool-stack decision tree by revenue band
| Revenue band | IMS / Forecast | ERP / Backbone | WMS | Typical stack monthly cost |
|---|---|---|---|---|
| $1 to 5M | Cogsy ($199) or Inventory Planner ($250) | Shopify native + Sumtracker (free to $50) | 3PL (no WMS owned) | $200 to $500 |
| $5 to 20M | Inventory Planner OR Cogsy OR Flieber ($299 to $599) | Cin7 Core ($349 to $999) | 3PL or ShipHero quote | $700 to $2,500 |
| $20 to 50M | Flieber OR Streamline mid-tier | Cin7 Omni / Unleashed Pro / Acumatica Essentials (~$7K/yr) | ShipHero or in-house WMS | $3,000 to $8,000 |
| $50 to 100M | Streamline enterprise OR ToolsGroup (light) | NetSuite (~$2K to $5K/mo loaded) OR Acumatica Prime (~$40K/yr) OR Brightpearl | ShipHero / ShipBob WMS / Extensiv | $8,000 to $25,000 |
| $100M+ | ToolsGroup / RELEX / Anaplan Supply | NetSuite enterprise OR SAP / Oracle | Custom or Tier-1 WMS (Manhattan, Blue Yonder) | $25,000 to $250,000+ |
Heuristic. If you cannot articulate why you need an ERP, you do not need an ERP. Stay on Shopify plus an IMS until you are inventory-pacing at $20M+. The break point is when the warehouse runs out of memory: more than 1 warehouse, more than 2 sales channels, or more than 5,000 SKUs.
Part 7: D2C-specific situations
The framework above adjusts by category.
7.1 Fashion and apparel
Seasonality + style risk dominate. Run Newsvendor math on each capsule (overage cost = markdown net of salvage, underage cost = lost gross margin). Pre-build for peaks. Plan markdown cascades from week one (30% / 50% / 70%+). Reserve at the high end (8 to 15% of inventory). Reference brands: Allbirds DIO 179, FIGS 200, Lulus 78 (algorithmic buying).
7.2 CPG and food / beverage
Expiry drives discipline. Vital Farms at 18 days DIO is the structural advantage of perishability. FIFO is the right method (track lots, manage rotation). Pull replenishment if domestic. Watch for shrink at 3PL (returns + damages on liquids and food can hit 2%+). Reference brands: Vital Farms, Honest Company.
7.3 Beauty and personal care
LTO (limited time offer) launch SKUs create classic AZ risk: high revenue, high variability, high stockout cost. Use selective JIC for launch SKUs (hold extra stock through first 90 days). FIFO for batch tracking (regulatory + expiry). Watch dead-stock policy carefully (formulation changes can obsolete stock instantly). Reference brand: Olaplex at 212 days DIO is the cautionary tale.
7.4 Subscription boxes
The unit of decision is the bundle, not the SKU. Forecast box subscriptions, then allocate to SKUs via box-mix planning. ABC-XYZ at the bundle level. Repeat rate falling below 20 to 35% will inflate DIO mechanically (you are not pulling forward demand). Reference brand: BarkBox at 169 days, with a $17.4M writedown in FY24 on toy SKUs from subscription pivot.
7.5 Custom and made-to-order (MTO)
Inventory approaches zero in finished goods. Hold raw materials at low ABC tiers. Newsvendor on critical components. The constraint is production lead time, not finished goods. Lean / JIT principles apply naturally.
7.6 Amazon FBA
Forward-deployed inventory at FBA increases effective DIO (your money is in Amazon's warehouse) and exposes you to long-term storage fees. Inventory Performance Index (IPI) below 400 caps your storage limits. Forward-deploy AX and AY SKUs only. Keep BZ and CZ SKUs at your 3PL or drop-ship. Treat FBA fees as part of channel-segmented gross margin. See Amazon FBA accounting and bookkeeping for the full P&L breakdown.
Part 8: The Eightx playbook
These are the moves we see across the portfolio, not the textbook. Eight wins. Seven fails. Eight quarterly review questions. All anonymized, all real.
8.1 The eight WIN moves
- Tie POs to a 150-day forward cash model, not a sales forecast. The single most common breakthrough on CFO calls is when an operator stops planning POs against "what I think I will sell" and starts planning them against "what cash do I need on hand, by month, to cover the 30% deposit and the 70% balance." Magnitude: operators consistently underestimate the deposit-to-cash gap by 60 to 90 days.
- Move to quarterly stock reconciliation if monthly is distorting GP signal. Multiple mid-market operators moved from monthly closing-stock journals to quarterly reconciliation because the monthly noise was masking real channel-level margin movements. The fix: estimate COGS each month as revenue per channel times landed cost per SKU, then do the full physical and system reconciliation quarterly.
- Use tariff-driven overstock as a calculated insurance buy, only on A-tier. In the current tariff environment, several operators consciously over-stocked best-sellers (sometimes 400 to 600 days of COGS) and the CFO sign-off was right because the math supported it: tariff uncertainty + 89-day lead times + the cost of a stockout on a hero SKU outweighed the carrying cost. The discipline: only A-tier SKUs, matched cash reserve buffer, written reset date.
- Split P&L by channel, recalc gross margin per channel monthly. Channel-segmented gross-margin reporting is the single most common margin-recovery move. One brand we worked with discovered Shopify GM 44%, Amazon 50%, eBay 52%, and a marketplace at 75% on the same SKUs. That immediately changed inventory allocation and ad spend decisions. Operators who do this catch margin erosion 2 to 3 months earlier.
- Order smaller, more often, when a credit line is the safety net. When a credit line is in play, operators move to smaller, more frequent POs rather than fewer big ones. Smaller commitments preserve optionality, the credit line covers the spike weeks, and the brand stops being held hostage by a single 3-month container.
- Use AP timing as a deliberate working-capital lever. Operators who deliberately shift AP timing (paying earlier in low-cash months to earn supplier credit, or stretching to 45 to 60 days when cash is tight) consistently outperform on free cash flow. AP days at 37 is healthy for a typical D2C profile.
- Treat inventory financing as insurance, not as growth fuel. A $1.2M / $3M / $5M credit line gets approved, but the operator only draws $300K to $400K at a time, cycles it through the year to keep the line active (no standby fees), and treats the rest as crisis-only firepower. Operators with cash on the balance sheet are calmer, negotiate better, and don't over-order.
- Bring in a forecasting tool early, then override for new launches. Inventory Planner or Cogsy running on the last 6 months of sales plus seasonality covers the base case fine. Where operators win is manually overriding the tool for new launches, brand extensions, or new channels (the tool will under-forecast launches and over-forecast end-of-life).
8.2 The seven FAIL modes
- Writedowns hidden inside COGS for a year, then dumped in one quarter. The single most damaging fail mode. An operator skips monthly inventory adjustments because "the numbers are confusing," and 12 months later a single reconciliation produces $397K + $581K + a chain of $30K to $40K monthly catch-up entries. Profitability for the prior 2 to 3 quarters gets retroactively rewritten. The right move was monthly accuracy, even if imperfect.
- Inventory tool drifting out of sync with the WMS. The forecasting tool says one thing, the WMS says another, the bookkeeper picks one, and gross margin is wrong by enough to matter. Cause: landed cost spreadsheets outside the tool, lag between invoice receipt and physical arrival, SKU naming inconsistencies. Fix: nominate a single source of truth and reconcile monthly.
- Tariff stockpile turns into dead stock when demand softens. The flip side of WIN 3. Brands that over-stocked B-tier and C-tier ahead of tariffs (not just A-tier) are now sitting on 12+ months of cover on items that aren't moving. Carrying cost + obsolescence + opportunity cost of cash exceeded the tariff savings.
- Founder attachment to SKUs. "But I love that product." The founder won't kill a tail SKU because they personally wear it or it was the original product the brand was built on. Meanwhile it ties up shelf space, working capital, and 3PL fees. The CFO move: cell-by-cell ABC-XYZ analysis to force a number-driven decision.
- Repeat purchase rate falling on a consumable. When repeat rate falls below industry benchmark (20 to 35% for consumables), inventory turns naturally collapse because you are churning through new customers and not pulling forward demand. Diagnostic: if DIO is rising AND repeat rate is falling, the problem is downstream of inventory, not in inventory itself.
- Inventory at 600 days of COGS. A specific portfolio data point: $200K stock on hand, cash balance ~$220K, inventory at 600 days of COGS. The operator's reasoning was tariff-defensive but the magnitude crossed from prudent to structurally dangerous. The CFO move was a 4 to 6 week rollout of an inventory AI tool to identify which SKUs to draw down first while protecting hero stock.
- 3PL fees at 20% of gross sales because storage accumulates quietly. Multiple brands have 3PL fees at 18 to 22% of gross sales because storage charges accumulate on over-stocked SKUs. Fix: line-item 3PL into storage / pick-pack / shipping / receiving and renegotiate (or move stock) on the storage bucket. We see 3 to 5 point recoveries when this gets attention.
8.3 The eight quarterly CFO inventory review questions
These are what we actually ask in the meeting. The Bain, McKinsey, and APICS textbook questions are not in the room.
- What is our DIO this quarter vs. last quarter, and which SKUs moved it? (Don't accept a single DIO number. Drill to the SKU level.)
- Which SKUs are in the bottom quartile by gross margin AND bottom quartile by velocity? Why are they still on the shelf?
- What is our forward 150-day cash requirement for PO deposits and balances, by month?
- Where is the gap between Inventory Planner or Cogsy or our ERP and what the warehouse actually has, and who is reconciling it monthly?
- Are we over-stocked on tariff-defensive inventory? Specifically: which SKUs are above 180 days cover, and was that intentional?
- What is our channel-segmented gross margin this quarter (Shopify vs. Amazon vs. marketplaces), and is the inventory allocation matching the margin?
- What is the carrying cost we're paying right now (3PL storage + capital + obsolescence reserve + insurance)? Up or down?
- If a credit line is approved, are we drawing on it as insurance only, or are we using it for growth? If growth, what is the unit-economic justification?
Inventory decisions are cash decisions wearing an operations costume. Every "should I reorder?" question is really "do I have the cash, and what does this lock up?" Every "should I write this down?" is really "what is the P&L hit, and does it affect my credit line covenants or my equity raise?" Operators who flip the lens, lead with the 150-day cash model, and let the inventory tool fill in the units, outperform operators who plan from a sales forecast and hope the cash works out.
Part 9: 12-month implementation roadmap
For a $20M D2C operator starting from informal inventory management with no IMS and a quarterly stock count.
Month 1: Diagnose. Pull last 12 months of Shopify (+ Amazon if applicable) product reports. Compute DIO, turns, GMROI, and CCC. Compute carrying cost at 25% of average inventory. Rank SKUs by revenue and gross profit dollars (Pareto + ABC first cut).
Month 2: Classify. Add XYZ on weekly demand. Build the 9-cell ABC-XYZ matrix. Identify CZ kill candidates. Identify AZ priority-protection SKUs. Set draft service-level targets per cell (99% AX, 95% B, 90% C).
Month 3: Forecast. Choose IMS (Cogsy or Inventory Planner at this revenue band). Load 12 months of clean sales history. Run forecasts at SKU level. Manually override for launches, EOL, and channel changes.
Month 4: Reorder rules. Set reorder point and safety stock per SKU based on chosen service level + lead time variability. Wire auto-reorder triggers on AX and AY SKUs. Move B and C to weekly buyer review.
Month 5: Cash model. Build the 150-day forward cash model. Map every PO deposit (30%) and balance (70%) by month against projected revenue. Identify cash troughs. Decide which to fund (savings, credit line, or supplier-term renegotiation).
Month 6: Accounting. Implement WAC if not already. Write the dead-stock policy. Set obsolescence reserve at 4 to 8% based on category. Run first aging report. Take any catch-up writedowns NOW (not later, in one shot).
Month 7: Financing. If you need it: apply for a bank line (cheapest, slowest) or a Settle / Wayflyer line (faster, more expensive). Set the line up before you need it. Treat as insurance.
Month 8: Channel split. Implement channel-segmented gross margin reporting. Calculate Shopify vs. Amazon vs. marketplace GM monthly. Adjust inventory allocation to the highest-GM channel where possible.
Month 9: SKU rationalisation. First CZ cull. Liquidate or write off 10 to 20% of the C-tier tail. Banner the saved warehouse space and the saved working capital on the P&L.
Month 10: Supplier terms. Renegotiate with top 3 suppliers. Push for smaller deposits, more milestones, or Net 30 if relationship is mature.
Month 11: 3PL audit. Line-item 3PL fees (storage, pick-pack, shipping, receiving). Renegotiate the storage bucket. Identify slow-mover SKUs eating storage fees.
Month 12: Quarterly review process. Lock the eight CFO inventory review questions into your quarterly cadence. Build the dashboard that answers them automatically. Hand it to ops to maintain.
Sources and methodology
SEC EDGAR 10-K filings (fiscal year 2025). Inventory balance, COGS, revenue, gross margin, and disclosed writedowns were pulled from the most recently filed 10-K (or 20-F for On Holding, IFRS) for 15 public D2C and consumer brands: Allbirds (BIRD), Warby Parker (WRBY), FIGS, Olaplex (OLPX), Lulus (LVLU), Solo Brands (DTC), Honest Company (HNST), BarkBox (BARK), Vital Farms (VITL), Beachbody (BODI), Stitch Fix (SFIX), YETI, On Holding (ONON), Lululemon (LULU), Crocs (CROX). Rent the Runway is excluded because their balance sheet treats rental product on a separate PP&E-like line. DIO calculated as (Ending Inventory / COGS) x 365 using the most recently filed closing inventory balance against trailing-12-month COGS.
FRED (Federal Reserve Bank of St. Louis). Retail Inventories-to-Sales Ratio (RETAILIRSA), Total Business Inventories-to-Sales Ratio (ISRATIO), Federal Funds Rate (FEDFUNDS), Bank Prime Loan Rate (DPRIME), and Secured Overnight Financing Rate (SOFR), monthly series 2016 to mid-2026.
Framework primary sources. Pareto / whale curve from NetSuite and Interlake Mecalux publications, Lorenz 1905. ABC from H. Ford Dickie's 1951 formalisation at General Electric, current ASCM CPIM body of knowledge. XYZ from Lokad, Mecalux, and ABC Supply Chain published methodologies. ABC-XYZ from Lokad and inteli-chain. Bain "Ten ways to improve your inventory management" (via WSJ) and "Supply Chain Consulting" pages. McKinsey "Supply Chain 4.0," "Supply Chain 4.0 in consumer goods," "How medtech companies can create value via inventory optimization," and "Autonomous supply chain planning for consumer goods companies." BCG Growth-Share Matrix (Bruce Henderson, 1970). APICS / ASCM CPIM and SCOR model. Goldratt and Cox, The Goal, 1984. Toyota Production System via Lean Enterprise Institute. Newsvendor critical fractile from Edgeworth 1888 and Arrow, Harris, Marschak 1951. EOQ from Ford Whitman Harris 1913. Multi-echelon from Clark and Scarf 1960. Bullwhip from Lee, Padmanabhan and Whang 1997 and Forrester 1961.
Tool and financing landscape. 2026 pricing pulled from vendor sites and G2 published tiers between 2026-05-29 and 2026-06-02: Inventory Planner (Sage), Cogsy, Flieber, Stocky (sunset 2026-08-31), GMDH Streamline, SKULabs, Sumtracker, Cin7 Core and Omni, Unleashed, Brightpearl, NetSuite (2026.1 release), Acumatica, SAP Business One, ToolsGroup, RELEX, Anaplan Supply, ShipHero, ShipBob WMS, Extensiv. Financing vendors: Settle, Wayflyer, Kickfurther (new 2026 pricing model), 8fig, Choco Up, Clearco.
Accounting sources. KPMG ASC 330 Inventory Handbook (2023), IFRS IAS 2 standard, RSM US GAAP vs IFRS Inventory note, NetSuite inventory writedown guidance, NRF retail-shrink data (last published $94.5B in 2021) and icape.io 2026 industry estimate (~$112B), CLA reserves benchmark, Toolio markdown cascade reference.
Internal pattern data. Across roughly 30 inventory-relevant founder calls from the Eightx fractional-CFO portfolio (Fireflies transcripts, last 90 days), themes anonymised. Real magnitudes (DIO 600 days, writedowns $397K and $581K, channel margin spread 44 / 50 / 52 / 75%) are drawn from these calls with brand names removed.
Limitations. Parallel.ai was unreachable during the framework research pass, so Perplexity Sonar Pro substituted. Pinecone MCP for the 5,400-call corpus was not available, so the internal-pattern section is built from a 90-day Fireflies window rather than the full 3-year corpus. On Holding (ONON) files in IFRS and the EDGAR US-GAAP extractor returned empty, so figures were pulled manually from the FY25 20-F. Storeleads adoption share for IMS apps was unreliable and is not reported here.
Frequently asked questions
how much inventory should i actually carry as a d2c brand?
Target 60 to 120 days of inventory (DIO) for most D2C brands. The public D2C median is 129 days, the best quartile sits under 78 days, and worst-quartile brands run 180+ days. If your category is perishable or short-lead-time (food, supplements), aim for the low end. If you source overseas with 90-day lead times and a real stockout cost on hero SKUs, the high end is defensible. Above 180 days you are tying up cash that could be paying down debt or running ads. Above 365 days you have a structural problem.
what is the difference between abc and xyz analysis, and do i need both?
ABC sorts SKUs by value (revenue, profit, or units). XYZ sorts them by demand variability using the coefficient of variation. ABC tells you which SKUs are worth managing. XYZ tells you how predictable each one is. You need both because the policies are different. An AX SKU (high value, stable) gets tight reorder rules and high service levels. An AZ SKU (high value, volatile) needs higher safety stock or pre-order. A CZ SKU (low value, volatile) is your dead-stock candidate. Most operators run an informal version of both. Inventory Planner and Cogsy do it under the hood.
eoq vs reorder point: which one matters more in practice?
Reorder point matters more. EOQ (Economic Order Quantity, Harris 1913) is the textbook order-quantity formula but it assumes deterministic demand, no MOQs, and ignores lead time. None of that holds for D2C. Reorder point with safety stock (ROP = mean demand during lead time + Z times sigma) is what every inventory tool actually implements. You set service level (95% typical, 99% for hero SKUs), the tool reorders when stock hits ROP. EOQ is useful for thinking about ordering cost vs. holding cost in a worked example. ROP is what runs your business.
when should i write off dead stock, and how big a hit can i absorb?
Write off when there is no commercially viable resale path: damaged, expired, recalled, or aged out with no markdown recovery. Use 180-day and 365-day aging thresholds. Anything past 365 days with zero sales in 90 days and no demand forecast goes to liquidation or write-off. The size of the hit depends on your reserve policy. Healthy D2C runs a 2 to 4% obsolescence reserve against gross inventory. If you have been running zero reserve and skipping monthly adjustments, the catch-up writedown can be brutal. We have seen $397K and $581K single-quarter hits on $5M finished-goods balances at brands that put it off.
is jit (just in time) or jic (just in case) right for my d2c brand?
Neither across the whole catalogue. Pure JIT does not fit overseas-sourced D2C with 90-day lead times. Pure JIC is what created the 2022-2024 D2C writedown wave (Allbirds, Solo Brands, FIGS all over-ordered into the COVID demand bump). The right answer is selective JIC: JIC posture for critical hero SKUs and long-lead overseas, near-JIT for short-lead domestic CPG and predictable replenishment. Tag your top 10 SKUs as JIC-protected, run everything else lean.
what inventory tool should i use at my revenue band?
$1 to 5M: Shopify native plus Cogsy ($199/mo) or Inventory Planner ($250/mo). $5 to 20M: add Cin7 Core ($349 to $999/mo) or stay on Shopify and add Flieber ($299 to $599/mo). $20 to 50M: Cin7 Omni or Unleashed Pro plus Flieber, with ShipHero WMS if you self-fulfill. $50 to 100M: NetSuite or Acumatica plus Streamline. $100M+: ToolsGroup, RELEX, or Anaplan Supply on top of NetSuite or SAP. The break point is when the warehouse runs out of memory: more than 1 warehouse, more than 2 sales channels, or more than 5,000 SKUs.
should i finance inventory or use cash?
Finance it when the incremental gross profit on the next $1 of inventory exceeds the financing cost plus an inventory risk buffer. On a $20M brand at 60% gross margin, $1M of Q4 inventory financed at 11% APR carries about $55K over 6 months. If it sells through cleanly that is $545K of net contribution vs. cash. Below 15% APR, debt almost always beats equity for D2C with predictable turn. Above 20% APR (some revenue-based deals annualised), the math gets close to equity on slow-turn fashion-risk inventory. Treat the credit line as insurance, not as growth fuel.
what is a healthy cash conversion cycle for a d2c brand?
Aim for a CCC under 60 days. CCC = DIO + DSO (Days Sales Outstanding) - DPO (Days Payable Outstanding). D2C usually has DSO near zero (Shopify settles in days) and DPO around 30 to 45 days. That puts the lever almost entirely on inventory. Public D2C examples: Warby Parker 28 days, Vital Farms 14 days (excellent). Solo Brands 156 days (a 309-day inventory problem masked by stretching suppliers to 198 days, which is the pattern that breaks first when a supplier tightens).
what is a dead-stock policy and what does it actually say?
It is a written one-pager with three things. First, aging thresholds: 0 to 180 days normal, 181 to 365 days requires markdown plan, 365+ days classifies as obsolete. Second, a markdown cascade: 30% off first, 50% second, 70%+ final, then liquidation. Third, an approval matrix: category manager flags, finance calculates the reserve, operations confirms condition, CFO approves the writedown. Damaged, expired, or recalled stock writes off immediately regardless of age. Reviewed monthly, not annually.
what is asc 330 and why does it matter for d2c inventory?
ASC 330 is the U.S. GAAP rule on inventory. Three things to know. One: measure inventory at the lower of cost or net realizable value (NRV). Two: writedowns are recognised in earnings in the period of the decline. Three: once written down, you cannot write it back up if NRV recovers. That is the key divergence from IFRS (IAS 2) which does allow reversals. If you operate U.S.-only on GAAP, conservative reserves cost you flexibility. If you have IFRS exposure (international expansion, foreign parent acquisition), the reversal optionality matters.
how do i manage inventory across shopify, amazon, and 3pls without it breaking?
Single source of truth, then force everything else to reconcile to it. Pick one system as canonical (usually your WMS or ERP at $20M+, or Inventory Planner / Cogsy below that). Everything else (Shopify product feed, Amazon FBA inbound, marketplace listings) reconciles back to it monthly at minimum. The fail mode we see most often is the forecasting tool drifting from the WMS over a quarter, then the bookkeeper picks the wrong source for COGS, and gross margin is off by enough to matter for decisions. Nominate the owner. Run the reconciliation.
does amazon fba change how i should think about inventory?
Yes, in two ways. Forward-deployed inventory at FBA increases your effective DIO (your money is in Amazon's warehouse not your 3PL) and exposes you to long-term storage fees if SKUs sit. Inventory Performance Index (IPI) below 400 caps your storage limits. The right move is to forward-deploy AX and AY SKUs (high-value, stable or seasonal) to FBA, keep BZ and CZ SKUs at your 3PL or drop-ship them. Treat FBA fees as part of your channel-segmented gross margin and recompute it monthly. See our deeper read on Amazon FBA accounting and bookkeeping.
what does a fractional cfo actually do for inventory?
Three concrete things. One: builds a 150-day forward cash model that maps every PO deposit, balance payment, and supplier payment against monthly revenue, so you see the cash gap before it bites. Two: stratifies your SKUs into ABC and XYZ buckets, writes the reorder rules per cell, and forces a kill decision on the CZ tail. Three: writes the dead-stock policy, sets the reserve %, and runs monthly inventory adjustments so the writedown does not land in one quarter. See our fractional CFO services for the full scope.
what is the single biggest inventory mistake d2c brands make?
Treating inventory decisions as operations decisions instead of cash decisions. Every reorder question is really a cash question (do I have it, what does it lock up). Every writedown question is really a P&L and covenant question (can I absorb the hit, does it trip my credit line). Every JIC build-up is really a balance sheet question (am I trading cash for resilience and is the math right). Operators who flip the lens, lead with the 150-day cash model, and let the inventory tool fill in the units, outperform operators who plan from a sales forecast and hope the cash works out.