
eCommerce
Average Amazon ACoS by vertical 2026: apparel runs 42%, books run 19%, and the platform average lies
Amazon ACoS averages 32.5% across the platform in 2026, but the vertical range is wide: apparel runs 42% and books run 19%. Sponsored Products CPC is up 34% over two years. The platform average is nearly useless as a benchmark because category competition, organic rank position, and margin profile interact to set the sustainable ACoS ceiling for each vertical.
Key Takeaways
- Platform-wide Amazon ACoS sits at roughly 32.5% in 2026, up from 25-30% in 2024. AdBadger measures 32.48% and Jungle Scout reports 28.4% blended. Top-decile brands run 15-23%. The platform average lies because category spreads are wider than the trend.
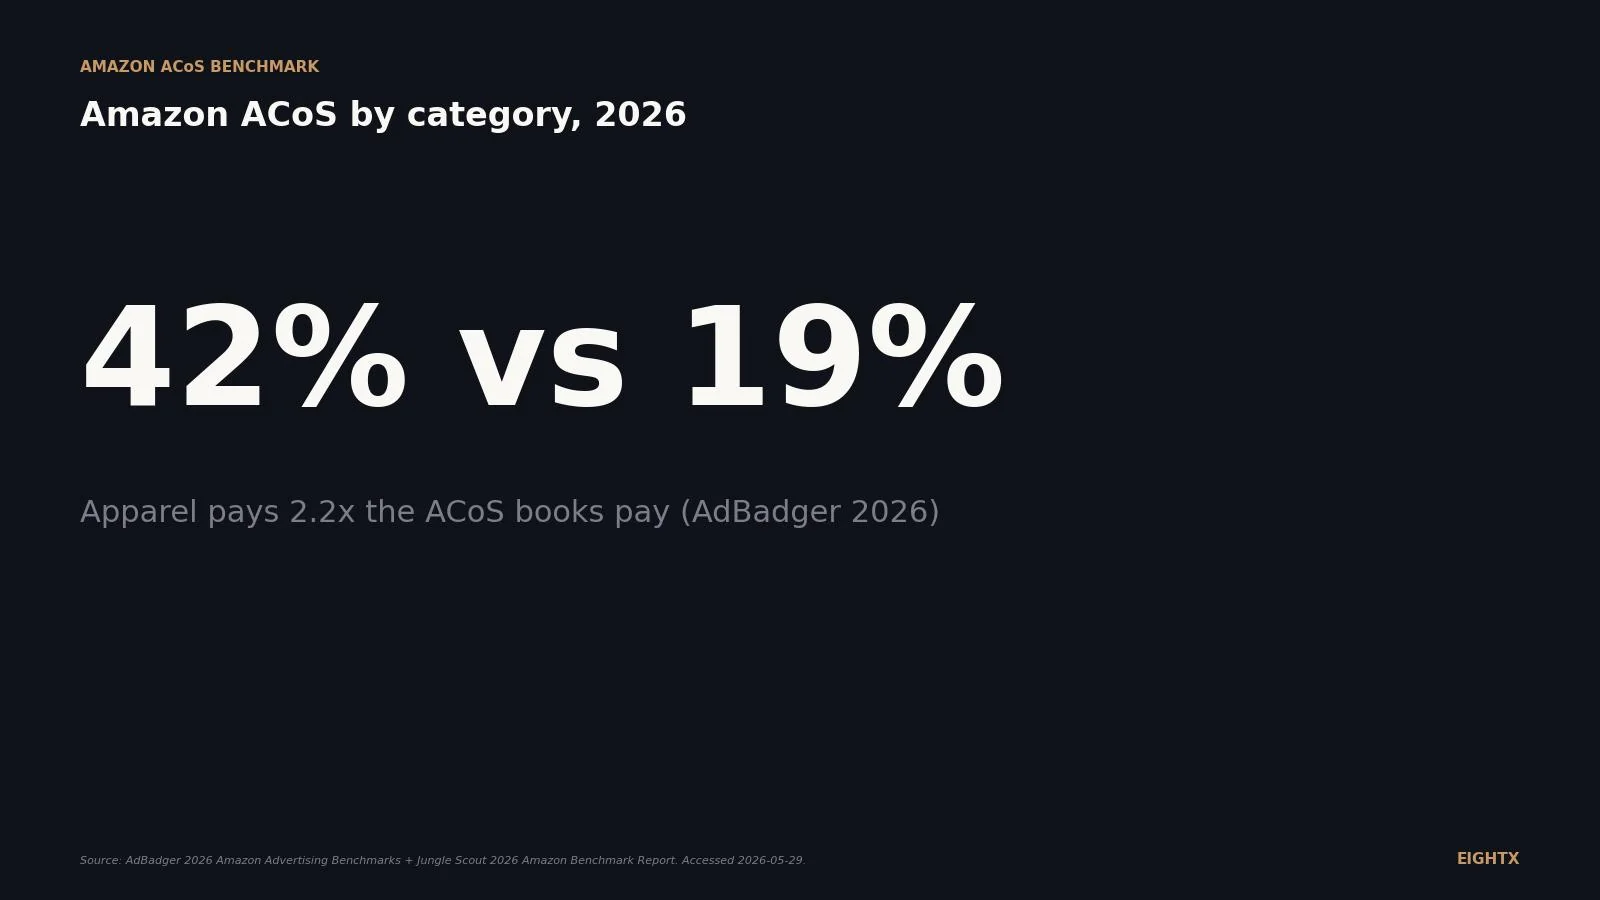
- Apparel runs the highest category ACoS at 42% and books run the lowest at 19%, a 2.2x spread. Apparel pays for fashion competition plus 20-30% return rates; books win because the conversion rate is high and the CPC is 38 cents.
- Sponsored Products CPC has risen 34% in two years to $1.34 (Jungle Scout 2026). The cost of a click is the dominant driver of ACoS drift in 2026, not weaker conversion. Platform CVR is actually up to 11-12% from a 10% historical baseline.
- Beauty has the cheapest ACoS of the high-CPC categories (24%) because conversion compensates. Electronics is the inverse: $1.45 CPC plus 7-10% CVR equals 29% ACoS even though it is structurally a branded category. Category benchmarks lie unless you decompose them.
- TACoS sits at roughly half of ACoS for healthy brands. Profit-focused mature brands run 8-12% TACoS. If your TACoS is rising while your ACoS is falling, you are buying volume, not building brand.
Amazon's ad business cleared $68.6 billion in fiscal 2025, up 22% year over year, bigger than the entire programmatic open web. Sellers are paying for that growth. Platform-average ACoS (the share of ad-attributed revenue that goes to Amazon paid placement) has crept from 25-30% in 2024 to roughly 32.5% in 2026, and Sponsored Products CPC is up 34% over two years to $1.34.
But the platform average lies. Apparel runs 42% ACoS. Books run 19%. Electronics CPC is almost four times books CPC. The operator decision this post drives: stop benchmarking your account against the platform average. Compare to your category, watch the gap between your reported ACoS and your return-adjusted ACoS, and read TACoS (total ad spend divided by total revenue) alongside ACoS so you can tell whether your ads are buying volume or building the brand. This page is a living quarterly-refreshed index of ACoS, TACoS, CPC, and CVR across 10 Amazon verticals.
The 2026 ACoS platform read: 32% is the new normal
Two large 2026 benchmark sets converge on the same range. AdBadger's 2026 Amazon Advertising Benchmarks measure platform-wide ACoS at 32.48%, with most accounts between 25% and 36%. Jungle Scout's 2026 Amazon Benchmark Report puts blended ACoS at 28.4%. The gap is methodological (AdBadger pulls from a specific tool user base, Jungle Scout from a broader seller panel), but the read is the same: 2026 is a high-CPC, mid-conversion environment, and the platform average has drifted up roughly 3-7 points since 2024.
The driver is almost entirely on the cost side. Sponsored Products CPC has risen 34% over two years to $1.34. The 2024 baseline was around $0.99. The 2025 number was $1.04-$1.12. The 2026 reading is $1.18-$1.34 depending on the source. Platform conversion rate is actually slightly stronger than the historical baseline (11-12% in 2026 versus a 10% norm), which means the math is structural: you are paying more per click, your conversion is steady, ACoS climbs.
The sell-side gravity behind all of this is Amazon's ad business. The chart above is the FY 2019-2025 trajectory of Amazon's "Advertising services" net sales line: $14.1 billion in 2019, $46.9 billion in 2023, $68.6 billion in 2025. Every quarter, more first-page real estate becomes paid placement. Organic share contracts. ACoS creeps. The 22% YoY growth in 2025 outpaced AWS for the first time. This is structural pressure on every Amazon seller's unit contribution margin, and it is not going to reverse.
Fiscal year Amazon ad services revenue ($B) YoY growth 2019 14.1 n/a 2020 21.5 +52.5% 2021 31.2 +45.1% 2022 37.7 +20.8% 2023 46.9 +24.4% 2024 56.5 +20.5% 2025 68.6 +21.4%
Why this matters for your business: the platform-wide drift is the wind, not the weather. Your category, your stage, and your product return rate decide where your number should actually sit. Read the rest of the post against your specific category, not the 32% headline.
ACoS by Amazon category, 2026: the full 10-row table
The headline payoff. AdBadger's 2026 by-category table is the cleanest open-web 2026 measurement of ACoS across the 10 dominant Amazon categories. Cross-checked against Jungle Scout's 2026 directional ranges and Amazon Growth Lab's category norms, it holds up as the working benchmark to compare your account against.
Apparel sits alone at the top. The category combines three structural drags: extreme keyword competition (every brand bids on the same generic shopping intent), a 20-30% return rate that inflates effective ACoS, and listings where the buyer comparison-shops on fit and visual rather than buying on the first click. Sports and outdoors at 33% and home and garden at 31% are the second tier: mid-CPC categories where seasonal demand and SKU sprawl push ACoS up. Electronics at 29% is the most interesting outlier (more on that in the next section). The bottom of the table is owned by categories where buyer intent is sharp and the CPC is low (buyers know the SKU they want and the click converts on the first ASIN): food and grocery at 21%, books at 19%.
One caveat before you read the table. AdBadger is the cleanest open-data source for 2026 by-category ACoS, but it is a single aggregator weighted toward its own tool user base. Treat each row as a ±3-point band rather than a point estimate, and compare your account against the category direction and spread, not the decimal.
Category ACoS 2026 TACoS (healthy band) CPC 2026 CVR 2026 Clothing & Apparel 42% 8-12% $0.72 9-12% Sports & Outdoors 33% 8-12% $0.82 10-13% Home & Garden 31% 8-12% $0.88 11-13% Electronics 29% 10-15% $1.45 7-10% Toys & Games 28% 8-12% $0.78 10-12% Health & Household 27% 10-15% $1.05 11-14% Pet Supplies 26% 8-13% $0.91 12-15% Beauty & Personal Care 24% 10-14% $1.18 12-15% Food & Grocery 21% 8-13% $0.58 12-15% Books 19% 5-8% $0.38 15-20%
What to do this week: pull your trailing-90-day Amazon ACoS by parent ASIN, map each parent to a category row above, and write the gap next to it. If your apparel SKU runs at 50% reported ACoS, the gap is 8 points above benchmark and the diagnostic is in the next section. If your beauty SKU runs at 18%, you are 6 points better than category, which is worth understanding and probably defending.
Why beauty has low ACoS but high CPC (and electronics is the opposite)
The non-obvious insight in the AdBadger table is that CPC and ACoS do not move together. Beauty and personal care has the second-highest CPC at $1.18 but the second-lowest ACoS at 24%. Electronics has the highest CPC at $1.45 and a high-mid ACoS at 29%. Apparel has the third-lowest CPC at $0.72 and the highest ACoS at 42%.
The variable that decides where a category lands is conversion rate, not cost per click. Beauty wins because the category runs 12-15% CVR on the back of repeat purchase, Subscribe and Save behavior, and review-driven trust. A $1.18 click converts often enough that the ACoS math works: roughly $9 in ad spend per $35 ad-attributed sale at midpoint. Electronics is the inverse. The category runs 7-10% CVR because customers comparison-shop across multiple ASINs and price-check off-platform before buying. A $1.45 click that only converts in the 7-10% band pushes ACoS to 29% even on well-rated listings. Apparel is a third failure mode: cheap clicks plus mid-tier conversion plus a 20-30% return rate compounds into 42% reported ACoS, which is closer to 50%+ effective ACoS once you adjust for returns.
The operator read is that category benchmarks lie unless you decompose them. Two beauty brands at 24% category ACoS can have very different underlying economics: one is paying $1.50 CPC against 14% CVR, the other is paying $1.00 CPC against 11% CVR. Same headline number, different levers to pull. Before you reset your bids, decompose your account-level ACoS into CPC and CVR for the last 90 days. The lever that moved is the one to act on.
ACoS vs TACoS: which one your CFO actually cares about
ACoS is a campaign metric. TACoS (total advertising cost of sale, ad spend divided by total Amazon revenue including organic) is a P&L metric. The healthy 2026 bands by objective: profit-focused mature brands run 8-12% TACoS, growth mode runs 15-22%, launch mode runs 20-25%+. Top-decile high-margin brands in beauty and supplements sustain TACoS in the 10-15% band even while ACoS climbs into the 30%+ range, because the organic flywheel dilutes the ratio.
The reason this matters is that the relationship between ACoS and TACoS tells you what your ads are actually doing. We look at the trend pair every time we open a client's Amazon account.
The healthy pattern: ACoS stable or rising slightly, TACoS flat or declining. That means you are spending efficiently enough on ads and your organic revenue is growing faster than your ad spend. Ads are building the brand. The unhealthy pattern: ACoS falling, TACoS rising. That means you are spending more in absolute dollars and your ad-attributed share of revenue is growing faster than your organic share. You are buying volume, not building brand. Most operators we work with cannot tell the difference because they look at ACoS weekly and TACoS quarterly. Flip that. Look at TACoS weekly and ACoS quarterly.
A working example. One consumables operator we work with was running 25% TACoS in a 75%-gross-margin category. The campaign-level ACoS looked elevated against the AdBadger benchmark. The TACoS read showed there was room to push spend harder, because the margin profile supported it and the organic flywheel was building. The directional read: in a 75%-margin category, the math supports pushing TACoS up from the 25% starting point if contribution margin per order still pencils. That is the trade you can only make if you read TACoS first and ACoS second.
The platform average lies. Your category is the wind. Your TACoS trend is the weather. Read both together or do not make ad spend decisions at all.
What to do if your category ACoS is 8 points above benchmark
The five-step diagnostic when your category ACoS is materially above the benchmark in the table above.
Step 1: decompose CPC vs CVR vs branded share. Pull the last 90 days. If your CPC is higher than the category average and your CVR is at category average, the leak is bid strategy or keyword competition. If CPC is at average and CVR is lower, the leak is your listing or the keyword mix. If both are off, the leak is structural and you need to rebuild the campaign architecture.
Step 2: build return-adjusted ACoS. Especially for apparel, supplements, and consumables with high return rates. Take ad spend divided by (ad-attributed revenue times (1 minus return rate)). Apparel sellers who skip this step are systematically under-budgeting their true cost of customer acquisition by 5-8 points. The Amazon-reported number treats returned orders as revenue; your contribution margin does not.
Step 3: audit branded search defense. Branded keywords (your brand name plus variants) typically run 10-20 ACoS points below non-branded. If your branded ACoS is over 15% you are either bidding too aggressively on your own name or competitors are bidding heavily and you are paying for defense. Pull the branded share of your ad spend and confirm it is in the 15-25% range. Most accounts under-defend branded.
Step 4: reset launch vs scale vs mature segmentation. A launch SKU should run 35-50% ACoS for the first 60-90 days while you build rank and reviews. A scaling SKU should run at category benchmark plus 5 points. A mature SKU should run at category benchmark minus 5 points. If your campaigns blend all three stages, your headline ACoS averages out the wrong way. Segment by stage, set different ACoS targets per segment, and stop comparing apples to oranges.
Step 5: measure TACoS trend over 90 days, not weekly ACoS. Whatever you change in steps 1-4, the test is whether TACoS trends down over the next quarter. Weekly ACoS bounces around with seasonality and search-term noise. TACoS quarter over quarter is the real signal.
The operator read on all of this: 30%+ ACoS is fine if your category and stage support it (high LTV, Subscribe and Save flywheel, launch SKU still building rank). It is a flashing red light only if your TACoS is also rising and your contribution margin is compressing. Run the diagnostic before you cut spend. Most accounts we open are over-cutting on ACoS and under-investing in branded defense, which makes the problem worse in 60 days.
For more on the contribution-margin discipline behind these decisions, see our interim CFO services overview and our breakdown of Amazon vs DTC margin gap, 2026 for the channel-mix economics. The accounting side is covered in Amazon FBA accounting and bookkeeping and Amazon Seller Central accounting.
Sources and methodology
AdBadger 2026 Amazon Advertising Benchmarks. AdBadger publishes the cleanest by-category 2026 ACoS table in the open web, covering 10 dominant Amazon categories. The 32.48% platform-wide ACoS figure and the per-category ACoS and CPC numbers in the bar chart and table above are drawn directly from this source. Methodology is aggregated AdBadger tool data, weighted toward US Sponsored Products spend. Limitation: single aggregator, weighted toward AdBadger's customer mix.
Jungle Scout 2026 Amazon Benchmark Report. Gated PDF, public-facing summaries cite Sponsored Products CPC at $1.34 (up 34% over two years), blended platform ACoS at 28.4%, platform CVR at 11-12%. Used as a cross-check against AdBadger and as the source for the two-year CPC trajectory.
Pacvue and Helium 10 Q3 2025 SMB Retail Media Benchmark Report. Public PDF covering Q3 2025 category-level CPC, CVR, and ROAS for Electronics, Health and Household, and Grocery and Gourmet Food. ACoS derived from ROAS using ACoS equals one divided by ROAS times 100. Used as a triangulation source for the Electronics and Health and Household rows in the table.
Amazon Form 10-K, fiscal year ended December 31, 2025. Accession 0001018724-26-000004, filed 2026-02-06. The "Advertising services" net sales line discloses $68.6 billion for fiscal 2025 (up 22% year over year from $56.5 billion in fiscal 2024). The 2019-2023 figures in the line chart and table are drawn from prior 10-K filings.
Amazon Growth Lab and Sellermetrics 2026 agency aggregates. Directional ACoS and TACoS ranges by category, used as a cross-check and as the source for the healthy TACoS bands in the table. These are agency-aggregated ranges rather than measured benchmarks, so they appear as bands rather than point estimates.
Limitations. No primary-source category-level ACoS matrix exists publicly for 2026 outside the AdBadger table. Helium 10, Tinuiti, and Skai publish broader trends but do not expose the full 10-category grid in open data. Amazon itself does not publish a "Sponsored Products average CPC by category" release. The table above is the best available open-data benchmark for 2026, but operators should treat the per-category ACoS as a ±3-point band rather than a point estimate.
Update cadence. This page is refreshed quarterly. The headline platform ACoS and platform CPC are updated each quarter; the by-category table is updated when AdBadger or Jungle Scout publish a refreshed annual benchmark, typically Q1 and Q3. Next update target: August 2026.
Frequently asked questions
what is a good acos for amazon in 2026?
Depends on your category and your stage. Platform-wide the 2026 average is around 32% (AdBadger 32.48%, Jungle Scout 28.4% blended), but the category spread runs from 19% in books to 42% in apparel. Mature brands in a healthy category should target 20-30% ACoS. Top-decile accounts sit in the 15-23% band. If you are launching, 35-50% ACoS for the first 90 days is normal and fine.
why is my amazon acos so much higher than last year?
Almost certainly CPC, not conversion. Sponsored Products CPC is up 34% over two years to $1.34 (Jungle Scout 2026). Platform conversion rate is actually slightly better than 2024 (11-12% vs 10%), so the math is structural: you are paying more per click and your conversion is steady. If your account-level CVR is flat or up and your ACoS is still climbing, the leak is in CPC, which means your bid strategy, your branded defense, or your category competition. Cutting spend is usually the wrong response.
is acos or tacos the better metric to track?
Both, for different reasons. ACoS is a campaign efficiency metric: how much you spent on ads divided by ad-attributed revenue. TACoS is a P&L metric: how much you spent on ads divided by total Amazon revenue including organic. A healthy brand reads them together. If ACoS is steady and TACoS is falling, your ads are building organic flywheel. If ACoS is falling but TACoS is rising, you are buying volume without building the brand. CFO answer: TACoS is the one that goes on the dashboard.
how do amazon return rates mess up my reported acos in apparel?
Badly. Apparel return rates run 20-30% on Amazon, which means a reported 20% ACoS is actually closer to 27% effective ACoS on kept units. The reported ACoS treats returned orders as revenue; your contribution margin treats them as zero. Apparel sellers benchmarking themselves at the 42% category average without a return adjustment are flying blind by 5-8 points. Build return-adjusted ACoS in your own books: ad spend divided by (ad-attributed revenue times (1 minus return rate)).
why is my electronics acos so high even though i have good reviews?
Because electronics is a comparison-shopping category, not a discovery category. Customers click multiple ASINs before buying, which means CPC compounds without a sale. Electronics 2026 CPC is $1.45 (the highest in AdBadger's table) and CVR sits in the 7-10% band. The math is: $1.45 per click, roughly 8% of clicks convert (midpoint of the 7-10% band), average order value drives the rest. Even with a strong listing and good reviews, you are paying for the shopping process, not just the buyer. The fix is bidding harder on bottom-funnel keywords (your product name, your competitor SKUs) and less on top-of-funnel category terms.
what is a healthy tacos for a $5m amazon brand?
Depends on margin and stage. Profit-focused mature brands in mid-margin categories (apparel, kitchen, sporting goods) should run 8-12% TACoS at steady state. High-margin categories (beauty, supplements, premium home) can sustain 10-15% comfortably and push to 15-22% during aggressive scale. Launch mode is 20-25%+ for the first 90 days. The single number is not the point; the trend is. If your TACoS is trending down quarter over quarter while revenue grows, your ads are building organic share. That is the read your CFO actually cares about.
how do i lower my amazon acos without cutting spend?
Five levers, in order. First, decompose ACoS into CPC, CVR, and branded share so you know which one is moving. Second, push branded search defense (branded keywords typically run 10-20 ACoS points below non-branded). Third, audit your search-term reports and add negative keywords for high-click, zero-conversion phrases. Fourth, fix the listing: title, bullets, A+ content, and primary image are doing more for CVR than any bid change. Fifth, segment campaigns by launch versus scale versus mature SKU so each gets the bid logic it needs. Cutting spend without doing those five is how you destroy organic rank for a one-month ACoS print.
should i bid on my own brand keywords on amazon?
Yes, almost always. Branded ACoS runs 10-20 points lower than non-branded because the buyer is already searching for you. The argument against is that you are paying for traffic you would have won organically. The argument for is that competitors will bid on your brand if you do not, and you will pay a worse ACoS on a worse spot. Defense is cheaper than ceding the top slot. The CFO answer: yes, but keep branded bids low and the budget tight. You are not buying customers, you are buying real estate.