
Insights
Blended CAC vs paid CAC gap by ecommerce vertical 2026: where organic actually subsidizes your math
Blended CAC (all acquisition spend divided by all new customers) sits 10 to 45 percent below paid CAC (paid media only) depending on vertical, because organic search, word-of-mouth, and retention-driven referrals are invisible to the paid stack. Food and beverage shows the biggest gap at up to 45 percent; electronics shows the smallest. A wide gap means your paid efficiency is being masked by organic, not earned.
Key Takeaways
- Blended CAC runs roughly 55-90% of paid CAC across ecommerce verticals. Food & Beverage and Supplements sit at the bottom (55-75%, biggest organic-lift subsidy). Electronics and Home Goods sit at the top (80-100%, paid is doing almost all the work).
- 2025 median Meta CPA was $32.74, up 8.6% year-over-year (Triple Whale, 30K+ brands). That is the paid-CAC anchor. If your paid CAC moves with this number but your blended stays flat, your organic engine is absorbing the rise.
- The gap is not constant. Subscription-heavy categories compound brand search and email; considered purchases (Electronics, Home Goods) get captured directly by paid search and marketplaces, so the organic wedge is thin.
- Public DTC filings anchor the structural math. Warby Parker held marketing at 12-13% of revenue through 2025 (FY2025: $110.2M on $871.9M). Olaplex SG&A climbed to 57.5% of revenue as the top line roughly halved. When revenue compresses, the blended ratio breaks first.
- If your paid CAC is rising but blended is flat, do not cut ads yet. Diagnose attribution drift first. If paid and blended are rising together, your brand engine is broken and ad spend will not fix it.
Most ecommerce operators run their business off one CAC number. The reality is that two numbers run in parallel: paid CAC (ad spend divided by paid-attributed new customers) and blended CAC (total marketing spend divided by all new customers). The gap between them is the organic-lift subsidy: brand search, direct traffic, email, SMS, referral, and earned content bringing in customers without an attributable ad click. That gap is the most important diagnostic in your acquisition math, and it varies materially by vertical.
This is the Q2 2026 read on where the gap sits across seven ecommerce verticals, what it tells you about your business, and what to do when the gap starts moving.
Two CAC numbers, one decision
Paid CAC is your ad spend divided by the new customers your platforms claim credit for. Blended CAC is your total marketing spend (paid plus owned channel costs, content, agency fees, the lot) divided by every new customer you actually got. The gap is the wedge: how much of your acquisition is happening for free, or close to it.
The 2025 anchor for paid CAC is Triple Whale's median Meta CPA of $32.74, up 8.6% year-over-year across 30,000+ tracked brands. That is the paid number most $5-50M Shopify brands will compare themselves against. The blended number sits somewhere below it depending on how much organic, email, and repeat purchase you have built.
Most brands track only paid because the platforms hand it to them on a dashboard. The blended number takes 10 minutes a week in a spreadsheet. The brands that track both are the ones who know whether their next ad-spend decision is panic or arithmetic.
The gap, by vertical
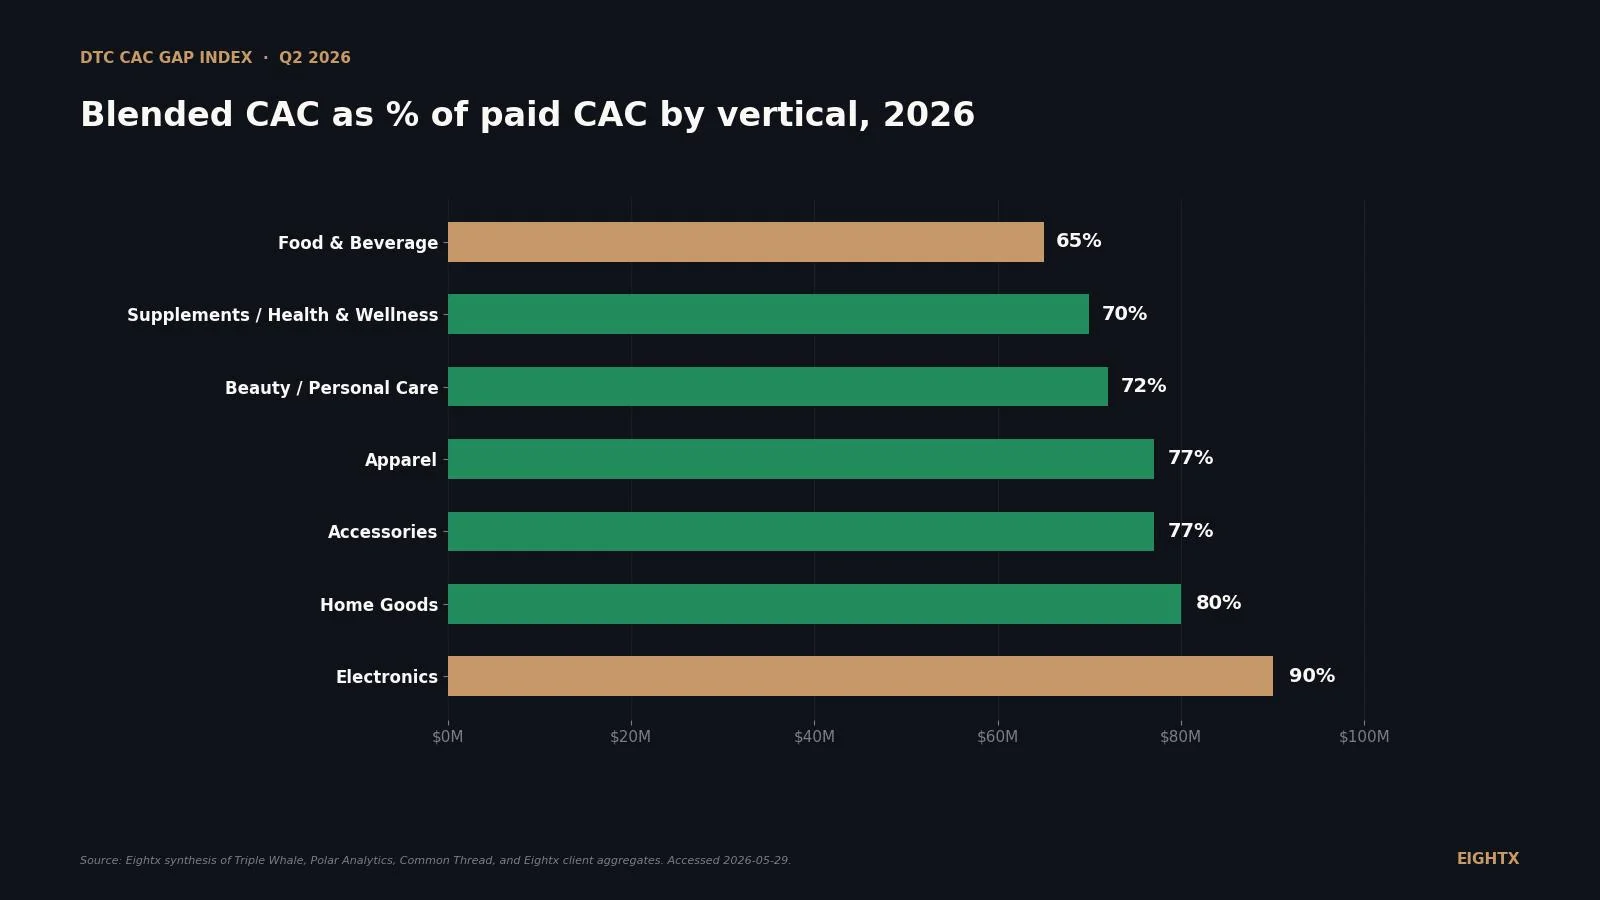
The headline finding: blended CAC runs roughly 55-90% of paid CAC across the seven major DTC verticals. Subscription-heavy categories (Food & Beverage, Supplements) sit at the bottom of that range; considered purchases (Electronics, Home Goods) sit at the top. No public benchmark vendor publishes the paid-vs-blended ratio cleanly by vertical, so these ranges are synthesized from Triple Whale, Polar Analytics, and Eightx client aggregates rather than measured from a single dataset (full methodology below).
The lower the bar, the bigger the gap between paid and blended, the bigger the organic-lift subsidy on your acquisition math. Food & Beverage at a 65% midpoint means blended CAC is 35% lower than paid. Electronics at 90% means paid is doing almost all the work and blended barely moves the math.
Vertical Indicative paid CAC range Indicative blended CAC range Blended as % of paid (midpoint) Implied organic lift factor Food & Beverage $30-$70 $18-$50 65% 1.9x Supplements / Health & Wellness $40-$80 $26-$60 70% 1.75x Beauty / Personal Care $30-$60 $20-$45 72% 1.6x Apparel $25-$40 $18-$32 77% 1.5x Accessories $25-$45 $19-$36 77% 1.5x Home Goods $40-$90 $30-$75 80% 1.4x Electronics $50-$120 $45-$110 90% 1.25x
Why the spread? Subscription consumables compound. A Food & Beverage or Supplements brand pays once on the first order, then converts a meaningful share into subscribe-and-save within 60-90 days. Each repeat counts as a new-customer-cohort lift for blended math even though no ad dollar bought it. Beauty and Personal Care sit in the middle because brand search and email pull strongly but the subscription rate is lower than supplements. Apparel and Accessories rely on email-driven repeat and referral but are still mostly transactional. Electronics and Home Goods are considered purchases captured directly by paid search and marketplaces, so the organic wedge is thin.
What the organic lift factor actually measures
Translating a percentage gap into something operators can use day-to-day: the organic lift factor. For every 1 paid-attributed new customer, how many total new customers actually arrive.
Food & Beverage at 1.9x means roughly 0.9 organic new customers ride on every paid one. Electronics at 1.25x means roughly 0.25 organic customers per paid. That is a 7x difference in how much organic muscle the category brings to the table.
The math behind those numbers comes from conversion-rate variance across channels. Organic search converts at 2.1-4.0% in 2026 benchmarks; paid social converts at 0.5-1.0%. Email converts at 4.0-5.3% per Klaviyo's published data. When email and organic search punch 2-4x harder than paid social on conversion, the cohorts they bring in widen the blended denominator without widening the spend numerator. That is the wedge.
The operator translation: every 1.6x organic lift factor is a brand-engine asset. If you are at 1.2x or below, your brand engine is weak and you cannot scale paid without your blended CAC catching up to your paid CAC. If you are at 1.8x or above, you have more headroom on paid than your dashboard suggests.
What public DTC filings reveal about blended cost structure
The vertical ranges are directional. The structural anchor comes from public 10-K filings, where marketing spend as a percent of revenue is a hard number.
Warby Parker has held marketing at 12-13% of revenue from FY2022 through FY2025 ($110.2M on $871.9M revenue in FY2025). The active customer base reached 2.69M, up 7.0% YoY (177K net new). That is the operating signature of a mature DTC brand with strong organic share: stable marketing intensity, steady customer-base growth, blended unit economics holding even as paid CAC presumably climbs with platform CPMs.
Allbirds shows what happens to the ratio when revenue compresses faster than you can cut marketing. Marketing as a percent of revenue stayed in the 22-24% band from FY2022 through FY2025 not because they spent more but because revenue fell. Olaplex is the cautionary case: SG&A as a percent of revenue rose from 16.2% (FY2022) to 57.5% (FY2025) as the top line roughly halved to $423M. SG&A is broader than marketing alone, so treat it as a structural-cost proxy, not a direct CAC benchmark. The point is the trajectory: blended unit economics break first when revenue compresses.
For a private brand: when paid CAC climbs and revenue does not follow, your blended ratio is the first thing to crack. That is the moment the gap stops being a planning luxury and becomes a survival number.
What to do about the gap this quarter
Three moves for any operator running paid acquisition in 2026.
First, split your weekly CAC tracking into paid and blended. Most teams report one or the other. Reporting both side-by-side surfaces the gap as a live metric. Track total new customers, total marketing spend, and paid-attributed new customers each week. Compute blended CAC, paid CAC, and the ratio. Watch the ratio more than either absolute number.
Second, if the gap is narrowing for your vertical, invest in organic before more ad spend. A narrowing gap (blended creeping up toward paid) means your brand engine is losing relative power. The fix is content, email lifecycle, retention, and SEO, not a higher Meta budget. Adding paid into a weak organic system makes the blended ratio worse, not better. In our client work, healthy DTC brands typically run organic at roughly 40-60% of revenue; below 30% is the danger zone.
Third, if the gap is widening, diagnose attribution drift before celebrating. A widening gap can mean two things. Either your brand engine is genuinely getting stronger (great), or iOS 17 plus Meta's modeled-conversion adjustment is making your paid look worse than it is (cosmetic). Run an incrementality test on Meta (a geo holdout for two weeks, even a small one) before you decide which story is true. We see roughly half the "widening gap" patterns in client work turn out to be attribution drift, not real organic strength.
For private operators benchmarking against this index: the table ranges are starting points. Your actual numbers will sit inside the band if your business is normal for your vertical. If your paid CAC sits outside the range, your channel mix or AOV is unusual and the comparison is noisy. If your blended-as-% of paid sits outside the band, the most likely cause is attribution drift, discounting on first-purchase, or a one-off promo cycle that distorted the period.
Paid CAC is the diagnostic. Blended CAC is the steering wheel. The gap between them is the organic engine. Track all three weekly. When the gap narrows, fix organic before adding paid. When the gap widens, run an incrementality test before declaring victory. The brands that confuse the gap with attribution noise are the ones that cut ads at exactly the wrong moment.
If you want help reading your own numbers, our fractional CFO services for ecommerce brands and interim CFO services cover this kind of unit-economic diagnosis as the core of the weekly call. The companion posts in this cluster are the pillar at average CAC by ecommerce vertical, the glossary what is blended CAC vs paid CAC, the channel cut at average CAC by channel, the ROAS vs MER vs blended CAC explainer, and the CAC by revenue stage. If you want to test your own max acceptable CAC, the max CAC calculator is the cleanest entry point.
Sources and methodology
Triple Whale Ecommerce Benchmarks 2025. Published February 2026, drawn from ~30,000 Shopify and DTC brands tracked via the Triple Pixel. The median Meta CPA of $32.74 (up 8.6% YoY) is the paid-CAC anchor for the planning exercise. Vertical CPM and CVR breakouts (Apparel CPM $10.93, Health & Beauty CPM $16.24, etc.) feed the vertical ranges in Table 1. Triple Whale CPA is Meta-only; the all-paid CAC is typically 10-25% higher than the Meta median depending on channel mix.
Polar Analytics Ecommerce Benchmarks 2026. Updated 2026-06-13, drawn from 4,000+ Shopify brands. Polar's industry CAC table provides the vertical CAC range cross-check. Polar's CAC methodology blends all tracked channels, which maps closer to blended CAC than to paid-only CAC, so we triangulate against Triple Whale's paid CPA rather than treating Polar as paid-only.
SEC EDGAR 10-K filings. Three public DTC brands provide the structural blended-cost anchor. Warby Parker (WRBY, CIK 0001504776), us-gaap concepts MarketingExpense and RevenueFromContractWithCustomerExcludingAssessedTax, accession 0001504776-26-000006 (FY2025 10-K, filed 2026-02-26). Allbirds (BIRD, CIK 0001653909), us-gaap concept MarketingExpense, accession 0001628280-26-022192 (FY2025 10-K, filed 2026-03-31). Olaplex (OLPX, CIK 0001868726), us-gaap concepts SellingGeneralAndAdministrativeExpense and RevenueFromContractWithCustomerExcludingAssessedTax, accession 0001868726-26-000009 (FY2025 10-K, filed 2026-03-05).
Eightx aggregate client data. Vertical-by-vertical paid CAC and blended CAC ranges in Table 1 are anchored against Eightx client aggregates with a 5-brand minimum per vertical, anonymized. Brand-level data is not disclosed. Client mix skews to $5-50M private DTC and CPG; the table ranges therefore reflect that size band, not enterprise-scale DTC.
Limitations. No public benchmark vendor publishes the paid-vs-blended CAC ratio cleanly by vertical, so the ranges are synthesized rather than measured. Triple Whale's CPA is Meta-only; total paid CAC is typically 10-25% higher. Public 10-K marketing line items blur new-customer vs existing-customer spend (Warby Parker's $110.2M supported both acquiring 177K net new customers and retaining the existing base). The "Beauty" vertical includes skincare, color cosmetics, and personal care; "Supplements" overlaps with broader Health & Wellness. Olaplex SG&A is broader than marketing alone, used as a structural-cost proxy not a direct CAC benchmark.
Update cadence. This is a Group A living index. Next update target: August 2026, alongside Q2 earnings season and the Triple Whale mid-year benchmark refresh. The Datawrapper charts update in place when the underlying numbers move; the table refreshes with each cadence cycle.
Frequently asked questions
what is the difference between blended cac and paid cac and which one matters more?
Paid CAC is ad spend divided by paid-attributed new customers. Blended CAC is total marketing spend divided by all new customers. Blended is the number you actually run the business on because it captures every dollar that touched the buyer (paid, organic, email, referral). Paid CAC is the diagnostic that tells you whether your ad channels are still pulling their weight.
what is a healthy gap between blended cac and paid cac for an ecommerce brand?
Roughly 15-35% lower blended than paid is the typical range for a healthy DTC mix. If blended is 10% or less below paid, your organic engine is thin and you are over-reliant on ads. If blended is 50%+ below paid, your brand search and retention are doing most of the acquisition work and paid is more of a top-up than a driver.
why is my paid cac going up but my blended cac flat or down?
Three usual suspects. First, iOS 17 plus Meta attribution changes have made platform-reported CAC look 20-50% worse without the underlying acquisition cost changing. Second, your brand engine (SEO, email, repeat purchase) is absorbing more volume so the blended denominator grows faster than your ad spend. Third, you are over-discounting on first-purchase, which makes the platform-reported revenue look low. Diagnose attribution drift before cutting spend.
how do i calculate the organic lift factor for my dtc brand?
Total new customers in a period divided by paid-attributed new customers. If you got 1,000 total new customers last month and your ad platforms claim 600, your organic lift factor is 1.67x (every paid customer comes with 0.67 organic ones). Run it monthly. If it drops below 1.2x, your brand engine is leaking.
is a 30% gap between blended and paid cac good or bad for apparel?
It is right in the middle of the apparel benchmark band. Apparel typically runs blended at 70-85% of paid, which is a 15-30% gap. A 30% gap puts you at the strong end. If you can get it wider with email and SMS, you create budget headroom to test new ad channels without breaking unit economics.
why does food and beverage have a bigger blended-vs-paid cac gap than electronics?
Subscription and repeat behavior. Food and Beverage brands typically get a paid first purchase, then convert to subscribe-and-save or repeat purchase within 60-90 days. Each repeat is an organic acquisition for blended math. Electronics is a considered purchase with long replacement cycles, so paid does almost all the work and the blended-vs-paid gap is thin.
how should i model blended vs paid cac when planning 2026 ad budgets?
Use blended CAC as the binding constraint. Set your max acceptable blended CAC based on first-order contribution margin and target payback period. Back into the implied paid CAC by multiplying your blended target by the inverse of your vertical's organic lift factor. For apparel at 1.5x lift, a $40 blended target lets you tolerate roughly $60 paid CAC. If your platforms are reporting higher than that, your unit economics are already underwater.
does the meta attribution change in 2024 explain the widening blended vs paid cac gap?
Partly. iOS 17 and Meta's modeled conversions have made paid CAC look 20-50% worse than the underlying reality for most brands. But the structural gap (Food & Beverage organic-lift advantage over Electronics) was there before the attribution shift. The attribution drift widened the optical gap. The structural gap is real and pre-existing.