
Insights
Ecommerce CAC by revenue stage 2026: the U-shape, the $5M-$20M dead zone, and the $100M+ relief
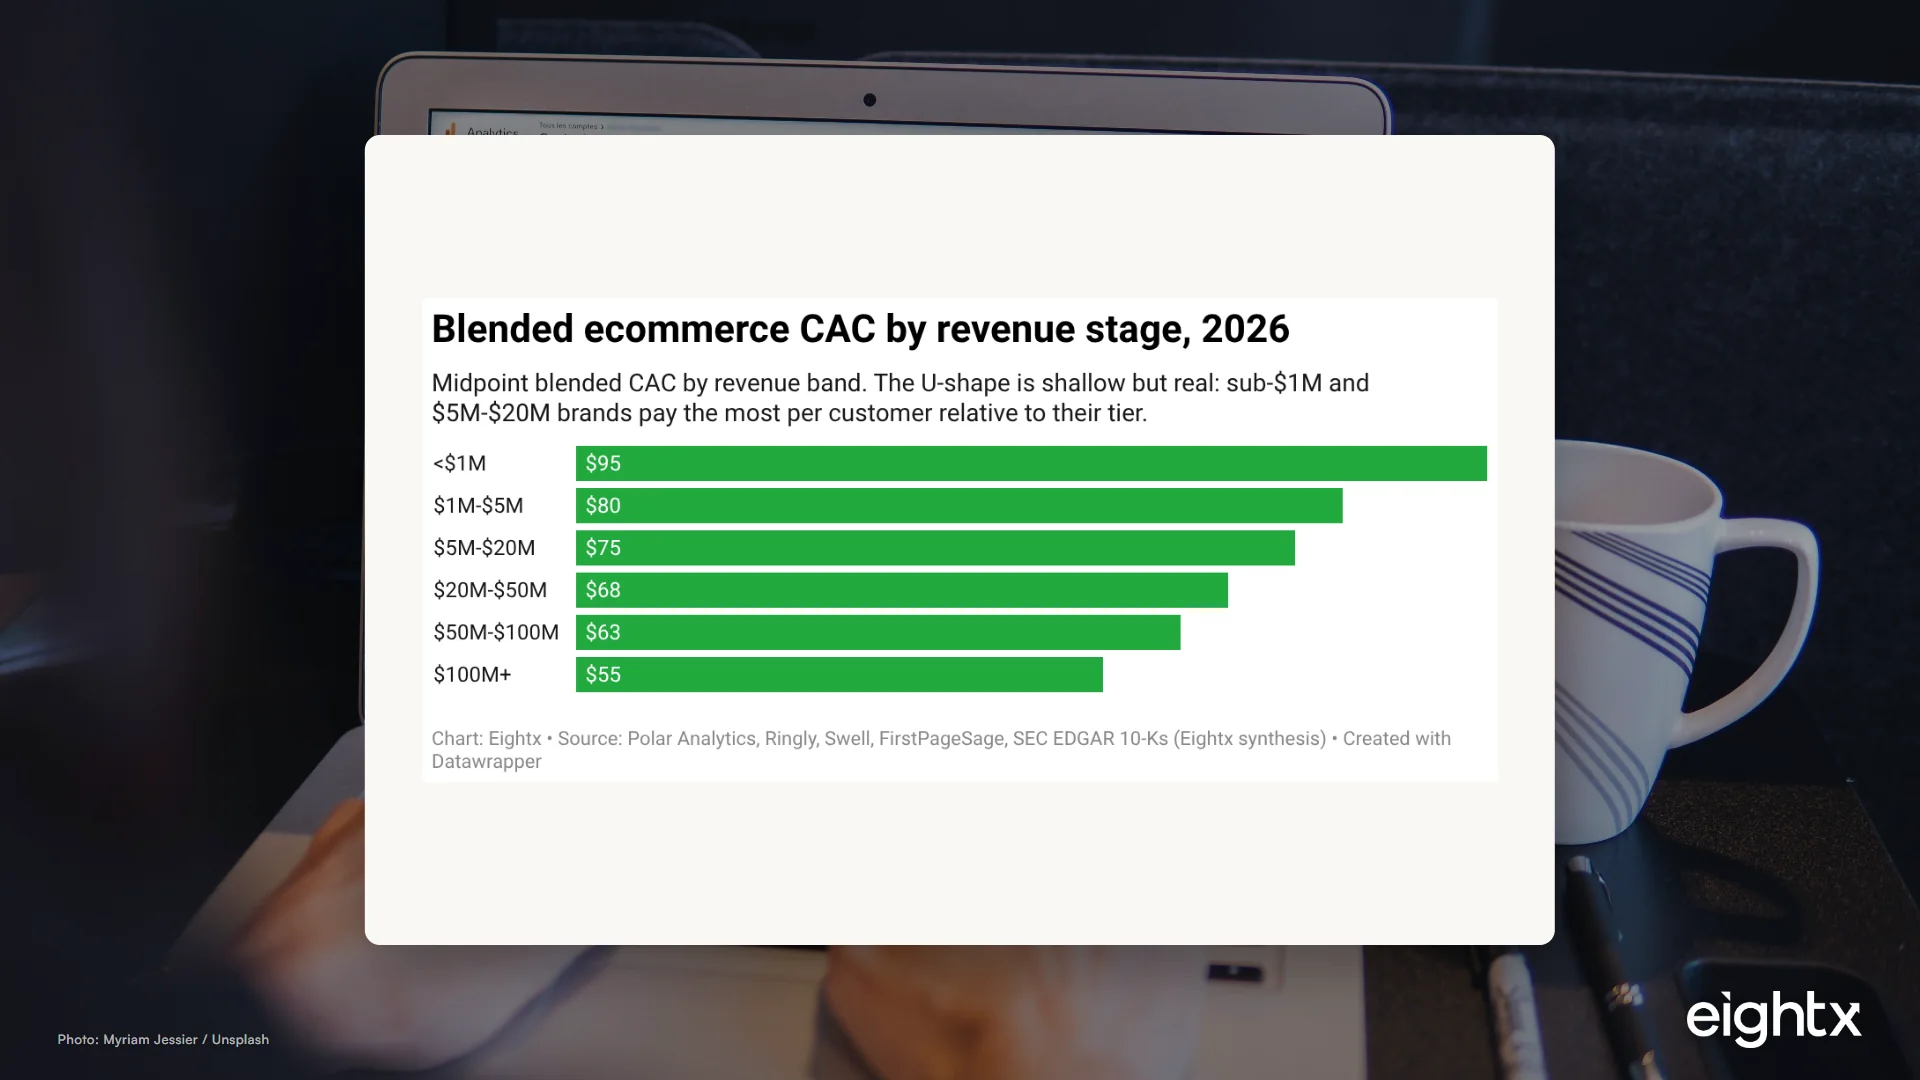
Ecommerce Customer Acquisition Cost (CAC) in 2026 exhibits a U-shape across revenue bands. Sub-$1M brands face a median blended CAC of $95. The $5M-$20M tier experiences the highest CAC at $75, per Polar. Brands exceeding $100M+ revenue achieve the lowest CAC, at $55.
Key Takeaways
- Blended ecommerce CAC follows a U-shape, not a steady decline. Sub-$1M brands sit at a $95 midpoint, $5M-$20M at $75 (the worst-efficiency tier in Polar Analytics' 4,000-brand Shopify panel), and $100M+ brands drop to $55. The cross-ecommerce median of $87 (2026 vendor synthesis) hides this curve.
- The $5M-$20M band is the structural dead zone. Brands at this stage have outgrown the organic/community lever from sub-$1M but lack the brand demand to offset paid auctions. Fixed G&A scales with headcount while CAC efficiency stops improving.
- CAC inflation is regressive. Sub-$1M brands face +20-30% YoY into 2026 (paid-social CPM exposure, no attribution stack); $100M+ brands absorb +8-18% via brand demand, retention, and channel diversification.
- Public DTC 10-Ks confirm the curve. Marketing as % of revenue runs 28-31% at Allbirds and Solo Brands ($200-450M), 11-15% at FIGS and Warby Parker ($550-770M), 6.5-8.5% at Chewy and Stitch Fix ($1.3B-$12B). The structural relief at scale is roughly 4x (Allbirds 28% vs Chewy 6.5%).
- Stop benchmarking against the $87 cross-ecommerce median. Benchmark against your stage band. If you're at $8M doing $90 blended CAC, you're not over-spending, you're in the dead zone. The answer is AOV, retention, and wholesale, not more Meta optimization.
Most DTC operators benchmark CAC against a single number ("the cross-ecommerce median is $87", per the 2026 vendor synthesis) or against their vertical ("supplements run high, pet runs low"). Both reads are real, both miss the stronger signal: where you sit in the revenue stack predicts more of your CAC than any other variable. This index post is the U-shape across six revenue bands, the math behind it, and the mix-shift moves that work at each stage.
If you want the channel-level cut, see average CAC by channel. For the vertical cut, see average CAC by ecommerce vertical. This post is the third axis: stage.
The U-shape nobody talks about
The cross-ecommerce blended CAC median is roughly $87 in 2026 (vendor synthesis), with a typical range of $68 to $84 across most operator-focused datasets. That is the headline. What gets buried is that the median sits on top of a U-shaped curve by revenue band. Sub-$1M brands pay above it. The $5M-$20M tier pays above it. Brands at $100M+ pay well below it.
Polar Analytics, which runs a weekly-refreshed Shopify performance panel across 4,000+ brands (last refresh 2026-05-25), explicitly flags the $5M-$20M tier as the worst CAC-efficiency band in their dataset and the $100M+ tier as the best. That is not vertical noise. That is structural.
The table below sets the full per-band picture. Inflation expectations, CAC payback targets, and mix-shift priorities are the operator action layer.
| Revenue band | Typical blended CAC | Position vs cross-stage midpoint ($75) | CAC payback target | Expected 2026 CAC inflation YoY | Mix-shift priority |
|---|---|---|---|---|---|
| <$1M | $70-$120 (midpoint $95) | Well above (+$20) | 6-9 months | +20-30% | Build organic + community lever |
| $1M-$5M | $60-$100 (midpoint $80) | Slightly above (+$5) | 9 months | +18-28% | Creative engine + email/SMS retention |
| $5M-$20M | $55-$95 (midpoint $75) | At midpoint (worst efficiency tier) | 12 months | +15-25% | AOV + retention + wholesale (dead zone) |
| $20M-$50M | $50-$85 (midpoint $68) | Below (-$7) | 12 months | +12-22% | Channel diversification (affiliate, retail, influencer) |
| $50M-$100M | $45-$80 (midpoint $63) | Below (-$12) | 12-15 months | +10-20% | Brand investment + attribution |
| $100M+ | $40-$70 (midpoint $55) | Well below (-$20) | 12-15 months | +8-18% | Attribution + data infra (reported CAC overstates by 25-45%) |
The $5M-$20M dead zone, explained
Three forces converge at this band.
First, the organic flywheel that worked at sub-$1M stops working. A founder doing $400K can run their own content, run the community, run the email list. By $8M revenue you have a team, and "organic" needs a head of content, a community manager, and a creator budget. That is a real line item, and it is competing with paid for finite cash.
Second, brand demand has not arrived yet. The relief at $100M+ comes from customers searching for the brand by name, which collapses paid-search and paid-social CAC. At $5M to $20M you usually do not have that signal yet. Your branded search volume is a rounding error against your category search volume.
Third, fixed G&A is scaling with headcount. Finance hire, ops hire, customer service hire, agency contracts. None of these directly improve CAC. So the cost base is rising while CAC efficiency is flat. The result on a P&L is the contribution-margin squeeze that Yotpo labels structurally and most operators feel as "we are growing but profit is not."
The CFO read in this band is straight: the answer is rarely "spend more on Meta." The answer is mix shift. Pull AOV up (bundles, premium SKUs, subscription). Pull retention up (post-purchase flow, win-back, referral). Add wholesale or retail revenue that does not carry a paid CAC. Each of those moves shifts the denominator without trying to break the paid-auction ceiling.
CAC inflation is regressive: smallest brands hit hardest
Across 2025, the hard YoY anchors are clear. The digital-first DTC cohort in the same synthesis saw +24.7% CAC inflation in 2025. Yotpo describes a 25-40% structural increase across channels, framed as permanent rebasing rather than a cyclical blip. Shopify's Global Commerce Report puts merchant-wide fully-loaded CAC at $274 going to $318, a 16.1% YoY move.
Decompose those across the revenue stack and the curve is regressive.
Sub-$1M brands face the highest exposure for three reasons. They are over-indexed on paid social as a channel. They lack the attribution stack to optimize through signal loss (no Northbeam, no Triple Whale, no Lifetimely). And they have the least brand-demand cushion to absorb auction-price inflation. The opposite is true at the $100M+ end. Diversified channels, dedicated data teams, retail partnerships, and brand search all dampen the inflation hitting paid.
For a $5M operator planning their 2026 budget, the practical move is to plan against the midpoint (+23% YoY) and stress-test against the upper bound (+28%). Build a 70/30 base/stretch ad-spend scenario rather than a single number. Hold the 30% for September if CPMs ease through the back half.
What public DTC 10-Ks tell us that vendor surveys don't
The cleanest stage-curve confirmation does not come from a benchmark vendor. It comes from SEC EDGAR. Public-company 10-K filings disclose marketing or advertising expense as a percent of revenue, which is the structural sibling of CAC at scale. The gap from $200-500M brands to $1B+ brands is the structural relief made visible.
| Company | Ticker | Approx. annual revenue | Marketing % of revenue (FY2023-FY2024) | Vertical |
|---|---|---|---|---|
| Chewy | CHWY | $11.86B | 6.5% | Pet (autoship-led) |
| Stitch Fix | SFIX | $1.34B | 8.5% | Apparel subscription |
| Warby Parker | WRBY | $770M | 11% | Eyewear |
| FIGS | FIGS | $550M | 15% | Medical apparel |
| Honest Company | HNST | $360M | 15% | Household CPG |
| Olaplex | OLPX | $420M | 26% | Beauty |
| Grove Collaborative | GROV | $210M | 19% | Household DTC |
| Allbirds | BIRD | $190M | 28% | Footwear |
| Solo Brands | DTC | $450M | 31% | Outdoor (paid-heavy) |
The 3-4x gap between $1B+ brands (Chewy 6.5%, Stitch Fix 8.5%) and $200-500M brands (Allbirds 28%, Solo Brands 31%) is the structural curve made concrete. Marketing percent of revenue is a consequence metric, not a steering metric, but as a benchmark it is the cleanest public proxy you can pull. The two visible anchors:
- At $1B+ revenue with retention infrastructure and brand demand, you should be running marketing under 10% of revenue.
- At $200-500M revenue without those structural advantages, you will run marketing at 20-30% of revenue. That is the public benchmark for the post-IPO "still scaling" cohort.
For a private $20M brand, expect to run higher than every public DTC in that table. The headline 6.5% Chewy number is not a benchmark for your stage. It is a destination.
What to do this week, by stage
The CFO read by revenue band.
Sub-$1M: Build retention infrastructure (Klaviyo, subscription if it fits, post-purchase flow) before scaling paid. Your CAC is high not because your channels are bad, but because your second-order economics are not built yet. The synthesis puts average first-order loss at $29, which means profit comes from purchase 2 and 3. Without retention, CAC is straight-line cash burn.
$1M-$5M: Invest in the creative engine and organic content. You have time, your CAC has not started inflating sharply, and your attribution is good enough to optimize. This is the band to lock in a sustainable LTV:CAC of 3:1 before fixed costs catch up.
$5M-$20M (dead zone): Mix shift. AOV (bundles, premium SKUs, subscription), retention (post-purchase, win-back, loyalty), wholesale, retail. Stop Meta-optimizing your way out. The auction is not going to give you back the 20-30% efficiency you need. The denominator is where the move is.
$20M-$50M: Diversify channels to dampen single-auction exposure. Affiliate, retail, influencer, marketplace. Each percentage point of revenue that does not carry a paid CAC is a percentage point of margin relief.
$50M+: Invest in attribution and data infrastructure. At this stage, signal loss makes reported CAC overstate true CAC by 25-45% (2026 vendor benchmarks). The CFO move is to fix the measurement so you can actually steer.
Stop benchmarking against the universal median. Benchmark against your stage band. If you are at $8M doing $90 blended CAC, you are not over-spending, you are in the structural dead zone. The right move is mix shift, not Meta optimization.
What we're watching next
Polar Analytics refreshes the underlying Shopify benchmark panel weekly; the next quarterly read lands in early Q3 2026. Triple Whale's full 2026 Ecommerce Benchmarks Report is expected after the close of Q2. Shopify's Global Commerce Report Q3 update is on the calendar for August. Q2 2026 public DTC earnings season runs late July through early August, which is when the next round of public-company marketing-percent-of-revenue numbers prints. We will refresh this index then.
For deeper reads on the CFO levers at each stage, see our interim CFO services, the public DTC margin leaderboard, and average CAC payback period by vertical.
Sources and methodology
Polar Analytics 2026 Ecommerce Benchmarks. Weekly-updated panel of 4,000+ Shopify brands. Last refresh as of writing: 2026-05-25. Public benchmark page surfaces vertical-level CAC; the qualitative tier finding ("$5M-$20M is the worst-efficiency tier, $100M+ outperforms all other bands") is from platform commentary on the dataset rather than a public table. Pulled via polaranalytics.com/ecommerce-benchmarks.
Triple Whale 2025 Ecommerce Benchmarks Report. Built on $18.4B in ad spend across 33,000+ brands using Triple Whale's first-party pixel and Shopify integration. Documents rising CPMs and CPAs through 2025. Full revenue-band tables sit behind the report download.
2026 vendor Ecommerce CAC synthesis. Blended ecommerce CAC range $68-$84; first-order average loss -$29; DTC CAC up roughly 222% over 8 years; digital-first DTC +24.7% in 2025.
FirstPageSage Average CAC for eCommerce 2026 Edition. Proprietary 80+ client dataset 2020-2025. Vertical-level CAC averages, with size-based splits described qualitatively.
Yotpo DTC Brand Comparison 2026. Source of the structural framing: 25-40% CAC inflation as permanent rebasing (not cyclical), 3:1 LTV:CAC golden ratio, and the mid-market margin dead zone framing that anchors our $5M-$20M section.
Shopify Global Commerce Report. Merchant-wide fully-loaded CAC moved from $274 to $318, +16.1% YoY. This is a cross-segment number that skews toward larger merchants and is heavily fully-loaded (agency fees, tooling, discounts), which is why it sits above the operator-channel numbers in the rest of the synthesis.
Compiled Customer Acquisition Cost Benchmarks 2026. Vertical-level CAC plus YoY inflation by category. Provides the SaaS CAC-by-ARR curve we use as the structural shape proxy where DTC-specific revenue-band data is missing.
SEC EDGAR 10-K filings. Marketing or advertising expense as a percent of revenue extracted from MD&A and consolidated statements of operations for Chewy (CIK 0001766502), Stitch Fix (CIK 0001576942), Warby Parker (CIK 0001504776), FIGS (CIK 0001846576), Honest Company (CIK 0001828183), Grove Collaborative (CIK 0001821806), Allbirds (CIK 0001653909), Olaplex (CIK 0001868726), and Solo Brands (CIK 0001846715). Fiscal years vary; latest available is FY2023 10-K and FY2024 partial 10-Q.
Limitations. No public dataset breaks out DTC ecommerce CAC cleanly into the six revenue bands here. The midpoints in chart 1 and the data table are a synthesis, with Polar's qualitative tier finding and the SaaS CAC-by-ARR curve as the structural shape. "Blended CAC" varies in definition across sources (paid-only vs paid + organic vs fully-loaded with agency, tools, and discounts). We use a "paid plus retention infrastructure, excluding pure organic content costs" definition. Public-DTC 10-K marketing percent of revenue is a proxy for CAC, not CAC itself; the gap from 28% (Allbirds at $190M) to 6.5% (Chewy at $11.86B) reflects both per-unit CAC efficiency and channel mix (Chewy's autoship reduces dependence on new-customer paid acquisition). Inflation expectations are extrapolations from the hard YoY anchors only. They are planning ranges, not forecasts.
Update cadence. This index is refreshed quarterly as new Polar, Triple Whale, and Shopify reports land, and after each public DTC earnings season. Next target: early August 2026.
Frequently asked questions
what is the average cac for a sub-$1m dtc brand in 2026?
The midpoint blended CAC for a sub-$1M direct-to-consumer brand in 2026 is roughly $95, with a typical range of $70 to $120. That is above the cross-ecommerce median of $87 (2026 vendor synthesis). Smaller brands pay more per customer because they have no organic flywheel, weaker creative iteration, and are over-indexed on paid social.
why is cac higher for $5m to $20m dtc brands than for either smaller or larger brands?
It is the dead zone. Brands at $5M to $20M have outgrown the cheap organic and community CAC that worked at sub-$1M, but they have not built enough brand demand to offset paid-auction inflation. At the same time, headcount and fixed costs are scaling. The result is that CAC stops improving as fast as G&A, marketing, and ops costs rise.
how much higher is cac for a startup dtc brand vs a scale dtc brand?
Roughly 1.7x. The midpoint sub-$1M CAC sits at about $95, while $100M+ brands run a midpoint of $55. That gap is the structural-curve effect of brand demand, retention infrastructure, and channel diversification compounding over time.
why does cac drop above $100m revenue when it's flat or rising at every other stage?
Three reasons. First, brand demand: $100M+ brands have customers searching for them by name, which collapses the cost-per-acquisition on paid search and social. Second, retention: subscription, post-purchase flows, and loyalty programs lift LTV so the marginal new customer is worth more. Third, channel diversification: retail, wholesale, marketplace, and affiliate revenue is not captured in 'blended CAC' but reduces the dependence on any single auction.
what's a healthy blended cac for a $10m dtc brand in 2026?
Plan for $55 to $95 blended, midpoint around $75. If you are above $95 and your gross margin is below 60%, your unit economics are likely upside-down on first order. The right move at this stage is mix shift toward AOV and retention, not Meta optimization.
how much cac inflation should i plan for in 2026 if i'm at $5m revenue?
Build a 2026 plan with 18% to 28% YoY CAC inflation, midpoint around 23%. That is the regressive curve: sub-$5M brands have the highest exposure to paid-social CPM inflation and the weakest attribution stacks. Build a 70/30 base/stretch ad-spend scenario rather than a single number, and hold the 30% for September if CPMs ease.
should i compare my cac to my vertical or to my revenue band?
Both, in that order. Pull your vertical CAC first (per Polar Analytics 2026: apparel around $38, beauty around $44, food and beverage around $54, home and garden around $67, health and wellness around $85) to set the absolute level, then pull your revenue-band CAC to see whether you are over or under the stage curve. If your vertical median is $54 and your stage midpoint is $75, expect to live in that envelope. If you are 20% above your stage midpoint, you have a structural issue, not an auction issue.
how do public dtc 10-ks help me benchmark my private brand's cac?
10-K marketing or advertising line items, divided by revenue, are the cleanest public proxy for CAC at scale. Chewy at 6.5%, Stitch Fix at 8.5%, and Warby Parker at 11% anchor the $1B-plus efficient end. Allbirds at 28%, Solo Brands at 31%, and Olaplex at 26% anchor the $200-$500M paid-heavy end. The 3-4x gap is the structural relief at scale. If you are a private $20M brand, expect to run higher than every public DTC in that table.