
Insights
Average ecommerce contribution margin by channel 2026: Meta, Google, email, organic
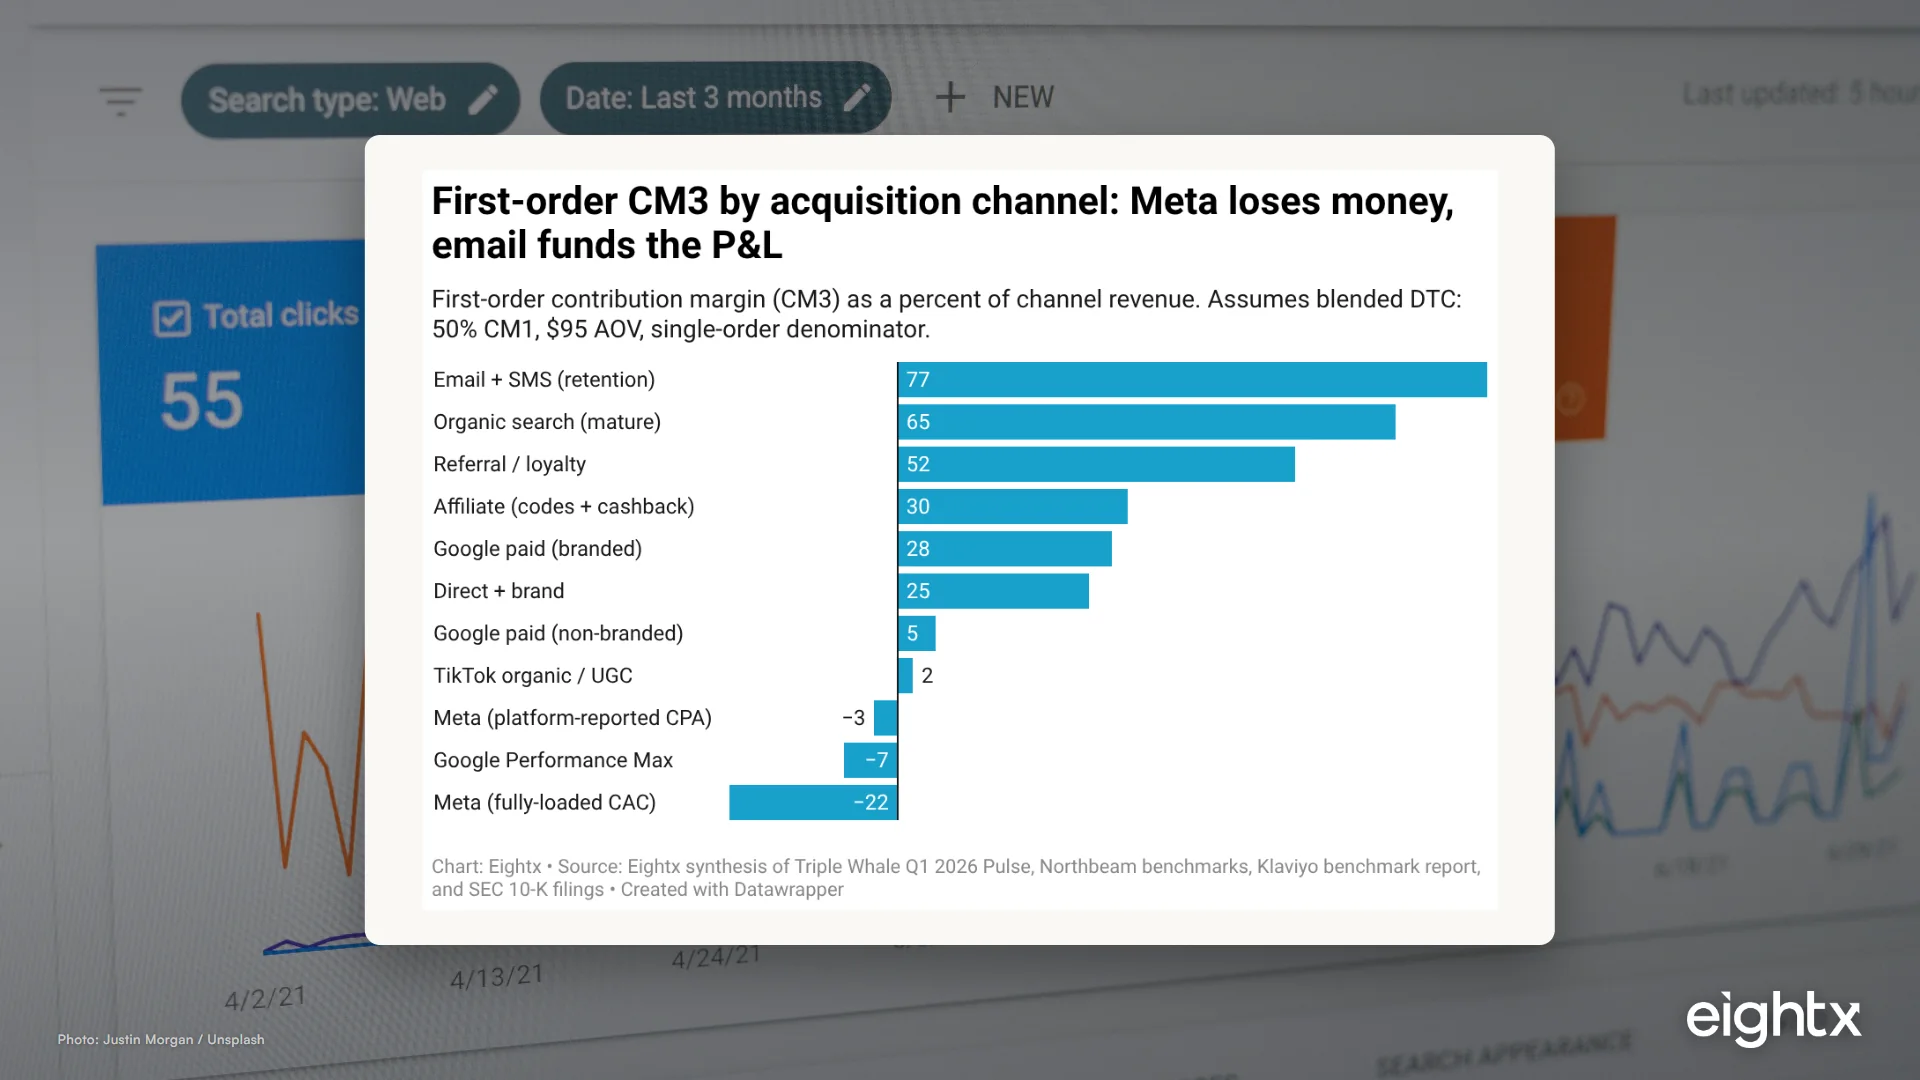
Average ecommerce unit contribution margin by channel for 2026 ranges significantly, from negative 22% for fully-loaded Meta cold-acquisition to positive 77% for email and SMS retention. Google paid and organic search channels typically fall in the middle, reflecting varied profitability across acquisition strategies for DTC brands.
Key Takeaways
- Channel CM3 ranges from roughly negative 22% on fully-loaded Meta cold-acquisition to positive 77% on email and SMS retention. Blended CM3 hides this gap. Most $5M to $50M brands run a Meta program their email program is invisibly funding.
- Internet advertising prices are up 30.4% cumulative since December 2022 (FRED WPU3661, April 2026 reading 130.4). Every point of ad-price inflation compresses paid-channel CM3 unless conversion or AOV moves with it. They haven't.
- Meta paid CAC: $38 to $58 platform-reported, $212 to $230 fully-loaded (Triple Whale 2025 Ecommerce Benchmarks for platform CPA; fully-loaded range from operator triangulation across $5M to $50M DTC clients, not publicly benchmarked). Against a typical $95 AOV and 50% CM1, first-order Meta CM3 is negative on both views. The channel only works on an LTV basis.
- 1-800-Flowers (FLWS) marketing intensity is 14.8% of revenue in FY2025, up from 8.1% in FY2020. The largest public pure-play DTC company has nearly doubled its advertising load in five years (SEC 10-K, accessed 2026-05-30). That is the public-data analog to private channel CM3 compression.
- Klaviyo flow revenue per recipient runs 18 to 30 times higher than median email campaign RPR. Abandoned Cart flow: $3.07 RPR. Welcome flow: $2.35. Median email campaign: $0.10. Flows are where the email CM3 comes from.
Most operators look at blended contribution margin and move on. The post we wanted to write pushes you one layer deeper: same brand, same SKUs, same gross margin, but contribution margin by acquisition channel ranges from roughly negative 22% on fully-loaded Meta cold-acquisition to positive 77% on email and SMS retention. Google paid, organic search, and affiliate land in between. Blended CM3 covers for the channels that subsidize each other. This page maps what 2026 actually looks like by channel, where the macro pressure is coming from, and how to compute the number honestly.
CM3 in this post means contribution margin after variable marketing (Revenue minus COGS, payment processing, fulfillment, shipping, returns, and variable marketing spend). That is the Eightx canonical definition we use across the contribution margin glossary and the average contribution margin by vertical benchmark. If you've seen a different stack from Common Thread Collective or other operator content, the math typically lands at the same CM3 percent but the layers are arranged differently. We use the Eightx layering throughout.
Why blended CM3 hides the real story
The reason most $5M to $50M brands can't answer "is my Meta program profitable" cleanly is that the blended number does the hiding. A typical mid-market DTC brand runs roughly 60% of revenue through paid social and search, 25% through email and SMS, and the rest split across organic, direct, affiliate, and referral. If Meta CM3 is negative 15% and email CM3 is positive 75%, the blended number can still look fine because the email program is doing the heavy lifting. Strip email out and the paid program is underwater.
We hear this in client calls every week. A typical line from an apparel operator (anonymized): "Meta ads shouldn't be used to acquire, they're too expensive. Once the customer's already been acquired we should be able to increase frequency." That is the post's central tension in one sentence. The Meta program isn't really an acquisition program at fully-loaded CAC. It's an awareness program that requires repeat purchase to clear payback inside 12 months. The email program is the profit engine pretending to be a retention tactic.
The other tell is Triple Whale's 2025 channel-share data: Meta is 68.3% of total DTC ad spend across the 33,000+ brands they track. That concentration means blended CM3 for the median brand looks a lot like Meta CM3, with email and SMS doing structural lift on the back end. The aggregate hides which channel is funding which.
The 2026 CM3-by-channel benchmark table
The chart below ranks 11 channels by first-order CM3 on a typical DTC unit-economics assumption (50% CM1, $95 AOV). It is not a forecast; it is a snapshot of what the math currently produces across the operator data we work with.
The table below is the detail behind the chart, with CAC ranges and payback windows. Treat the ranges as 25th to 75th percentile across operator data. Outliers sit outside.
| Channel | 2026 CAC range | First-order CM3 % (typical) | Payback months | Notes |
|---|---|---|---|---|
| Email + SMS (retention) | Near-zero marginal | 70 to 85 | Days | Klaviyo flows + campaign mix; lowest marginal cost in the stack |
| Organic / SEO (year 2+) | $20 to $50 amortized | 60 to 90 | Compounds | Falls dramatically with content scale; underweighted by most $5M to $25M brands |
| Referral / loyalty | $40 to $65 | 45 to 60 | 1 to 3 | Lowest paid-acquisition cost; high-NPS categories outperform |
| Affiliate (cashback, codes) | 15 to 25% of revenue | 25 to 40 | Same-order | Net of commission and discount-code stacking |
| Google branded search | $15 to $45 | 20 to 35 | 1 to 3 | Demand created elsewhere. Carve out before calling Google "profitable" |
| Direct / type-in | Near-zero | 20 to 35 | Same-order | Largely retention; small-share until brand maturity |
| Google paid (non-branded) | $60 to $140 | -5 to +15 | 3 to 9 | High intent but CPC +12.88% YoY; net-new demand |
| Google Performance Max | $60 to $150 | -10 to +10 | 4 to 10 | Catalog auctions; opaque attribution |
| TikTok Shop | $30 to $80 effective | 0 to +20 | 2 to 6 | Sub-$50 AOV impulse; arbitrage window still open |
| Meta (platform CPA) | $38 to $58 | -5 to +10 | 4 to 10 | Dashboard view; understates true cost |
| TikTok Ads | $90 to $129 | -10 to +5 | 6 to 12 | Cheaper CPMs than Meta; lower direct conversion |
| Connected TV (CTV) | $80 to $200 modeled | -15 to +5 | 9 to 18 | $25M+ brands; brand-building, modeled attribution |
| Meta (fully-loaded CAC) | $212 to $230 | -25 to -10 | LTV-dependent | Operator triangulation; ops + creative + agency + modeled |
The cleanest single CM3 sanity check published anywhere comes from Triple Whale's 2025 benchmark on top performers: AOV divided by CPA should be 2.7 or higher. Median brand in their dataset runs $74.12 AOV against $32.74 CPA, an AOV-to-CPA ratio of 2.26. That math is the difference between a channel that funds the rest of the P&L and one that the rest of the P&L is funding.
Your blended margin hides which channel pays.
Get our Contribution Margin calculator and see margin by channel.
Check your inbox — we'll send the Contribution Margin calculator shortly.
What's making channel CM3 worse in 2026: macro ad-price inflation
The macro story underneath every paid-channel CM3 conversation is that internet advertising itself has gotten 30% more expensive in 41 months. The FRED Internet Advertising Producer Price Index (WPU3661) rose from 100.0 in December 2022 to 130.4 in April 2026, a cumulative 30.4% increase. Year-over-year through April 2026: +5.14%.
Every point of ad-price inflation compresses paid-channel CM3 by roughly the same magnitude unless conversion rates or AOV move with it. They haven't. Triple Whale's 2025 data puts median ecommerce CTR at 1.77%, CVR at 2.01%, and AOV at $74.12, all within normal historical bands. CPMs are up, conversion is flat, AOV is flat. That is what structural channel CM3 compression looks like at the macro level.
The single-company analog that confirms this is 1-800-Flowers (FLWS), the longest-running public pure-play DTC consumer ecommerce business. Their advertising as percent of revenue has nearly doubled since 2019. In FY2019 it was 11.8% of revenue. By FY2022 it had risen to 16.4%. In FY2025 it sits at 14.8% on $1.94B of revenue (SEC 10-K, accessed 2026-05-30). Their marketing intensity sits roughly 3 percentage points above pre-pandemic levels (11.8% in FY2019 vs 14.8% in FY2025) and within striking distance of the FY2022 peak of 16.4%, even though revenue has come back down.
| Fiscal year | Revenue ($B) | Advertising expense ($M) | Marketing intensity (%) | YoY change |
|---|---|---|---|---|
| FY2019 | 1.249 | 147.8 | 11.8 | baseline |
| FY2020 | 2.119 | 171.4 | 8.1 | -3.7 pp |
| FY2021 | 2.123 | 307.9 | 14.5 | +6.4 pp |
| FY2022 | 2.118 | 347.7 | 16.4 | +1.9 pp |
| FY2023 | 1.939 | 291.9 | 15.1 | -1.3 pp |
| FY2024 | 1.881 | 283.6 | 15.1 | 0.0 pp |
| FY2025 | 1.940 | 286.4 | 14.8 | -0.3 pp |
The Common Thread Collective Q1 2026 DTC Index reinforces the channel split inside that macro: Meta ad spend was up 25% year-over-year with ROAS down only 3%, while Google ad spend was up 3.7% with ROAS up 12%. The honest reading is that Meta efficiency is decaying slowly while Google is structurally the higher-CM3 paid channel for 2026. That is a shift from the 2021 to 2023 era when Meta was the default profit channel.
How to actually measure channel CM3 (and the three mistakes most brands make)
Measuring channel CM3 honestly is mechanically simple but politically hard, because the answer usually downgrades the paid program someone is responsible for. The methodology in three steps.
Step 1: deduct platform fees plus fully-loaded ops overhead from paid. Your true Meta CAC is not the platform-reported $38 to $58. Add the agency retainer (typically $8K to $25K/month), in-house ops salary allocated to paid, creative production cost (often $5K to $15K/month at $5M to $20M scale), pixel and attribution tech ($300 to $2,000/month), and modeled attribution lift if you use Triple Whale or Northbeam. Fully-loaded Meta CAC at most $10M to $30M brands lands $200 to $230. That is the number that goes into CM3, not the dashboard CAC.
Step 2: carve branded search out of Google paid. Branded search captures demand created elsewhere at $15 to $45 CAC. Non-branded captures net-new demand at $60 to $140 CAC. Reporting them as one Google line inflates Google CM3 by 10 to 25 points and hides whether your non-branded Google program is actually working. The split is a 30-minute job in Looker Studio or Triple Whale.
Step 3: split email between flows and campaigns. Klaviyo's 2025 benchmark shows flows are 5.3% of sends but drive 41% of email revenue. Abandoned cart flow revenue per recipient is $3.07 against a median email campaign RPR of $0.10. Reporting them as a single email line both hides where the CM3 actually comes from and stops you from investing in the flow library that funds it. Flow RPR is 18 to 30 times campaign RPR. That gap is the lever.
The most common single mistake we see is treating creative agency fees and ESP cost as opex rather than variable marketing. Both are channel-attributable and both belong in CM3. If you don't pull them into the channel math, your paid CM3 looks artificially good and your email CM3 looks artificially bad.
What this means for your business if you're $5M to $50M in revenue
Three operator decisions follow from the channel CM3 read.
Rebalance toward retention if your Meta share is north of 55%. Most $5M to $50M brands we work with run a paid mix of 55 to 75% Meta. At fully-loaded CAC the math on that mix doesn't clear payback inside 12 months without strong repeat-purchase economics. Before you cut, check the LTV side: if your 90-day repeat rate on Meta-acquired cohorts is clearing 25 to 35% and second-order CM3 is positive, the channel works on an LTV basis and the prescription changes from "cut" to "tune." The shift is not "cut Meta entirely." It's "cut Meta cold-acquisition prospecting to retargeting plus warm pools, and reinvest the saved spend in email flow infrastructure, lifecycle SMS, and organic content." We see brands recover 3 to 8 points of blended CM3 in two quarters when they do this honestly.
Audit fully-loaded paid CAC quarterly, not just blended CAC. The single largest gap between dashboard reality and CM3 reality is in the loading of paid CAC. A $25K/month agency, a $120K/year paid lead, $8K/month in creative, and $1,500/month in attribution tech is $432K/year before you spend a dollar on ads. On a $500K monthly Meta budget, that's roughly 7% loading on top of platform CAC. On a $150K monthly Meta budget it's 24%. The smaller your paid budget, the heavier the fully-loaded math.
Build a media-mix model every 6 to 12 months. Channel CM3 is a snapshot. Channel-mix decisions are dynamic. The brands that get this right rebuild their mix every two quarters against the latest CPMs, the latest flow RPR, and the latest organic traffic curve. The brands that don't reset hold a mix that worked in 2023 and bleed CM3 quietly for 18 months.
Blended CM3 covers for the channels that subsidize each other. The lever isn't more spend or better creative. It's knowing which channel is funding which, then rebalancing the mix. Most $5M to $50M DTC brands are running a Meta program their email program is invisibly funding. That's fine as a structural choice. It's not fine if you don't know it.
For the supporting math see average CAC by channel, average contribution margin by vertical, and the Eightx contribution margin calculator. For glossary definitions see CM1, CM2, and CM3. For the macro environment that's compressing paid CM3 see the DTC macro pulse dashboard.
Sources and methodology
FRED Internet Advertising PPI (WPU3661). Monthly index, December 2022 = 100, not seasonally adjusted. We pulled the full series from 2022-12-01 through 2026-04-01, 41 observations. Series last updated 2026-05-13 with the April 2026 reading of 130.4. Computed YoY change of +5.14% to April 2026 and cumulative change of +30.37% since December 2022.
FRED E-Commerce Retail Sales as Percent of Total (ECOMPCTSA). Quarterly, seasonally adjusted. Latest observation Q1 2026 = 16.9%. We use this series to anchor the macro denominator under "ecommerce contribution margin," which is now roughly $280B of US retail per quarter. Cross-referenced against the restated MRTS series for the pre-2025 baseline.
SEC EDGAR 1-800-Flowers.com (CIK 0001084869, ticker FLWS). Advertising expense via XBRL tag AdvertisingExpense across the FY2019 to FY2025 10-K filings. Revenue cross-checked against the Revenues tag from the same filings. FY2025 accession: 0001084869-25-000017. Fiscal year ends late June or early July.
Triple Whale 2025 Ecommerce Benchmarks. 33,000+ brands, $18.4B in tracked ad spend. Median CTR all paid: 1.77%. Median CVR: 2.01%. Median CPA: $32.74 (+8.64% YoY). Median AOV: $74.12. Top performers maintain AOV/CPA at 2.7 or higher. Meta is 68.3% of total DTC ad spend in their cohort.
Klaviyo 2025 Email and SMS Benchmark Report. 183,000+ customers. Email averages 27% of total store revenue for mature brands. Flows are 5.3% of sends but drive 41% of email revenue. Flow revenue per recipient: Abandoned Cart $3.07, Welcome $2.35, Browse Abandonment $0.95, Post-Purchase $0.38. Top 10% email campaign RPR: $0.81. Top 10% SMS campaign RPR: $0.97.
Northbeam 2025 Year in Review channel benchmarks and the Common Thread Collective Q1 2026 DTC Index provided the directional read on Meta vs Google efficiency (Meta spend +25% YoY with ROAS -3%; Google spend +3.7% YoY with ROAS +12%).
Limitations. No public 10-K discloses channel-level contribution margin. SEC filings disclose aggregate AdvertisingExpense and segment revenue. Channel-level CM3 must be triangulated from private benchmarks (Triple Whale, Northbeam, Klaviyo) and the patterns we see in client work. All CM3 figures are first-order, single-order denominator. Meta and TikTok typically require multi-order LTV to clear payback, so first-order CM3 understates their full economics. Channel ranges are 25th to 75th percentile, not means. Influencer is excluded from the channel table because attribution windows and creator-fee variability make a single CM3 number misleading.
Update cadence. Refreshed quarterly. Next update target: 2026-08-30, aligned with the FRED Internet Ad PPI July release and the next Triple Whale, Klaviyo, and Northbeam reports.
Frequently asked questions
what is the average contribution margin by channel for ecommerce in 2026?
First-order CM3 by channel for a typical DTC brand: email and SMS retention 70 to 85%, mature organic search 60 to 90%, referral and loyalty 45 to 60%, affiliate 25 to 40%, Google branded search 20 to 35%, Google non-branded paid -5 to +15%, Meta platform-reported -5 to +10%, Meta fully-loaded -25 to -10%. These assume 50% CM1 and a $95 AOV blended denominator. Your numbers move with AOV, CM1, and how honestly you allocate ops + agency fees.
why is my meta cm3 negative when my dashboard says it's profitable?
Two reasons. First, the dashboard ROAS uses platform-reported CPA ($38 to $58 typical, Triple Whale 2025 Ecommerce Benchmarks) but your true CAC includes creative agency, in-house ops salaries, ESP and pixel fees, and 7-day-click attribution inflation. Fully-loaded Meta CAC runs $212 to $230 based on operator triangulation across $5M to $50M DTC clients (no public benchmark publishes a fully-loaded CAC at this resolution). Second, dashboards compute on revenue, not CM3. They ignore COGS, processing, fulfillment, shipping, and returns. Strip those four out and most Meta cold-acquisition spend is negative on a first-order CM3 basis.
how do i actually calculate cm3 by channel if i'm on shopify and meta?
Start with channel revenue (last-click is fine for v1). Subtract COGS and payment processing for that channel's orders to get CM1. Subtract fulfillment, shipping, and returns to get CM2. Subtract variable marketing including platform spend, fully-loaded creative and ops, agency fees, and incremental tech (Klaviyo, Triple Whale, attribution) to get CM3. Allocate fixed marketing salaries against blended revenue, not per-channel. The first time you do this for paid social, expect the CM3 to be lower than your dashboard suggests by 15 to 25 points.
is email contribution margin really 75 percent or is that retention math hiding something?
It is real but it has a denominator caveat. The 70 to 85% CM3 on email and SMS only applies to incremental email-attributed revenue (flows, campaigns, browse abandonment). If you're crediting email with revenue that would have closed via direct or organic anyway, you're inflating both email CM3 and email revenue share. Klaviyo's benchmark puts email at 27% of total store revenue for mature brands. Treat anything above 35% as suspect and audit the attribution model.
should i shift spend from meta to google if my google cm3 is higher?
Probably yes at the margin, but not on a single CM3 read. Google paid CM3 looks better mostly because branded search inflates it. Carve branded out of Google CAC first. The remaining non-branded Google CM3 is -5 to +15%, which is better than fully-loaded Meta but worse than what the dashboard suggests. The honest shift is from paid cold-acquisition (both Meta and non-branded Google) into retention (email, SMS, lifecycle) and into organic content. That's where the CM3 lever actually sits.
what's a healthy blended cm3 if my channel mix is 60 meta 25 google 15 email?
On those weights with mid-market unit economics: roughly 5 to 15% blended CM3. That is enough to fund opex and a small reinvestment line at $20M+ revenue but it is not enough margin to absorb a CPM shock or a return rate spike. Healthy blended CM3 at $5M to $50M scale is 25 to 35%. To get there from this mix you either need to drop Meta share to 35 to 45% or raise AOV and CM1 by 8 to 12 points. Mix is the lever.
does branded google search count as a separate channel for cm3 purposes?
Yes, always. Branded search captures demand created elsewhere (Meta, influencer, podcast, PR) at a $15 to $45 CAC. Lumping it into a single Google line makes Google paid look 15 to 25 points more profitable than it actually is on the net-new demand it captures. Split branded from non-branded in your reporting. Branded should sit closer to direct and organic on the CM3 leaderboard. Non-branded is where the real Google paid economics live.
how often should i recalculate channel cm3, monthly, quarterly, or only at planning time?
Quarterly is the floor. Monthly is the right cadence for a brand spending more than $250K/month on paid because CPMs move fast enough that a 90-day-old channel CM3 number can hide a 5 to 10 point swing. Build it as a recurring CFO close item, not a one-off planning exercise. The brands that get this right look at channel CM3 the same week they look at the P&L close.