
Insights
DTC macro pulse: 6 indicators every ecom operator should check this month (May 2026)
Six macro indicators every ecom operator should check this month. PCE consumption growth hit +5.94% YoY in April 2026 while University of Michigan sentiment sat at 49.8, a near-record low. CPI re-accelerated to +3.78%, so 2026 price lists locked at 2-3% inflation are now under-priced. Demand is spending hard despite feeling terrible.
Key Takeaways
- PCE personal consumption growth hit +5.94% YoY in April 2026, the highest reading since December 2024. Wallet-level demand is not soft.
- University of Michigan consumer sentiment sat at 49.8 in April 2026, one of the lowest non-recession readings in the series' history. Below the 2008-2009 trough.
- CPI all-items YoY re-accelerated to +3.78% in April 2026, up from a 2.39% trough in January. If you locked 2026 price lists assuming 2-3% inflation, you are now under-priced.
- The Federal Funds Rate held at 3.63% in May 2026, effectively paused after 170 bps of cuts from the 5.33% peak. The easy refinance window has narrowed.
- Retail e-commerce share hit 16.9% in Q1 2026, a new all-time high (FRED ECOMPCTSA). Channel keeps grinding share even in a hot omnichannel environment.
This is the page we update on the first of every month so we stop guessing at the macro. The same six indicators every time, in the same order, with the same operator question attached to each one. The May 2026 read is unusually two-faced: consumer spending (PCE) re-accelerated to +5.94% YoY in April, while consumer sentiment (UMCSENT) sat at 49.8, one of the lowest non-recession readings in the index's history. CPI is back at 3.78%. The Fed has effectively paused at 3.63%. E-commerce share keeps grinding higher (16.9% in Q1 2026, an all-time high). The wallet says go. The mood says hold. This is the live dashboard that helps you decide.
The 6 indicators we track and why
These six aren't picked because they are famous. They are picked because each one maps to a specific operator decision you make this quarter.
PCE consumption growth (YoY) is the wallet read. It tells you whether top-of-funnel demand exists. When PCE is hot, soft conversion is a creative or pricing problem, not a demand problem. The Federal Funds Rate drives the cost of any working-capital line, term loan, RBF facility, or MCA you are carrying. It also sets the discount rate behind every M&A multiple, so it shapes both your borrowing cost and the price you might exit at. Consumer sentiment (the University of Michigan UMCSENT index) is the mood read. Sentiment leads spending by 2-3 quarters when the gap stays open. CPI all-items YoY drives your 2026 price-list reset and your supplier renegotiation. Retail e-commerce share is the structural channel read. It tells you whether to defend digital ad budget or rebalance toward offline. Retail trade unemployment is the labor-cost read for the talent pool you actually compete for.
We refresh each indicator monthly except ECOMPCTSA, which is quarterly. The next ECOMPCTSA print lands in August 2026 (Q2 data). For the in-between months, we hold the prior reading and flag it.
The story this month: spending hot, sentiment cold
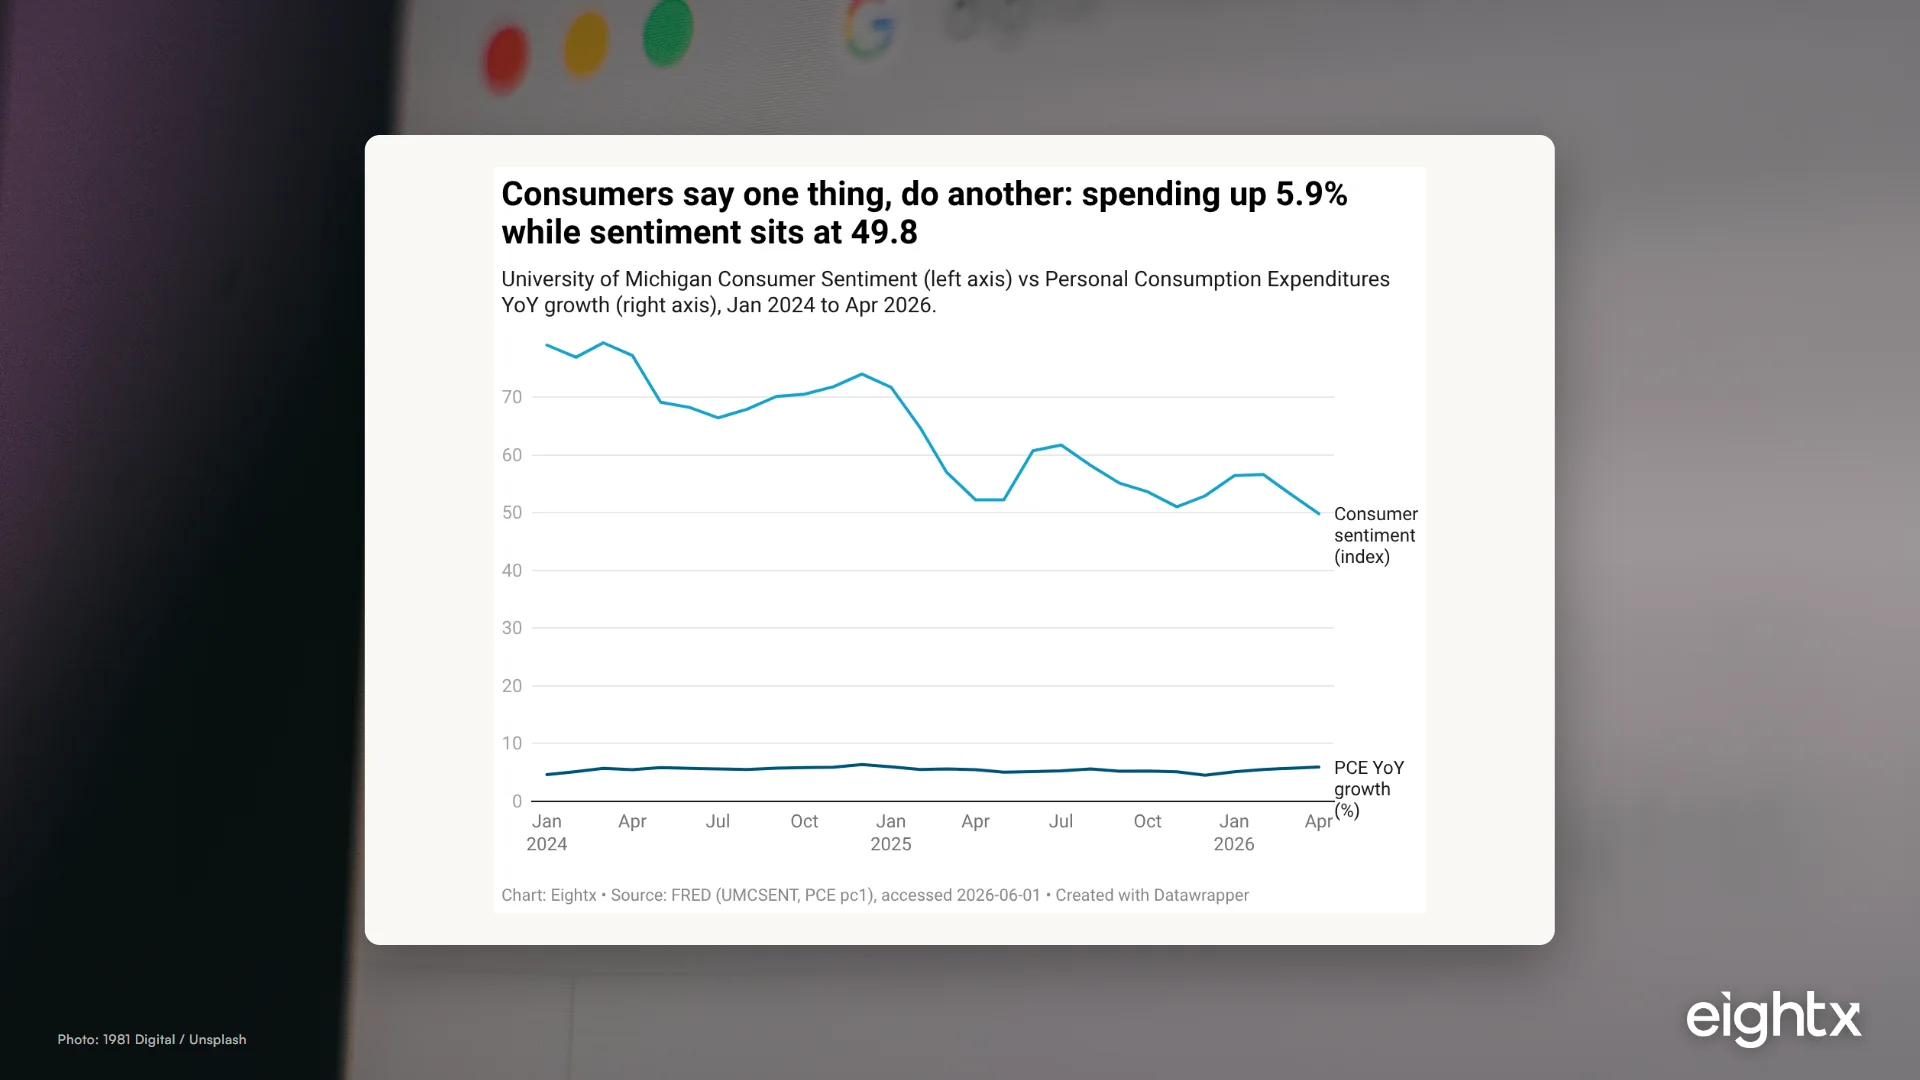
The single most striking thing about the May 2026 snapshot is the gap between PCE consumption growth and consumer sentiment. PCE personal consumption growth hit +5.94% YoY in April 2026 (FRED series PCE, units=pc1), the highest reading since December 2024. At the same time, the University of Michigan Consumer Sentiment Index sat at 49.8 in April 2026, below the 2008-2009 financial-crisis trough (55.3) and below the 1980 recession trough (51.7).
That is one of the widest demand-vs-sentiment gaps in the series' history.
The full month-by-month series:
| Month | Consumer Sentiment (UMCSENT) | PCE YoY growth |
|---|---|---|
| 2024-01 | 79.0 | +4.63% |
| 2024-12 | 74.0 | +6.38% |
| 2025-04 | 52.2 | +5.50% |
| 2025-08 | 58.2 | +5.61% |
| 2025-12 | 52.9 | +4.54% |
| 2026-01 | 56.4 | +5.12% |
| 2026-02 | 56.6 | +5.54% |
| 2026-03 | 53.3 | +5.73% |
| 2026-04 | 49.8 | +5.94% |
Two factors are driving this. First, a K-shaped consumer: the top 10% of earners now account for roughly half of US consumer spending (a Moody's Analytics figure cited in Signifyd's 2026 ecommerce report as the highest share in roughly the last 35 years). High earners are still buying. Everyone else is nervous, and the nervousness shows up in surveys. Second, an oil-price shock tied to the Iran conflict (energy +17.9% YoY in April per BLS CPI detail) that re-accelerated headline CPI and shows up immediately in sentiment surveys (gas prices are one of the most-felt line items in a household budget) even when actual nominal spending continues.
One caveat worth pricing in before the "demand is still hot" read sets your H2 plan. PCE consumption growth of +5.94% YoY is nominal. CPI is at +3.78% YoY, so real PCE growth is roughly +2.1% YoY, closer to a normal expansion than to a boom. TD Economics reported April real retail sales at -0.2% m/m even as nominal printed +0.5%. Nominal demand is still hot. Real demand is much softer. Whichever your category lives in matters: branded goods with elastic price lists ride the nominal print; lower-margin essentials live in the real print. Where the spend actually happens shifts the math too, since mobile AOV runs 70-80% of desktop AOV and the device mix moves with channel.
What to do this week: stress-test H2 2026 with a base case that includes 3-5 percentage points of nominal-demand deceleration by Q4. The gap usually closes. It just takes 2-3 quarters. None of this stress-testing works if your books are a quarter behind, which is why we are particular about who handles the ecommerce bookkeeping behind the numbers.
Cost of capital: the refinance window narrowed
The Federal Funds Rate held at 3.63% in May 2026 (FRED FEDFUNDS), effectively flat after cuts that took it from a 5.33% peak (held August 2023 through August 2025) to 3.64% by January 2026. The Fed has held the 3.50-3.75% target range for three consecutive meetings through April 2026. CPI re-acceleration is the proximate reason: CPI all-items YoY climbed from a 2.39% trough in January 2026 to 3.78% in April 2026, driven heavily by energy (+17.9% YoY in April).
For DTC operators, the practical read is that the cost-of-capital cycle has played out. Through the 170 bps of cuts from peak, the lift you saw on your floating-rate facility was meaningful (a fully-drawn $5M line at SOFR + 350 bps for 12 months would save roughly $85,000 a year on the 170 bps move; most operators run lines that are partially drawn for parts of the year, so the realized saving is smaller). That tailwind is now gone. Per CME FedWatch, Fed Funds futures are pricing flat-to-up rates through early 2027 because of the energy-driven CPI re-acceleration. (Barclays' Marc Gapen still forecasts 75 bps more cuts by mid-2026; we weight the futures view but flag the disagreement.)
Three things to do this quarter on cost of capital. First, if you have RBF or factoring at a variable rate, lock pricing on any term you can. Second, if you are talking to a new lender, push for structural concessions (personal guarantee removal, higher line limits, covenant relaxation) instead of price concessions. Per a recent conversation with one of our portfolio operators, the win at the tier-three and fintech-bank level right now is structure, not price: same headline rate, no PG, $12M limit instead of $9M. Third, reset your 2026 P&L price assumption to 3.5-4% inflation, not the 2.5% baseline most plans were built on. How hard this cycle bites also depends on your capital structure, the spread in gross margin between bootstrapped and VC-backed brands is wider than most operators assume.
Channel share: ecommerce keeps grinding higher
Retail e-commerce share of total retail sales hit 16.9% in Q1 2026 (FRED ECOMPCTSA, sourced from the US Census Monthly Retail Trade Survey). That is a new all-time high, up from 16.0% in Q1 2025 (a +0.9 percentage point gain YoY).
The line keeps grinding up even in a hot omnichannel environment. The April 2026 Census MRTS release showed total retail and food services up 4.9% YoY, while nonstore retail (the ecom-heavy bucket) was up 11.1% YoY, more than 2x the total retail rate. The structural read is the same as it has been for three years: online keeps taking share from brick-and-mortar as a delivery format. Where that share lands still matters for your P&L, the contribution margin gap between Amazon and Shopify can be the difference between a profitable channel and a vanity one.
What to do this quarter: defend your digital ad budget against any "rebalance to retail" pressure. The structural tailwind is still pulling in one direction, and it is the direction you already operate in. When you defend that budget, watch the true cost: the gap between blended and paid CAC by vertical tells you how much organic is quietly subsidizing your acquisition math.
This dashboard is one half of the macro story. For the labor-market side (job openings, layoffs, warehousing capacity), see our DTC layoff and hiring tracker which we refresh against BLS JOLTS and SEC EDGAR 8-K filings.
Labor market: retail is softening, but slowly
Retail-trade unemployment was 3.3% in April 2026 (BLS LNU04032232, not seasonally adjusted), down from 3.6% in April 2025 but up from 2.7% in April 2024. The 2-year trend is loosening. The retail-specific cohort sits below the 4.3% headline national unemployment rate.
Retail trade total employment was 15,466,300 in April 2026 (BLS CES4200000001, preliminary), down 0.42% YoY from 15,531,200 in April 2025. The retail labor market is hollowing slowly even as job openings hold.
The honest read: don't panic-hire on any headline retail-openings story. Retail openings are dominated by hourly store-side and seasonal restock roles, not the marketing, ops, and finance roles a $10-50M DTC brand actually competes for. The labor pool you compete for is loosening, not tightening.
Wallet says spend, mood says hold, rates say wait, channel says push digital, labor says be patient. The right H2 2026 plan rhymes with all five at once. Build the base case to nominal demand. Stress-test the downside to sentiment. Keep digital ad spend defended. Don't panic-hire. Get long-dated debt locked before the next CPI print confirms or denies the 3.78% number.
The May 2026 snapshot in one table
| Indicator | Latest reading | 12 months ago | YoY change | What it means for your business |
|---|---|---|---|---|
| PCE consumption growth (YoY) | +5.94% (Apr 2026) | +5.50% (Apr 2025) | +0.44 pp | Demand is still hot. Top-of-funnel is not the problem. |
| Federal Funds Rate | 3.63% (May 2026) | 4.33% (May 2025) | -0.70 pp | Refinance window narrowed. The easy cut path is done. |
| Consumer Sentiment Index | 49.8 (Apr 2026) | 52.2 (Apr 2025) | -2.4 pts | Customers are nervous. Stress-test H2 scenarios. |
| CPI all-items (YoY) | +3.78% (Apr 2026) | +2.33% (Apr 2025) | +1.45 pp | Reset price lists if you locked 2.5% inflation. |
| Retail e-commerce share | 16.9% (Q1 2026) | 16.0% (Q1 2025) | +0.9 pp | Channel keeps grinding share. Defend digital ad budget. |
| Retail trade unemployment | 3.3% (Apr 2026) | 3.6% (Apr 2025) | -0.3 pp | Mixed. Softer YoY but trending up from 2.7% in Apr 2024. |
What we are watching next month
Five catalysts could change the May 2026 read. The next CPI print lands mid-June 2026. If May CPI comes in below 3.5%, the disinflation story re-opens and the case for a June or July Fed cut firms up. If it prints above 3.8%, the Fed stays on hold longer and the "refinance window closed" framing hardens.
The May 2026 UMich consumer sentiment final release lands in June. Preliminary May-2026 reporting from external trackers suggests a print materially below the April 49.8 (in the mid-40s). If the official UMich number confirms a sub-49.8 May reading, we will swap the headline sentiment number on the July dashboard refresh. The "spending hot, sentiment cold" gap would widen, not narrow.
The next FOMC decision is June 17-18, 2026. Watch the dot plot and the SEP for any shift in the 2027 rate path. The next PCE release (May 2026 data) lands late June. Watch whether the +5.94% nominal-growth print holds or starts to fade. The next ECOMPCTSA print (Q2 2026 data) lands mid-August. This is the only quarterly indicator in the dashboard, so it is also the only one with a long gap between updates.
We will refresh this page on the first business day of July 2026 with May data for the monthly indicators and a hold on ECOMPCTSA until August.
Sources and methodology
FRED Personal Consumption Expenditures (PCE), units=pc1 (YoY percent change). Series ID PCE. April 2026 reading: +5.94%. The Bureau of Economic Analysis publishes PCE with roughly a 6-week lag, so April 2026 is the latest available point as of 2026-06-01.
FRED Federal Funds Effective Rate (FEDFUNDS), units=lin (raw percent). Series ID FEDFUNDS. Monthly average of the daily effective rate. May 2026 reading: 3.63%. The peak was 5.33% from August 2023 through August 2025; cuts began September 2025 and effectively paused at the start of 2026.
FRED University of Michigan Consumer Sentiment Index (UMCSENT), units=lin (raw index). Series ID UMCSENT. April 2026 reading: 49.8. Historical context: the 1980 recession trough was 51.7, the 2008 financial-crisis trough was 55.3, and the 2022 inflation-scare trough was 50.0. April 2026 is one of the lowest readings in the index's history.
FRED Consumer Price Index for All Urban Consumers (CPIAUCSL), units=pc1 (YoY percent change). Series ID CPIAUCSL. April 2026 reading: +3.78%. We source CPI from FRED rather than direct from BLS for consistency with the other series on this page; the underlying data is identical to the BLS release. The October 2025 reading is missing in FRED because of the BLS lapse-in-appropriations period during the late-2025 funding gap.
FRED E-Commerce Retail Sales as Percent of Total Sales (ECOMPCTSA), seasonally adjusted, quarterly. Series ID ECOMPCTSA. Built from the US Census Bureau Monthly Retail Trade Survey (MRTS). Q1 2026 reading: 16.9%, a new all-time high. Q2 2026 print expected mid-August 2026. Because ECOMPCTSA refreshes quarterly, we skip it on 2-of-3 monthly dashboard updates and note "next update Q2 2026" until August.
BLS Retail Trade Unemployment Rate (LNU04032232), not seasonally adjusted, monthly. April 2026 reading: 3.3%. We use the NSA series rather than a seasonally adjusted one because retail trade has unusual seasonal patterns (holiday and back-to-school) that benefit from being seen directly. The October 2025 reading is unavailable due to the 2025 appropriations lapse.
BLS Retail Trade All Employees (CES4200000001), seasonally adjusted, monthly. April 2026 reading: 15,466,300 jobs (preliminary). YoY change: -0.42% versus April 2025 (15,531,200 jobs).
Limitations. PCE has a roughly 6-week release lag and CPI has a roughly 2-week release lag, so the "latest available month" is always uneven across the six indicators. Dashboard convention: use the latest available month for each indicator, label clearly. October 2025 has gaps in CPI, retail unemployment, and headline UNRATE because of the 2025 appropriations lapse. May 2026 CPI was not yet released as of publish date and lands mid-June 2026. UMCSENT May 2026 preliminary is expected with the June UMich release; if confirmed materially below 49.8 we will swap the headline reading on the next monthly refresh.
Update cadence. Monthly. First business day of each month. Monthly refresh covers FEDFUNDS, CPI, UMCSENT, PCE, retail unemployment, and CES retail employment. ECOMPCTSA is refreshed quarterly and held in the interim months. Next refresh: 2026-07-01.
Frequently asked questions
why is consumer sentiment so low if people are still spending more?
Sentiment and spending have decoupled. Households are nervous about prices, jobs, and politics (sentiment is at 49.8, below the 2008 financial-crisis trough) but they are still spending in nominal dollars, in large part because the top 10% of earners now account for about half of consumer spending (per Moody's Analytics, cited in Signifyd's 2026 ecommerce report). The gap eventually closes, usually with spending rolling over 2-3 quarters after sentiment stays this low.
what does the fed holding at 3.63% mean for my dtc brand?
Two things. One, the easy cut path is done. The Fed cut 170 basis points from the 5.33% peak (held August 2023 through August 2025) through the cuts that began September 2025 and effectively paused by January 2026. Fed Funds futures (per CME FedWatch) are now pricing flat-to-up rates through early 2027 because of the CPI re-acceleration; some analysts (Barclays' Marc Gapen) still forecast 75 bps more cuts by mid-2026, but we weight the futures view. Two, your floating-rate debt and any RBF or MCA you are carrying are not getting cheaper from here. Lock pricing on long-tenor lines now if you can.
should i raise prices if cpi is back up to 3.8%?
Probably yes, but not blanket. CPI re-accelerated from 2.39% in January 2026 to 3.78% in April. If you locked a 2026 price list assuming 2-3% inflation, you are giving up real margin. The cleanest move is a 2-4% lift on your top-30 SKUs (the ones with the least price-sensitivity) and a hold on the long tail. Test with a 4-week A/B on your top-3 SKUs before rolling site-wide.
how often should i actually check these macro indicators?
Monthly is enough for most operators. FEDFUNDS, CPI, retail unemployment, and PCE all refresh on a monthly cadence. ECOMPCTSA is quarterly. The right pattern is a 15-minute review on the first business day of the month: pull the latest reading for each indicator, compare to the previous month and to 12 months ago, and write one sentence on what changed. We do this for every client we run a P&L for.
which of the 6 indicators matters most for my 10m ecom brand?
For a brand at $10-20M revenue, the two that move your decisions most are CPI (because it drives your price list and supplier renegotiation) and the Federal Funds Rate (because it drives the cost of any working-capital line or inventory financing you are carrying). PCE growth is interesting but moves slowly. Sentiment is leading but noisy. Ecommerce share is structural and shifts your ad-budget defense, not your weekly plan.
is the retail unemployment rate going up a warning sign for h2 2026?
Mixed signal. Retail-trade unemployment was 3.3% in April 2026, down from 3.6% a year ago, but up from 2.7% in April 2024. So the YoY comp is good and the 2-year trend is loosening. Total retail employment is down 0.42% YoY. The honest read: the labor market is slowly hollowing, not crashing. Don't panic-hire on any retail-openings headline; openings skew hourly store-side, not the marketing and ops roles a DTC brand actually competes for.
why does ecommerce share keep climbing even when sentiment crashes?
Two structural reasons. One, online keeps taking share from brick-and-mortar as a delivery format, regardless of mood. Two, AI shopping referrals are inflecting (Signifyd reported 1,247% growth in AI-referral conversions in late 2025) which is a brand-new growth lane for sites that show up in AI search. Sentiment moves with mood. Channel share moves with infrastructure.
what's the historical sentiment-spending gap and what usually happens next?
Sentiment well below its long-run norms while nominal PCE is still growing at 5%+ is one of the widest demand-vs-sentiment gaps on record. The gap has been open since at least March 2025, when UMCSENT first crossed below 65 while PCE was still printing above 5% YoY. This is the second year of the gap. Historical pattern: when this gap persists for 3 or more quarters, spending eventually rolls over within 2-3 quarters. Plan H2 2026 with a base case that includes a 3-5 percentage point deceleration in nominal demand by Q4.