
eCommerce
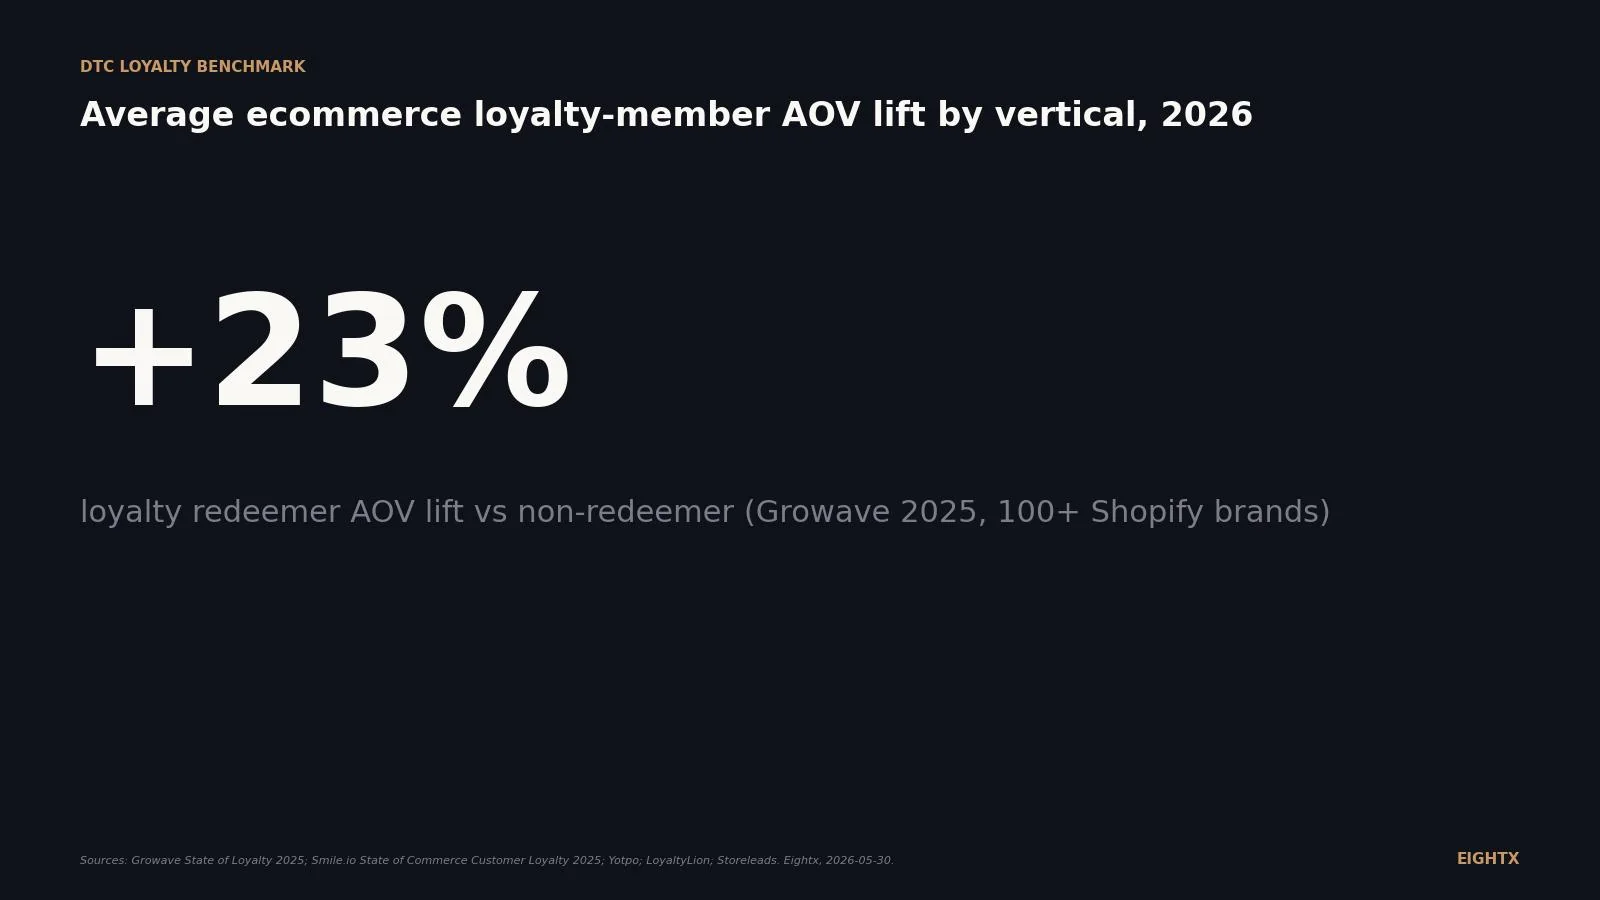
Average ecommerce loyalty-member AOV lift by vertical 2026: +23% panel result, +31% beauty, +73% VIP tier
Loyalty redeemers spend 23% more per order than non-redeemers across a 100-plus Shopify brand panel (Growave 2025), with beauty running to 31% and VIP-tier members hitting 73% AOV lift versus baseline shoppers. The financial case is not program cost versus revenue lift. It is the 23 to 31 point spread applied to a segment that already buys more frequently, compounding LTV at both ends.
Key Takeaways
- Loyalty redeemers spend roughly +23% more per order than non-redeemers, based on Growave's 2025 panel of 100+ Shopify brands. Smile.io's beauty and food & beverage learn pages put the figure at +31%. Yotpo's published +10% target is a vendor floor, not the real-world median.
- VIP-tier members hit a +73% AOV lift over non-tier customers (Growave 2025). Programs running flat points-only mechanics are capturing roughly one third of the available AOV lift. The tier mechanic, not points alone, is what moves the basket.
- AOV is the smallest of the four loyalty lifts. Redeemers post +428% on repeat purchase rate, +367% on repeat customer rate, +67% on purchase frequency, and +23% on AOV. Most of the program economics come from frequency and repeat rate, not bigger baskets.
- Vertical matters more than the headline. Smile.io's 2025 report (100,000+ merchants, 585M orders) shows CPG purchase frequency +13.95% YoY, Recreation +8.68%, Home Goods CLV +6.46% (the lowest). Clothing and Jewelry lead on CLV growth. Match your loyalty mechanic to the metric your vertical actually lifts.
- Roughly 95,000 Shopify stores run a top-4 loyalty app (Smile.io 61,613, Swell/Yotpo Loyalty 13,408, Growave 13,066, LoyaltyLion 6,951; Storeleads, May 2026). That is about 2-3% of Shopify's active base, so loyalty is still early-adopter in the long tail and near-universal in the $1M+ revenue band where most DTC operators sit.
If you run a Shopify brand and you set up a loyalty program in the last 12 months, you probably do not know whether your members actually spend more per order than your non-members, and you almost certainly do not know whether your lift is good or bad relative to your category. The 2025-26 vendor benchmarks now agree on a directional answer. Loyalty redeemers spend roughly 23-31% more per order than non-members. VIP-tier members hit +73%. Yotpo's published +10% AOV target is a vendor floor, not the real-world median.
This page is the operator-facing benchmark table for what loyalty actually delivers per vertical in 2026: what number to target, what the program-design implications are, and where Yotpo's "good enough" +10% AOV / +15% repeat-rate target is the wrong reference point if you want to fund the program properly.
The +23% redeemer AOV lift is the real benchmark
Yotpo's published guidance puts the 12-month "good enough" target at +10% AOV and +15% repeat purchase rate. That is the vendor floor. The Growave 2025 panel of 100+ Shopify brands reports +23% AOV for redeemers vs non-redeemers, and Smile.io's vertical learn pages for beauty and food & beverage report +31%. The Growave panel also puts VIP-tier members at +73% AOV vs non-tier customers.
The chart frames the size of the gap. Yotpo is not wrong, it is just describing a different thing. A vendor target written for a brand-new program at month 12 is going to land below the panel benchmark for programs that have been live longer and that have a redeemer cohort with several reward cycles under their belt. The operator read: if your program is at +10% AOV after 12 months and you treat that as success, you are leaving roughly +13 percentage points on the table relative to the Growave panel result, and roughly +21 points relative to a well-designed beauty program. At constant order volume and ignoring program cost, on a $5M loyalty cohort the gap from +10% to +23% is roughly $650K in incremental order value per year.
The other operator read: VIP tier is the biggest lever. The +73% lift on tier members is not "redeemers vs non-redeemers." It is "tier members vs everyone else, including non-tier members of the same program." Programs running flat points-only mechanics capture roughly one third of the available AOV lift. If your program does not yet have three tiers with differentiated benefits at each level, that is the first place to look before you change vendors.
AOV is the smallest of the four loyalty lifts
The Growave panel data is most useful when you read all four metrics together, not just AOV. Redeemers post +428% on repeat purchase rate (65% vs 12.3%), +367% on repeat customer rate (50% vs 10.7%), +67% on purchase frequency (2.0 vs 1.2 orders per year), and +23% on AOV (index of 123 vs 100). AOV is the smallest gap of the four.
Why this matters for your business: most of the program economics come from frequency and repeat rate, not bigger baskets. A redeemer ordering 2.0 times per year at a 23% higher basket is contributing roughly 2.05x the revenue of a non-redeemer who orders 1.2 times per year at the baseline basket (2.0/1.2 x 1.23 = 2.05). The frequency lift carries most of that 2.05x. Operators benchmarking only on AOV are framing the program wrong, and they often set incentives that protect the basket at the cost of the cadence.
Metric Redeemer Non-redeemer Lift Repeat purchase rate 65% 12.3% +428% Repeat customer rate 50% 10.7% +367% Purchase frequency 2.0 orders/yr 1.2 orders/yr +67% Average order value (indexed) 123 100 +23% VIP-tier AOV vs non-tier n/a n/a +73%
One clarification matters here. "Redeemer" and "loyalty member" are not the same population. A redeemer has redeemed a reward at least once. A member is anyone signed up. Members who never redeem behave roughly like non-members on the basket. When you read +23% as "loyalty members get a 23% lift," you are over-stating it, because the average across all members (redeemers plus never-redeemed) is lower than the +23% redeemer figure. Track redemption rate as a leading indicator of where the +23% benchmark applies in your own program.
Vertical by vertical: where loyalty actually lifts what
Smile.io's 2025 report covers 100,000+ merchants, 148 countries, and 585 million orders. It is the cleanest vertical-vs-mechanic table available in the public market. The 2024-vs-2023 year-over-year changes break the headline number down by category. CPG purchase frequency climbed +13.95% YoY, Recreation +8.68%, Home Goods CLV +6.46% (the lowest), and Clothing and Jewelry led CLV growth.
The chart reads the same two stories the data does. CPG and Recreation are frequency stories. Clothing and Jewelry are lifetime-value stories. Home Goods is a low-frequency, mid-CLV category that does the work over years, not quarters. Beauty sits in the middle on both axes but punches above its weight on repeat purchase rate (Smile.io's beauty learn page flags top performers above +20% repeat-purchase rate in year one and 2.5x higher purchase frequency in case studies).
Vertical Strongest loyalty lift (Smile.io 2025) Numeric anchor CPG (food, beverage, household) Purchase frequency +13.95% YoY Recreation / sporting goods Purchase frequency +8.68% YoY Clothing / apparel Customer lifetime value Top-tier CLV growth Jewelry CLV + redemption rate Top-tier CLV; +48% redemption (top-performer case) Beauty Purchase frequency + repeat purchase rate +20% repeat-purchase rate (top performers); 2.5x frequency (case) Home & lifestyle CLV (lowest growth) + frequency +6.46% CLV; 2x frequency (case study)
The operator read by vertical is straightforward. If you sell CPG or beauty, design the program around frequency: subscription pricing, reorder reminders, sample bundling into the second order, points that expire on a quarterly cycle. If you sell apparel or jewelry, design around CLV: tier perks that reward the customer at year two and three, early access to drops for VIPs, loyalty-only product. If you sell home or lifestyle, design around redemption depth: the customer orders less often, so each loyalty interaction has to do more work.
The Shopify loyalty-app landscape: lopsided
Across the top four loyalty apps on Shopify, the active install base totals roughly 95,000 stores. That is about 2-3% of Shopify's roughly 3.5 million active stores, so loyalty is still an early-adopter mechanic in the long tail and near-universal in the $1M+ revenue band where most DTC operators sit. The distribution between the top four is lopsided.
App Active Shopify installs Best fit (operator read) Smile.io 61,613 Default for $1-20M brands; cleanest UX; large free tier Swell (Yotpo Loyalty) 13,408 $10-50M brands wanting reviews + SMS + loyalty bundle Growave 13,066 $1-10M brands wanting reviews + wishlist + loyalty all-in-one LoyaltyLion 6,951 $20M+ brands with retention-led growth; strongest analytics
Smile.io powers roughly 5x more Shopify loyalty programs than the next-largest competitor. That share advantage matters because Smile.io's published benchmarks (including the +31% AOV figure for beauty and food & beverage) draw from a larger pool of actual program data than any single competitor can match. If your decision is "what vendor do I pick and what target do I set," Smile.io's data is the largest reference set, and Growave's is the most recent and most detailed at the program-mechanic level.
Enterprise comparables: what Ulta and Sephora actually tell you
If you have read any beauty-retail analysis in 2025-26, you have seen the headline numbers. Ulta loyalty members drive 90-95% of total company sales (per Ulta corporate disclosures, cited in BeautyMatter's Q3 2025 analysis). Sephora Beauty Insider drives roughly 80% of North American sales. Nike Membership shows roughly +40% higher purchase frequency than non-members.
Those numbers are real, but they are the wrong reference for a $5-50M Shopify brand. They are "share of revenue from members" or "frequency lift at full saturation," not "AOV lift per order." Different metric, different denominator. Ulta has had a loyalty program for over a decade with tens of millions of members across a category that has near-universal U.S. coverage. Sephora's program has had a similar runway. The fact that 90-95% of Ulta's revenue is from members tells you what saturation looks like at the top end. It does not tell you what to target in the first 24 months of a new Shopify loyalty program.
The transfer-lesson worth taking from enterprise: member depth, not member breadth. Ulta and Sephora win because their top-tier members are heavy repeat buyers, not because every shopper is signed up. The Growave +73% VIP-tier figure is the same insight at a smaller scale. Design the program for the depth of the top tier, then let the breadth follow.
What this means for your 2026 loyalty plan
Three concrete actions for the operator reading this in 2026.
Set the right target. At 12 months post-launch, target +23% AOV (the Growave panel result) and +67% purchase frequency (the same panel), not Yotpo's +10%. If your vertical is beauty, food & beverage, or CPG, set the AOV target at +31% and design the program around frequency. If your vertical is apparel or jewelry, set the CLV growth target above +10% YoY and design the program around tier depth.
Build the tier mechanic before you build more points. The +73% VIP-tier AOV lift is the largest single signal in the dataset. In the Growave panel, the tier mechanic captures the +73% lift on VIP-tier members vs non-tier customers in the same program, while the blended redeemer figure (most of which comes from points-only mechanics) sits at +23%. No public report runs a head-to-head of tiered programs vs points-only programs, so treat this as a within-program signal, not a vendor comparison. If you already have tiers, audit whether the top-tier perks are actually different in kind (early access, free shipping, dedicated CX) or just different in degree (more points per dollar). Different in kind moves the basket more.
Pick the vendor that matches your stage. Smile.io is the default at $1-20M for the UX and the large free tier. Swell or Yotpo Loyalty is the right call at $10-50M if you want the reviews and SMS bundle. LoyaltyLion is the right call at $20M+ if your growth model is retention-led and you need stronger analytics. Growave is the budget multi-tool play at $1-10M. None of these vendors is wrong, but none is right for every stage.
The +23% AOV lift is the floor a working loyalty program clears at 12 months, not the ceiling. The bigger story sits two columns over: +67% purchase frequency, +428% repeat purchase rate, and +73% VIP-tier AOV. If your program is delivering +10% AOV and flat frequency, you have built a coupon, not a loyalty program.
Sources and methodology
The Growave State of Loyalty 2025 report analyzes loyalty performance across 100+ Shopify brands using Growave's platform. Headline figures from the panel: redeemer AOV +23% vs non-redeemer (indexed at 123 vs 100); repeat purchase rate 65% (vs 12.3% non-redeemer); repeat customer rate 50% (vs 10.7% non-redeemer); purchase frequency 2.0 orders per year (vs 1.2 non-redeemer); VIP-tier AOV +73% vs non-tier customers. The panel skews to Growave's customer profile (typically smaller Shopify SMB and mid-market), so the numbers are most directly applicable to brands at $1-20M in revenue running an all-in-one tool.
The Smile.io State of Commerce Customer Loyalty 2025 report covers 100,000+ ecommerce merchants in 148 countries and 585 million orders, comparing 2024 to 2023 on repeat customer rate, AOV, purchase frequency, and customer lifetime value by industry. Explicitly published year-over-year figures: CPG purchase frequency +13.95%; Recreation +8.68%; Home Goods CLV +6.46% (the lowest). Clothing and Jewelry led CLV growth. The remaining vertical cells in the chart above are directional approximations until Smile.io publishes the full PDF tables. The Smile.io beauty and food & beverage learn pages source the +31% redeemer AOV figure and the +7% annual purchase-frequency figure for food & beverage redeemers, plus case-study numbers (2.5x beauty frequency, +48% jewelry redemption, 2x home & lifestyle frequency) that are top-performer outcomes rather than category averages.
The Yotpo guidance on +10% AOV and +15% repeat-purchase-rate targets at 12 months is from Yotpo's "Customer Loyalty Programs For Retail: A Guide To Growth," positioned as the floor benchmark for new programs. LoyaltyLion's 2025 consumer-confidence research adds that active members are 4x more likely to repeat-purchase than non-members during periods of low consumer confidence, which matters as a 2026 planning input given the broader retail conversion-rate compression.
The Storeleads installed-app counts (Smile.io 61,613; Swell 13,408; Growave 13,066; LoyaltyLion 6,951) were pulled via the Storeleads MCP, filtered to active Shopify installs as of 2026-05-29. Counts include any store with the app installed and active and are not gated on store revenue tier, so the long-tail bias is real. Vertical-specific install splits inside the loyalty-app cohort were not retrievable in the same query.
Enterprise comparables (Ulta 90-95% of total sales from members, Sephora Beauty Insider roughly 80% of NA sales, Nike Membership +40% frequency vs non-members) were sourced from BeautyMatter's Q3 2025 analysis of Ulta, Sephora corporate-cited via LoyaltyLion's 2025 roundup, and multiple third-party Nike analyses from 2024-25. These are "share of revenue from members" and "frequency lift" figures, not "AOV lift per order," and should not be directly compared with the Growave or Smile.io AOV benchmarks.
Limitations to flag. First, no public benchmark report gives a single "loyalty-member AOV lift, broken by vertical, all in one table"; every vendor publishes a different slice and operators have to assemble the cross-vertical view from multiple sources. Second, vendor-published benchmarks are not independently audited. Third, redeemer is a different population from member, and the redeemer numbers always look better; readers should clarify the distinction before applying any of these numbers to their own dashboard. Fourth, the Smile.io vertical case-study numbers are top-performer outcomes, not category averages, and were labeled as such in the table above. Fifth, the operator-voice signal in this post draws on nine retrieved segments from the Eightx founder-call library across the loyalty, AOV, and tier-mechanic topic clusters; all client names were removed before drafting per the publishing checklist.
This page is refreshed quarterly. The next refresh target is August 2026, which is roughly when Smile.io's annual update typically lands and when the Storeleads installed-app counts will have moved enough to be worth re-pulling.
For related operator benchmarks see our average ecommerce repeat purchase rate by vertical post and our average AOV by ecommerce vertical post. For the cost-of-capital lens on funding a retention program, see our fractional CFO services overview.
Frequently asked questions
what is the average aov lift for loyalty program members vs non-members in 2026?
Across the public benchmarks, loyalty redeemers spend roughly 23-31% more per order than non-redeemers. The Growave 2025 panel of 100+ Shopify brands reports +23%. Smile.io's beauty and food & beverage learn pages report +31%. The VIP-tier mechanic adds another lift on top, with Growave putting tier members at +73% vs non-tier. Be careful to compare redeemer figures to redeemer figures, not redeemer to total member, because not every member ever redeems.
is +10% aov lift a good loyalty program result or am i underperforming?
+10% is Yotpo's published "good enough" floor at 12 months post-launch. The real-world panel benchmark for redeemers in 2025 is roughly +23%, and beauty and food & beverage hit +31%. If your program is at +10% AOV after a year, you are at the vendor floor, not the panel benchmark. At constant order volume and ignoring program cost, the gap from +10% to +23% on a $5M loyalty cohort is roughly $650K in incremental order value per year, which is the part of the program economics most operators do not size before they pick a vendor.
how much should a vip tier add to loyalty member aov?
Growave's 2025 panel puts VIP-tier members at +73% AOV vs non-tier customers. The tier mechanic, not points alone, is what moves the basket the most. Programs running flat points-only mechanics capture roughly one third of the available AOV lift. If you do not have at least three tiers with differentiated benefits, that is the first place to look before you change vendors.
why does smile.io report a higher aov lift than yotpo for the same metric?
Different denominators and different cohorts. Yotpo's +10% is a published target for new programs at 12 months, framed as "what most operators should aim for." Smile.io's +31% is observed performance in two specific verticals (beauty and food & beverage) where the program is well-suited to the buying pattern. Growave's +23% is panel-wide across 100+ Shopify brands. Match the benchmark to your stage, vertical, and program maturity before you judge yourself against it.
should i be benchmarking loyalty against ulta and sephora or against shopify panel data?
If you are under $50M in revenue, benchmark against the Shopify panel (Growave and Smile.io), not Ulta and Sephora. Ulta's 90-95% of sales from members and Sephora's roughly 80% are "share of revenue from members," not "AOV lift per order." Different metric, different denominator, different stakes. The enterprise numbers tell you what loyalty looks like at saturation; the Shopify panel tells you what the next 12 months of program build should target.
what loyalty metric should i actually focus on if i sell beauty vs apparel vs home goods?
Beauty and CPG convert loyalty into purchase frequency (Smile.io shows +13.95% CPG frequency YoY; beauty top performers raise repeat purchase rate above 20% in year one). Apparel and jewelry convert it into customer lifetime value (Smile.io flags Clothing and Jewelry as the CLV growth leaders). Home Goods is a CLV story but at the low end of the table (+6.46% YoY). Pick the lift your category actually delivers, then design the program to it.
is the +23% aov lift for redeemers or for all program members?
Redeemers. A redeemer is someone who has redeemed a reward at least once. A loyalty member is anyone signed up. Members who never redeem behave roughly like non-members on the basket, so blending them in dilutes the lift. The +23% number is the gap between the redeemer cohort and non-redeemer customers in the Growave panel.
should i build my loyalty program with smile.io, yotpo, growave, or loyaltylion in 2026?
Storeleads shows Smile.io with 61,613 active Shopify installs, Swell (Yotpo Loyalty) with 13,408, Growave with 13,066, and LoyaltyLion with 6,951. Default to Smile.io at $1-20M (cleanest UX, large free tier). Pick Swell or Yotpo at $10-50M if you want reviews, SMS, and loyalty bundled. Pick LoyaltyLion at $20M+ if you run a retention-led growth model and need strong analytics. Pick Growave at $1-10M if you want a multi-tool (reviews, wishlist, loyalty) on a budget.