
Insights
Average ecommerce repeat purchase rate by vertical, 2026: Chewy's 83% is the ceiling, fashion's 26% is the floor
Repeat purchase rate ranges from 83% at Chewy and 79% at Wayfair down to 26% in fashion, based on 2026 benchmarks across 15 or more verticals. Consumables run 35 to 55%, apparel 20 to 35%, and electronics 10 to 20%. The vertical you operate in sets a structural ceiling on repeat rate, so LTV models built on a category-average repurchase assumption will overstate retention for low-frequency verticals.
Key Takeaways
- The cross-vertical average ecommerce repeat purchase rate is 28.2% (StoreGrowers 2026 panel). Under 28% means the retention engine is broken. Above 40% means you have earned subscription or replenishment economics.
- Chewy ran 83.3% of FY2025 net sales through Autoship customers ($10.50B of $12.60B). Wayfair landed 79.1% of Q4 2025 orders delivered from repeat buyers (8.8M of 11.1M). Those are category ceilings, not averages.
- 30-day RPR is welcome-flow conversion, not retention. The 90 and 365-day windows are the LTV-predictive ones. Food & beverage compresses 64% of its 12-month repeat into the first 30 days; apparel only 55%.
- The right RPR view is cohort-by-acquisition-month, not aggregate. Aggregate RPR hides the difference between a cohort that is churning out and one that is still in-window. Cohort it first, then benchmark.
- Subscription mechanics turn a 25-35% RPR vertical into a 50-70% one. For supplements, coffee, and beauty, that swing is the structural arbitrage every operator should price. Loyalty programs add another 20-27 percentage points if you actually market them.
Repeat purchase rate (RPR) is the single most under-benchmarked metric in DTC ecommerce because most operators see one blended number (the famous 28.2% cross-vertical average) and never look at the spread underneath. The 2026 data tells a much sharper story: consumables sit at 35-55% on a 365-day basis, apparel at 20-35%, electronics at 10-20%. Subscription mechanics turn a 25-35% RPR category into a 50-70% one. Public DTC anchors push the ceiling much higher, with Chewy at 83.3% of net sales from Autoship customers and Wayfair at 79.1% of orders delivered from repeat buyers. This is the living index, refreshed quarterly, with the vertical table, the windowed (30-day vs. 365-day) cut, the public-co tracker, and the operator playbook for moving your own number. Next update target: August 29, 2026, when the next Shopify benchmark refresh and the bulk of Q2 2026 public DTC 10-Qs land.
The benchmark every operator should anchor to (and the one most use that's wrong)
Most operators see "the average ecommerce repeat purchase rate is 28%" and benchmark themselves against it. The benchmark exists, it is real, and using it as the anchor is the single most common retention-metric mistake in DTC.
The 28.2% number is the StoreGrowers 2026 cross-vertical panel average. It is confirmed by the Bluecore Customer Growth Benchmarks (via a 2025 secondary synthesis) at a 25-30% blended band. Shopify-specific stores cluster around 27%. As a market floor it is useful: under 28% your retention engine is broken; above 40% you have earned subscription or replenishment economics.
But the cross-vertical number hides a 4x spread. CBD sits at 36.2% annual RPR. Tea sits at 20.9%. Sport apparel beats general apparel by 7 percentage points because of replenishment-style purchase rhythm. The category sets the ceiling, and benchmarking against the cross-vertical median is benchmarking against the wrong physics.
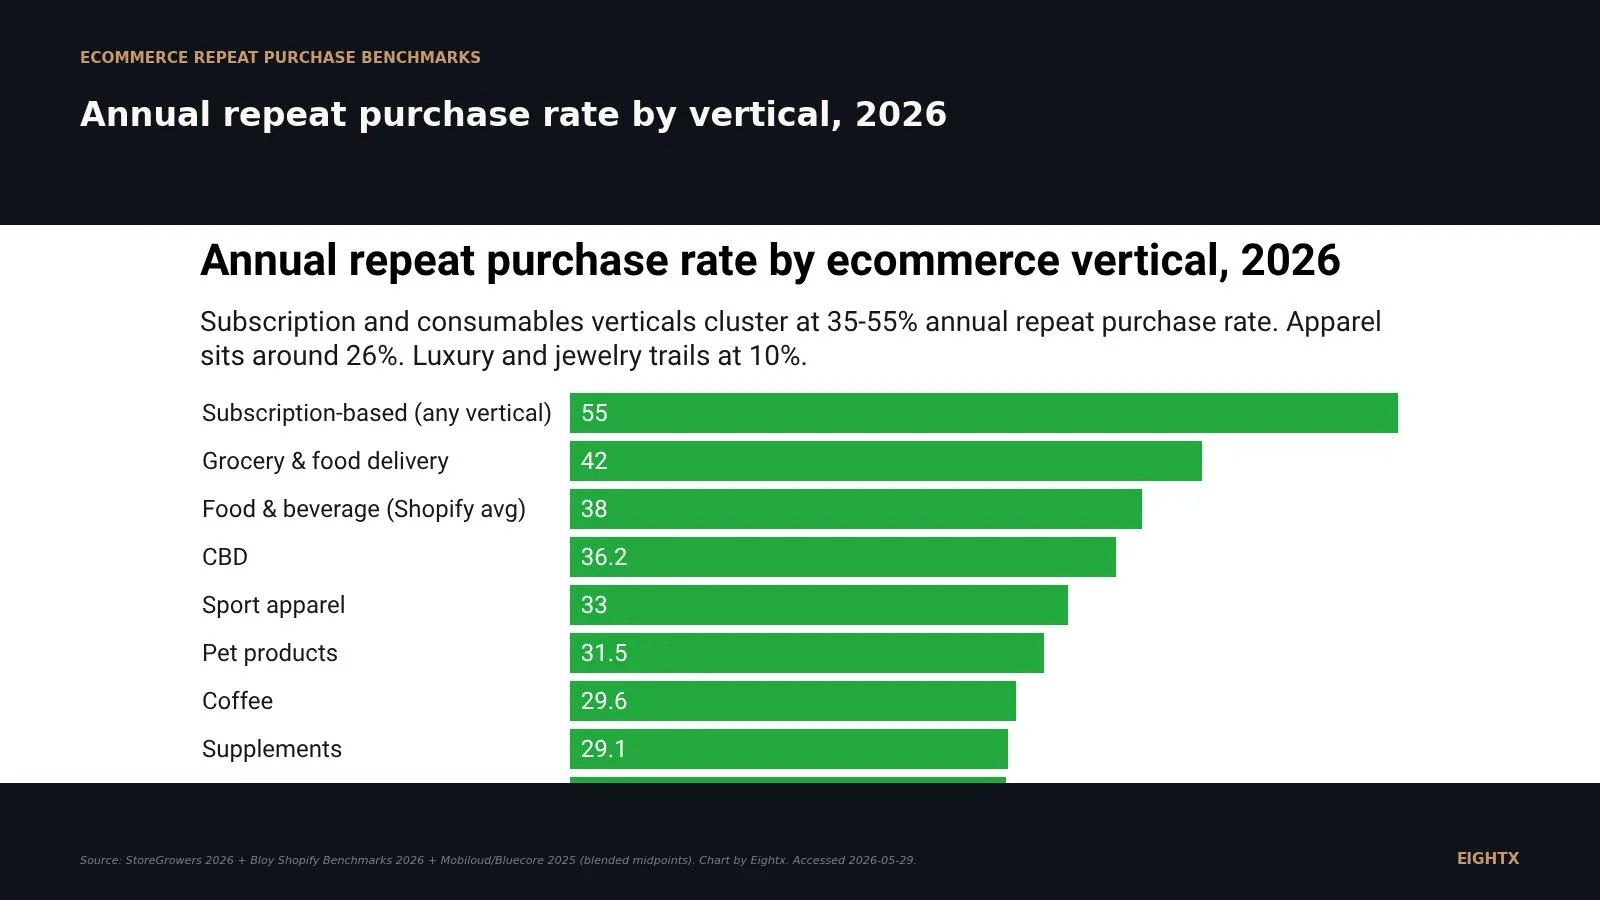
Here is the vertical-by-vertical breakdown.
A few operator reads on the chart.
Subscription-led brands hit 55%+ regardless of vertical because the mechanic, not the category, is doing the work. If you are in supplements, coffee, beauty, or pet, the subscription cohort is your structural arbitrage. A 29% supplements RPR becomes 55-70% when you put it on subscription, which is the entire venture-backed-consumables thesis from 2018-2024 and is still the thesis in 2026.
Grocery, food and beverage, and CBD lead non-subscription categories at 36-42% annual RPR because consumption frequency drives reorder rhythm. You finish the bag, you reorder. There is no "I wore this once and it's still in my closet" friction.
Pet, coffee, supplements, and meal deliveries cluster at 29-32% despite being archetypal repeat-purchase categories. The reason: most brands in these categories have not layered subscription on top. The category is repeatable; the brand has not engineered the repeat.
Apparel and cosmetics sit at 26-28%, which is the StoreGrowers "general DTC" zone. The lever here is not category physics (you cannot make customers wear out a t-shirt faster); it is bundle size, post-purchase product mix, and brand affinity (loyalty).
Home, electronics, luxury, and jewelry trail at 10-20% because the categories are structurally one-and-done. The unit economics have to clear in transaction one because there often is not a transaction two. We say this every quarter and operators in these categories keep building 24-month LTV models against 15% repeat rates. Stop.
30-day, 90-day, 365-day: which window actually predicts LTV
The blended annual number is one cut. The windowed cut is the more operationally useful one because it tells you when, in a customer's lifecycle, the repeat actually shows up.
The only public source that publishes 30-day vs. 365-day RPR by vertical on the Shopify panel is Bloy (2026 edition). Their data shows that for consumables, the 12-month repeat is heavily front-loaded; for apparel and luxury, it is back-loaded.
Three patterns.
Food and beverage compresses about 64% of its 12-month repeat into the first 30 days (derived from Bloy 2026: 35% 30-day midpoint / 55% 365-day midpoint). A coffee customer who is going to repeat at all usually does so before their first bag is finished. That makes the 30-day RPR the leading indicator for the category; if your 30-day F&B number is below 30%, your 365-day number is almost certainly below 50%, regardless of what your retention dashboard tells you.
Apparel hits only 55% of its 12-month repeat in the first 30 days (Bloy 2026: 22% 30-day midpoint / 40% 365-day midpoint). That is structurally different. Apparel customers wear the item for 4-9 months before they need or want a replacement, so the repeat shows up in months 4-12, not month 1. If you are benchmarking apparel retention on 30-day RPR, you are measuring welcome-flow conversion, not retention.
Luxury and high-ticket sit at 7% 30-day, 25% 365-day. Only one in fourteen luxury customers reorders within 30 days, but the year shape catches up to a respectable 25%. If you run a luxury brand and you panic at a low 30-day number, you are panicking at the wrong thing.
The general rule: 30-day RPR is a welcome-flow conversion metric. 90-day RPR is the leading indicator of retention (no public source publishes it cleanly by vertical, but it sits roughly halfway between 30-day and 365-day on a concave curve for consumables, convex for apparel). 365-day RPR is the LTV anchor.
What public DTC discloses (and what it tells you about your category ceiling)
The benchmarks above are panel medians. Public DTC disclosures give you the ceiling, the brand that ran the playbook to its structural limit and reports the number to investors.
There are four cleanly disclosed public-DTC repeat-customer numbers we track each quarter, plus two we estimate from active-customer and ARPC math.
Company Vertical Metric disclosed FY2024 FY2025 (or latest) Source Chewy Pet Autoship customer sales / net sales n/d 83.3% Chewy Q4 FY25 EX-99.1 Wayfair Home Repeat customer orders / total orders delivered (Q4) n/d 79.1% Wayfair Q4 FY25 release FIGS Apparel (medical) Active customers (trailing 12 mo) 2.7M 2.9M FIGS Q4 FY25 release FIGS Apparel (medical) Net revenue per active customer $208 $216 FIGS Q4 FY25 release Warby Parker Eyewear Active customers (trailing 12 mo) ~2.51M ~2.69M (Q1 FY26) Warby Q1 FY26 release Warby Parker Eyewear Average revenue per customer (TTM) $303 $331 (Q1 FY26) Warby Q1 FY26 release Allbirds Apparel/footwear % net revenue from repeat customers n/a 53% (FY20 baseline, not updated) Allbirds S-1
Two things to take from the table.
Chewy at 83.3% is the pet ceiling. That is what a category-killer retention curve looks like when you put a high-frequency-consumption product on autoship and run the playbook for a decade. No private brand at $5-50M revenue is going to hit 83% RPR; the realistic target for a healthy pet brand in your scale band is 35-50% on the panel, with stretch goals of 60-70% if you go subscription-heavy. Chewy is the math you can model toward, not the math you start at.
Wayfair at 79.1% is more interesting because home and furniture is structurally a low-frequency category. The Shopify home and furniture panel median is 20% annual RPR. Wayfair's repeat-customer-orders share is 79.1%. The difference is scale and assortment. Wayfair has 21.3M active customers across 30+ product categories; once you bought a couch, you might buy lamps, rugs, kitchen items. The lesson for a $10M home brand is that vertical expansion (one customer buying across multiple categories) is the only way home brands escape the structural 20% panel median.
FIGS and Warby Parker disclose active customers and ARPC instead of RPR. It is a softer signal but the same data shape: trailing-12-month buyers grew 7.4% at FIGS, ARPC grew 3.8%. That implies a stable repeat customer base growing modestly faster than acquisition. Warby's $331 ARPC is what eyewear unit economics look like when you have a 24-month repurchase cycle and AOV in the $80-180 range; the high ARPC compensates for the slow repeat.
Allbirds is the cautionary case. The most recent "% net revenue from repeat customers" any public apparel brand has cleanly disclosed in the last five years is Allbirds' FY2020 number (53%). It is stale, the company has restructured, and we leave it in the table for context only.
Vertical-by-vertical reference table (with the math that actually moves it)
Pull the panel medians, the windowed cut, and the public-DTC ceiling into one table. This is the working reference for "what should I be hitting and where is my upside?"
Vertical Annual RPR avg (%) 30-day RPR (%) 365-day RPR (%) Public-DTC ceiling Subscription (any vertical) 55 40+ 70+ Chewy FY25 Autoship 83.3% Pet 31.5 28 55 Chewy FY25 Autoship 83.3% Food & beverage 24.5 (StoreGrowers "food") 35 55 Shopify high end (Bloy) 55% Beauty & skincare 28 30 50 OSEA loyalty redeemers 77% Supplements 29.1 30 48 Top quartile 50% Sport apparel 33 25 42 n/a Apparel & fashion 26 22 40 Allbirds FY20 53% Home & furniture 20 18 34 Wayfair Q4 FY25 repeat orders 79.1% CBD 36.2 32 55 n/a Coffee 29.6 28 52 n/a Electronics 17 8 25 n/a Luxury & jewelry 10 7 25 n/a
Three movers operate on this table.
Subscription is the cheat code. Layer a subscription mechanic on supplements, beauty, coffee, or pet and you pull 365-day RPR from the 28-32% category midpoint to 55-70%. The math behind this is monthly retention of 92-96% (2026 vendor retention compilations), or 4-8% monthly churn. The same compilations report 12-month cohort retention of 45-65% (a standalone figure, not derived from the monthly churn band. Pure churn-compounding alone gives roughly 37-61%; the 45-65% number reflects subscription brands that re-engage churned cohorts). Either way, that is structurally a different LTV profile from a transactional version of the same category, and it is why every venture-backed consumables brand in the last decade was a subscription brand.
Loyalty programs you actually market move RPR by 20-27 percentage points. Smile.io's 2026 data. The trap is that most loyalty programs sit on the site, customers do not know they exist, and the operator measures "the program does not work." The program is fine; the marketing of it is not. Surface it in welcome flows, on the cart, in post-purchase emails, in tier upgrade emails. OSEA Malibu hits 77% RPR among reward redeemers because reward redeemers know they are reward redeemers.
Bundle and subscription cadence engineering is the third lever. A senior partner on one of our recurring client calls walks operators through this every quarter: if you sell a 90-capsule supplement that customers actually consume over 2.5 months, do not default to monthly subscription. Try bi-monthly. Customers forget to cancel, you get four months of extra retention per bundle cycle, churn drops, RPR climbs. We have seen this take a 29% category midpoint RPR to 50%+ on the subscription cohort.
What "good" looks like at $5M, $20M, $100M revenue inside your vertical
Here is how to read the table when you are pricing your own retention.
At $5M revenue, you typically index 30-50% below the published panel median for your vertical. That is not a moral failing; it is the lack of retention infrastructure (email and SMS automation, post-purchase product mix, loyalty program, subscription mechanic) the median brand has. A $5M apparel brand at 18% 12-month RPR is panel-typical for its size band. The lever is building one of those infrastructure pieces every quarter for the next two years, not benchmarking against $30M apparel brands.
At $20M revenue, you should be at or above the published panel median. $20M apparel should hit 28-35% RPR. $20M supplements should hit 35-45%. $20M pet should hit 40-50% with subscription, 30-35% without. Below that and the retention engine is the constraint. Above that and CAC is usually the lever; your back-end pays you back, so you have room to spend more on acquisition.
At $100M revenue, you are operating against the public-co ceilings. The reference set is Chewy, Wayfair, FIGS, Warby Parker. Your panel median is no longer the right anchor because you are big enough that the panel is the brands behind you. A $100M pet brand benchmarks against Chewy's 83% (and falls short, which is fine); a $100M home brand benchmarks against Wayfair's 79% repeat-order share. Apparel brands have no clean public-co peer at scale (no public DTC apparel brand discloses RPR cleanly other than Allbirds' stale 53%), so the right anchor at $100M apparel is FIGS' active-customer growth and ARPC trajectory.
The CFO question to ask in every band is the same: is my RPR healthy because the category gives me a high ceiling (consumables, subscription, pet), or am I structurally constrained (electronics, luxury, low-frequency home) and need to compete on AOV and contribution margin instead?
The right RPR view is cohort-by-acquisition-month, not aggregate company-wide. Aggregate RPR hides the difference between a cohort that's churning out and one that's still in-window. If you're growing 30% YoY, your aggregate RPR is structurally biased downward because half your customers haven't been around long enough to repeat. Cohort it first, then benchmark.
The mechanical implication: most "my RPR is dropping" diagnoses we see on operator calls are actually "my growth is accelerating and my aggregate is being pulled down by young cohorts." Build the cohort-by-month view in your retention dashboard (or in a Shopify export) before you panic.
Sources and methodology
StoreGrowers Ecommerce Metrics Benchmarks 2026. The most-cited public source for annual RPR by vertical in 2026. Ten verticals reported (CBD 36.2%, sport apparel 33.0%, pet 31.5%, coffee 29.6%, supplements 29.1%, meal deliveries 29.0%, apparel 26.0%, cosmetics 25.9%, food 24.5%, tea 20.9%), plus the cross-vertical blended average at 28.2%. We use StoreGrowers as the primary annual-RPR-by-vertical anchor. Note: tea at 20.9% is a likely small-N artifact and we exclude it from the working tables.
Bloy Shopify Repeat Purchase Rate Benchmarks 2026. The only public source that publishes both 30-day and 365-day RPR by vertical on the Shopify panel. Six verticals (subscription 40%/70%, food and beverage 30-40%/50-60%, beauty and skincare 25-35%/45-55%, apparel and fashion 18-25%/35-45%, home and lifestyle 15-22%/28-40%, luxury/high-ticket 5-10%/20-30%). We use Bloy's midpoints throughout. The 60-day and 90-day windows are not published anywhere we could find; we leave those cells off the working tables and recommend operators back-fill them from their own retention dashboard.
SEC EDGAR 10-K and 8-K filings for public DTC repeat-customer disclosures. We pulled the most recent annual and quarterly filings for each public DTC company that discloses a repeat-customer metric. Chewy (CHWY) Q4 FY25 EX-99.1, accession 0001766502-26-000033 filed 2026-03-25: Autoship customer sales $10.50B / net sales $12.60B = 83.3%. Wayfair (W) Q4 FY25 release, accession 0001616707-26-000027 filed 2026-02-19: repeat-customer orders 8.8M / total orders delivered 11.1M = 79.1%, with 21.3M active customers. FIGS (FIGS) Q4 FY25 release, accession 0001628280-26-012333 filed 2026-02-26: active customers 2.9M, net revenue per active customer $216. Warby Parker (WRBY) Q1 FY26 release: 2.69M active customers, $331 ARPC. Allbirds (BIRD) S-1 (2021) and 2025 10-K (accession family 0001653909): last disclosed % net revenue from repeat customers was 53% in FY2020 and has not been updated.
Secondary syntheses. Bluecore Customer Growth Benchmarks (via secondary synthesis) for the 25-30% blended band cross-vertical floor. Compiled 2026 retention benchmarks for the subscription retention bands (monthly retention 92-96%, annual retention 55-70%, 12-month cohort retention 45-65%). EcomCalcTools 2026 for a five-vertical sanity check. Smile.io for the +20-27 percentage point loyalty-program RPR lift; Rivo for the OSEA Malibu 77% reward-redeemer benchmark.
Limitations. No publicly available source publishes 60-day or 90-day windowed RPR by vertical, so the working tables omit those cells. Bloy's panel is Shopify and skews mid-market; sub-$1M brands index below, $30M+ index above. Klaviyo's published 2026 benchmark covers email marketing only (open rate, CTR, revenue per recipient) and does not publish RPR by vertical; their internal Klaviyo Customer Hub has RPR percentiles by industry but those are not openly cited. Recharge's State of Subscription Commerce annual report is the closest source for subscription retention curves by vertical, but the latest publicly available numbers are not in the open web. Public DTC RPR disclosures cover four brands cleanly; private DTC mid-market is not in any of these datasets. Eightx's first-party QuickBooks-aggregate client-base data was considered as a sidebar input but is not included in this cycle. We want every figure in the tables to be third-party citable, and the QB aggregate is observational not panel-grade. Refresh cadence is quarterly; next update target August 29, 2026.
For the upstream metric this feeds, see our average ecommerce LTV by vertical, 2026 and LTV:CAC ratio benchmarks. For the order-frequency cut, see average ecommerce AOV by vertical. For the subscription-specific churn benchmark, see average ecommerce subscription churn by billing period.
Frequently asked questions
what is the average repeat purchase rate for an ecommerce store in 2026?
28.2% across all verticals on the StoreGrowers 2026 panel, with a 25-30% blended band confirmed by the Bluecore Customer Growth Benchmarks (via secondary synthesis). Shopify-specific stores cluster around 27%. Anything under that and your retention engine is broken. Anything above 40% and you have earned subscription, replenishment, or loyalty economics. This is the blended floor; the vertical-by-vertical spread is 4x wider, which is the whole reason you do not benchmark against the cross-vertical number.
what is a good repeat purchase rate for a $5m apparel brand?
26% on a 12-month basis is the apparel panel median (StoreGrowers). On a 365-day Shopify cut, the apparel and fashion midpoint is 40% (Bloy). For a $5M brand, you are usually 30-50% below the published panel because you have not built the retention infrastructure (email and SMS, post-purchase product mix, loyalty, bundles) the median brand has. A realistic target at $5M is 20-25% 12-month repeat. Push to 30-35% and you have earned the right to scale CAC.
is 30-day or 365-day repeat purchase rate the metric i should actually track?
Track both, but treat them as different things. 30-day RPR is a welcome-flow and onboarding conversion number; it tells you whether your post-purchase email, replenishment trigger, or subscription up-sell is working. 365-day RPR is the LTV anchor; it is the one that compounds into the contribution-margin LTV you spend CAC against. Do not benchmark 30-day against vendor tables that report 365-day, or you will misread your own retention as below-average when it is on track.
how does my pet brand's repeat rate compare to chewy's 83%?
Chewy's 83.3% is the Autoship-customer-sales-share-of-net-sales number, disclosed in their FY2025 Q4 release. It is a public-co ceiling, not a private-brand target. The Shopify pet vertical panel median is 31.5% annual RPR (StoreGrowers). At $5-20M revenue, a healthy pet brand sits at 28-40% 12-month RPR. Above 50% means you have layered subscription on a category that lends itself to it, which is what Chewy did at scale.
why do food and beverage brands have higher repeat purchase rates than apparel?
Consumption frequency. A coffee or supplement customer runs out and reorders in 30-60 days; an apparel customer wears the item and does not need a replacement for 4-9 months. Food and beverage compresses 64% of its 12-month repeat into the first 30 days (Bloy 2026); apparel only 55%. The category sets the ceiling. Inside that ceiling, the levers are bundle size, replenishment cadence, subscription, and post-purchase up-sell. You cannot beat physics, but you can engineer for it.
does a loyalty program actually move repeat purchase rate by 20-30 percentage points?
Yes, but only if you actually market it. Smile.io's 2026 data shows a 20-27 percentage point lift in RPR for active redeemers, and OSEA Malibu hits 77% RPR among reward redeemers. The trap is launching the program and not surfacing it: a loyalty program you do not market does not move RPR. Audit it like an ad channel. If less than 15% of customers know the program exists and less than 5% have redeemed, you are not measuring a loyalty lift, you are measuring an unused page on your site.
what's the difference between repeat purchase rate and returning customer rate?
Repeat purchase rate is the share of customers who buy more than once in a window: 12-month RPR is the most common, but you can window it at 30, 60, 90, or 365 days. Returning customer rate is sometimes used interchangeably and sometimes specifically means the share of orders (not customers) from repeat buyers. Wayfair discloses 79.1% repeat-customer orders share, which is a returning-order rate. Chewy discloses Autoship share of net sales, which is a returning-revenue rate. Three different metrics, three different ceilings, often quoted interchangeably. Pick one definition, document it, do not switch.
should my subscription brand benchmark against the 70%+ shopify subscription number?
Yes, but with the gross-margin caveat. Bloy's 70%+ 365-day RPR for subscription brands is the Shopify panel median for the subscription-led cohort. If you are running a subscription supplements, beauty, or coffee brand, that is the right anchor. If you are below 65% at 12 months, your churn (or your renewal flow) is the lever. Annual subscription retention bands sit at 55-70% (2026 vendor compilations); monthly churn at 4-8%. A 5% monthly churn keeps roughly 54% of the cohort at 12 months; 7% monthly churn keeps about 42%. Math the cohort, then benchmark.