
Insights
Average ecommerce LTV:CAC ratio by vertical 2026: where 3:1 is the floor, not the target
A 3:1 LTV:CAC ratio means you break even on acquisition, not that you have a healthy business. Apparel runs 2.1:1, supplements 4.8:1, and pet averages 3.9:1. Your vertical benchmark matters more than the generic rule, and payback period matters as much as the ratio itself.
Key Takeaways
- Cross-industry median LTV:CAC is 3.4:1 in 2026; top quartile is 5.6:1 (2026 vendor benchmark compilation). The spread is widening as CAC inflated roughly 40% in two years and top operators compound retention.
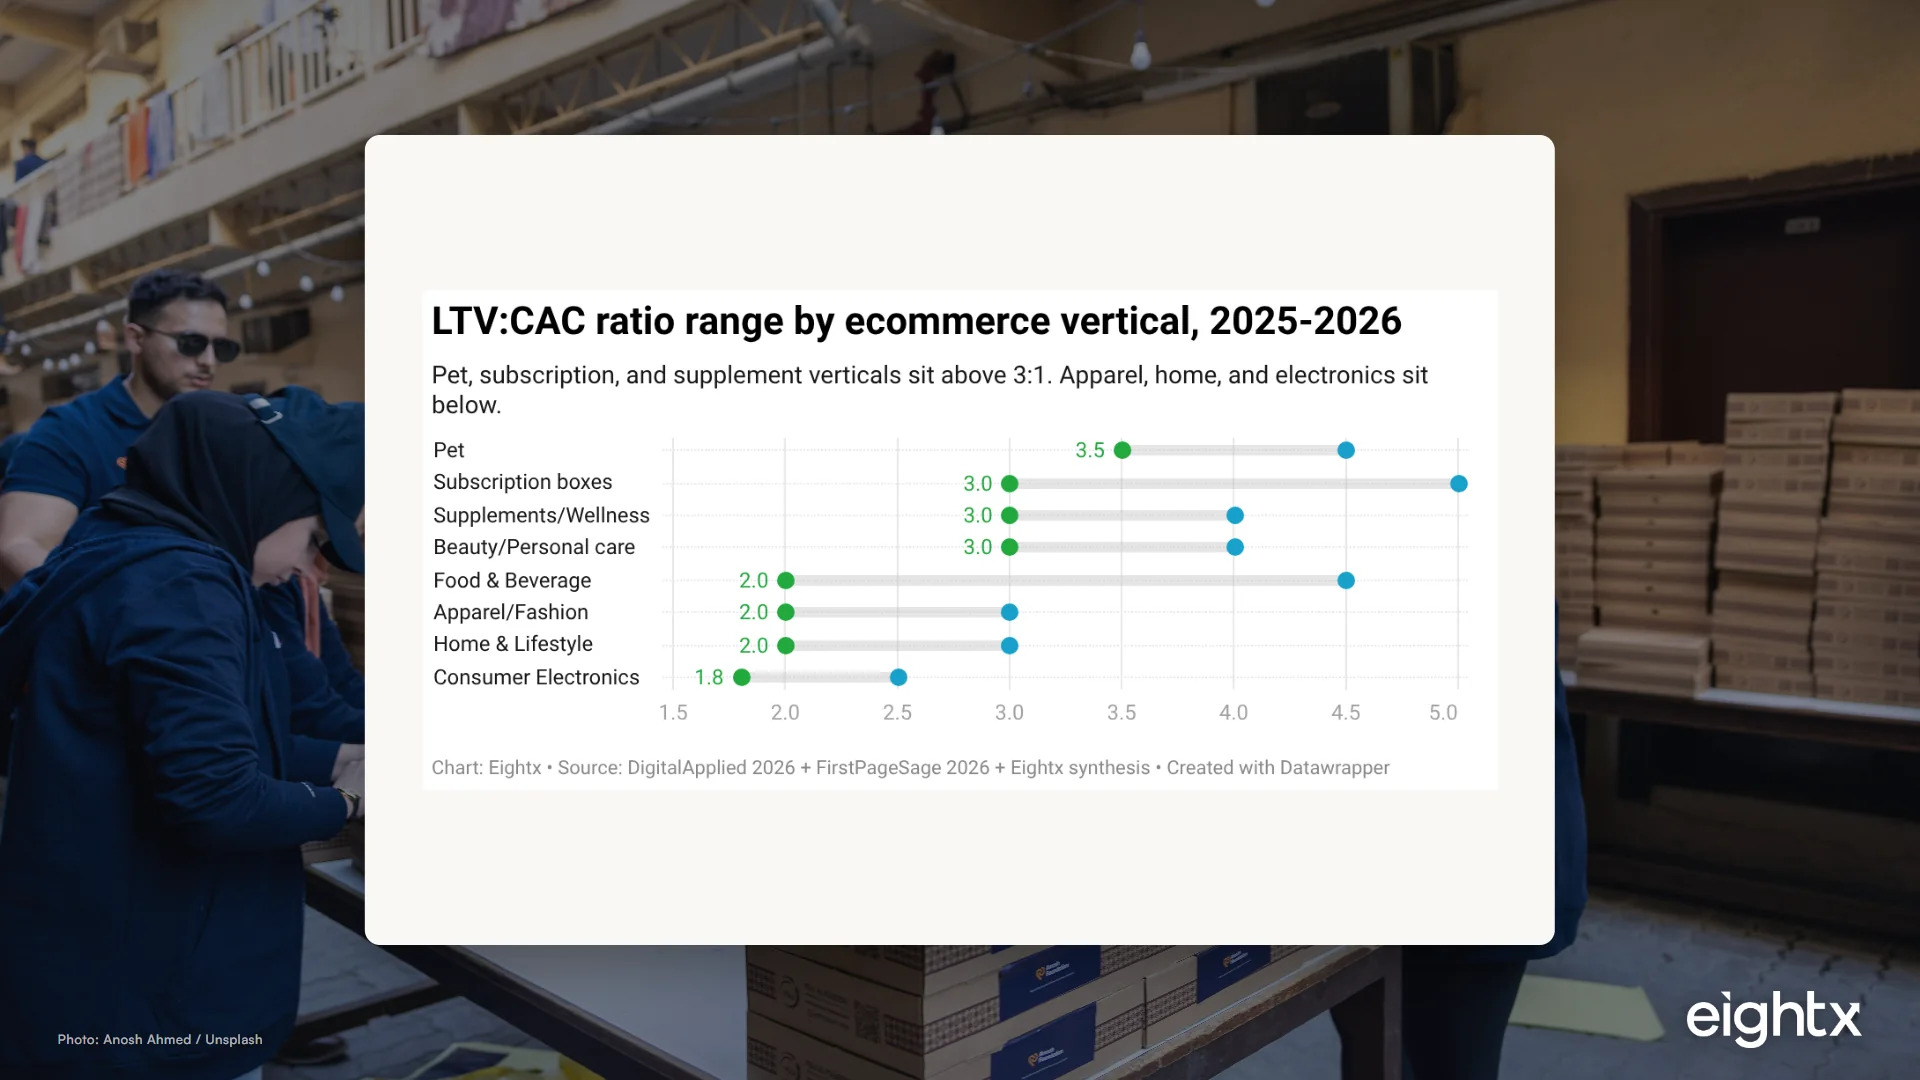
- Pet (3.5 to 4.5x), subscription boxes (3 to 5x), supplements and beauty (3 to 4x) sit above the 3:1 line. Apparel (2 to 3x), home (2 to 3x), and consumer electronics (1.8 to 2.5x) sit below it.
- The verticals with the highest CAC inflation are the ones with the weakest ratios. Home and lifestyle CAC grew 14% year-over-year, apparel 12%, beauty 8%, food and beverage 6% (compiled 2026 benchmarks).
- Public-DTC marketing as a percentage of revenue is the cleanest proxy: Chewy 6.5%, FIGS 15%, Allbirds 28%, Solo Brands 31%. Low marketing intensity tracks with the strongest LTV:CAC.
- Investors increasingly want CAC payback under 12 months on contribution margin, not revenue. The ratio is a snapshot; payback months is the operating decision.
The 3:1 LTV:CAC rule is treated like gravity in ecommerce finance. It is not. The 2026 cross-industry data shows the median LTV:CAC sits at 3.4:1 and the top quartile sits at 5.6:1, with verticals split into two clear bands: pet, supplements, beauty, and subscription brands above the line at 3 to 5x, and apparel, home, and consumer electronics below it at 1.8 to 3x. The operator move is to stop measuring yourself against the universal 3:1, anchor to the vertical-specific band, then read CAC payback months (not the ratio) before deciding whether to scale, hold, or cut spend.
LTV:CAC (lifetime value to customer acquisition cost) is one of two unit-economics metrics every ecommerce CFO benchmarks. The other is CAC payback period (months to recoup acquisition cost on contribution margin). This post covers the ratio by vertical for 2026 and shows why the public-DTC 10-K filings tell a different story than the vendor benchmarks alone.
The 3:1 rule was always vertical-blind
A 2026 compiled benchmark study published a cross-industry LTV:CAC distribution drawn from its compiled benchmark dataset (methodology mix; treat as directional). The cross-industry median came in at 3.4:1. The top quartile came in at 5.6:1. The spread between median and top quartile has widened since 2023, which is the structural story underneath the headline: top operators are compounding retention while laggards are absorbing CAC inflation.
The reason the universal 3:1 rule misleads is that ecommerce verticals do not have similar gross margin, repeat frequency, or churn structure. A pet brand running 80% autoship at 28% gross margin and a consumer-electronics brand selling one $400 hero unit every 24 months should never have the same LTV:CAC target. The 3:1 rule treats them as if they should.
The right read is the vertical band. Pet, supplements, beauty, and subscription brands sit in the strong band (3 to 5x typical, 5x+ top quartile) because subscription billing and replenishment frequency mechanically expand LTV. Apparel, home, and consumer electronics sit in the squeezed band (1.8 to 3x typical) because repeat purchase cycles are longer and contribution margin is lower per order.
The 2026 LTV:CAC band by vertical
The table below combines the compiled vertical distribution, FirstPageSage CAC benchmarks, and Eightx's prior vertical-band guide into a single reference. CAC payback months are the practical operating column. Anything above 18 months in a non-subscription category should trigger a deeper cohort review.
Vertical Typical LTV:CAC Top-quartile Blended CAC (USD) CAC payback (months) Primary retention driver Pet 3.5-4.5:1 5x+ $68-$90 8-14 Autoship + low churn Subscription boxes 3.0-5.0:1 5x+ $50-$100 6-12 Recurring billing + bundle Supplements/Wellness 3.0-4.0:1 4-5x $80-$130 8-14 Subscription + high margin Beauty/Personal care 3.0-4.0:1 4-5x+ $90-$130 8-12 Replenishment + samples Food & Beverage 2.0-4.5:1 4-5x $53-$100 6-12 High frequency + bundling Apparel/Fashion 2.0-3.0:1 4-5x $70-$120 12-18 Repeat purchase quality Home & Lifestyle 2.0-3.0:1 3-4x $68-$112 15-24 Cross-sell + accessories Consumer Electronics 1.8-2.5:1 3x $100-$377 18-24+ Accessory attach + ecosystem
A few takeaways the table makes obvious. Pet, subscription, and supplements all reward subscription-style billing. Apparel and home need repeat purchase quality to clear 3:1; without it they sit at the floor. Consumer electronics is structurally hard. If you operate at 2:1 in electronics you are not failing, you are at the vertical median.
What public-DTC filings tell us that vendor surveys don't
Vendor benchmark reports use varying definitions of CAC (blended versus paid versus fully-loaded) and rarely disclose the underlying cohort. Public DTC 10-K filings are noisier but they cross-validate the bands because marketing expense as a percentage of revenue, paired with gross margin, brackets the ratio.
We pulled FY2023-2024 marketing-spend and gross-margin disclosures from nine public DTC and consumer brands (most recent full fiscal year available per filer at time of writing). The spread runs from Chewy at 6.5% of revenue to Solo Brands at 31% of revenue. The brands at the low end are not lighter on marketing because they care less; they are lighter because their LTV is doing the work (Chewy's 70 to 80% autoship attach is the cleanest example).
Company Ticker Vertical Marketing % rev Gross margin % Cohort signal Chewy CHWY Pet 6.5% 28.5% 70-80% net sales from Autoship Stitch Fix SFIX Apparel sub 8.5% 44% Revenue per active client trends Warby Parker WRBY Eyewear 11% 56% First-purchase contribution-positive FIGS FIGS Medical apparel 15% 69% >60% revenue from repeat Honest Company HNST CPG 15% 34% Retail mix dilutes DTC signal Grove Collaborative GROV Household 19% 45% Subscription-led; CAC pressure Olaplex OLPX Beauty 26% 69% Salon + retail + DTC blend Allbirds BIRD Footwear 28% 41% Gross margin compressed since IPO Solo Brands DTC Outdoor 31% 61% Big-ticket; first-order economics critical
Two patterns sit on top of this data. First, gross margin and marketing intensity are negatively correlated only loosely; Olaplex runs 26% marketing on 69% gross margin and is still a healthy business because its absolute contribution-margin dollar per customer is high. Second, the highest-marketing brands (Solo Brands, Allbirds) are the ones the public market has marked down the hardest, which is the rough quantitative case for prioritizing LTV expansion over CAC compression once a vertical is mature.
Why pet, supplements, and subscription verticals outperform
Three structural reasons.
Subscription billing changes the LTV denominator. A subscription brand at 6% monthly churn on a $40 monthly box generates roughly $667 of LTV at a five-year cap. The same brand selling the same product one-shot at 30% repeat once a year generates closer to $80 of LTV over the same window. The ratio inputs are not comparable; you are running different businesses.
Replenishment categories absorb CAC differently. Pet food and supplements are biological consumption (the dog eats every day; the human takes the pill every day). The repeat purchase trigger is automatic. Apparel and electronics need a marketing or seasonal trigger to pull a repeat, which is why their cohorts decay faster.
The 3:1 floor in these verticals is underperformance, not pass. A pet brand at 3:1 with autoship is failing to monetize a structurally easy retention curve. A supplements brand at 3:1 has not figured out the subscription rail. These are operating problems, not vertical limits. Top operators are at 5x+, which is what investors who underwrite the category expect.
Where the squeeze is structural: apparel, electronics, home
The same compiled 2026 report tracks CAC inflation by vertical. Home and lifestyle CAC grew 14% year-over-year. Apparel grew 12%. Beauty grew 8%. Food and beverage grew 6%. The verticals at the bottom of the LTV:CAC band (home, apparel) are the same ones absorbing the highest CAC inflation. The squeeze is structural, not cyclical.
US ecommerce share of total retail sales was 16.9% in Q1 2026, up from 15.9% in Q1 2024 (FRED ECOMPCTSA, seasonally adjusted). The channel is still gaining share. That means DTC CAC inflation is not getting cyclical relief because every brand is fishing in a more crowded pond. If CAC inflation continues at the 2024-2026 pace and channel share keeps rising, operators in the squeezed band should expect ratio compression through 2026 unless they materially improve retention, increase AOV, or shift mix into a higher-frequency category.
Stop comparing yourself to the 3:1 rule. Compare yourself to the vertical band, then look at CAC payback in months on contribution margin. The ratio is a snapshot; payback months is the operating decision.
What to do this week
Three moves for a $5M to $50M DTC operator looking at this data.
Run your LTV:CAC against your vertical band, not 3:1. If you are pet at 3.2:1, your autoship rail needs work. If you are apparel at 2.6:1, you are at the median and the question is whether to scale or hold. Different verbs follow different bands.
Add CAC payback months to the dashboard. Calculate cumulative contribution margin per customer by month, find the point at which it crosses CAC. If payback is above 12 months in a non-subscription category, the ratio is hiding a working-capital problem. If it is under 8 months in a subscription category, you have room to scale paid even at a lower LTV:CAC because cash recycles fast.
Segment by acquisition cohort and channel before scaling spend. Blended ratios hide channel mix. A 3.5:1 blended ratio can split into Meta at 2.1:1 and email/SMS organic at 8:1. Scaling the blended ratio scales the worst cohort.
Sources and methodology
Compiled 2026 Customer Lifetime Value Benchmarks. Cross-industry median LTV:CAC of 3.4:1 and top quartile of 5.6:1 come from a compiled cross-industry dataset. Vertical CAC YoY changes (home and lifestyle 14%, apparel 12%, beauty 8%, food and beverage 6%) come from the same source. The compiler does not publish a single primary cohort source; treat as directional, not audited.
Compiled 2026 Customer Acquisition Cost Benchmarks. Vertical CAC averages and medians by vertical for 2025 to 2026.
FirstPageSage Average CAC for eCommerce Companies (2026 Edition). Cross-vertical CAC sample drawn from 80+ ecommerce clients with 2020 to 2025 spend data: apparel $66, beauty $61, food and beverage $53, household $58, furniture $77, consumer electronics $76. Used for the CAC range column in Table 1.
2026 vendor Ecommerce CAC synthesis. Blended ecommerce CAC range $68 to $84; cited 40% two-year inflation; fully-loaded CAC estimate $318 referenced via Shopify Global Commerce Report.
SEC EDGAR 10-K filings. Marketing expense as a percentage of revenue and gross margin pulled from FY2023-2024 consolidated statements of operations and MD&A (most recent full fiscal year available per filer at time of writing) for Allbirds (BIRD, CIK 0001653909), Warby Parker (WRBY, CIK 0001770787), FIGS (FIGS, CIK 0001846576), Chewy (CHWY, CIK 0001766502), Grove Collaborative (GROV, CIK 0001821806), Honest Company (HNST, CIK 0001828183), Olaplex (OLPX, CIK 0001868726), Solo Brands (DTC, CIK 0001846715), and Stitch Fix (SFIX, CIK 0001576942). Search workflow: EDGAR full-text search with "customer acquisition cost" OR "lifetime value" filter, 2025-01-01 to 2026-05-29.
FRED E-commerce Retail Sales as Percent of Total Sales (ECOMPCTSA). Seasonally adjusted quarterly series: 16.9% Q1 2026, 16.0% Q1 2025, 15.9% Q1 2024. Pulled 2026-05-29.
Eightx vertical-band guide. Internal benchmark synthesis maintained at /blog/ltv-cac-ratio-guide, used as a primary input to Table 1's CAC payback months column.
Limitations. No public DTC company discloses LTV:CAC as a single line item; the ratio is inferred from marketing as a percentage of revenue, gross margin, repeat purchase commentary, and cohort disclosure. Vendor benchmarks (the compiled dataset, FirstPageSage, Polar Analytics) use varying CAC definitions (blended versus paid versus fully-loaded), so the ranges in Table 1 reflect that spread. Eightx's prior vertical-band guide is a primary input to this synthesis; we cite it transparently.
Update cadence. Refreshed quarterly when the compiled dataset or FirstPageSage publishes a new edition, or when at least three of the tracked public DTC filers report a new full fiscal year. Next refresh target: September 2026.
For more on how to apply these benchmarks to your own brand, see our LTV:CAC ratio guide, the average contribution margin by vertical, and our interim CFO services overview.
Frequently asked questions
what is a healthy ltv:cac ratio for ecommerce in 2026?
There is no single healthy ratio across ecommerce because vertical bands differ by a factor of two. Pet, supplements, and subscription brands should target 4:1 or better. Apparel and home brands are healthy at 2.5:1 to 3:1. Consumer electronics is usually 2:1. Use your vertical band, not the universal 3:1, and read it alongside CAC payback in months.
is the 3:1 ltv:cac rule still valid or is it outdated?
The 3:1 rule is still useful as a cross-check but it misleads in two directions. Pet and supplements brands at 3:1 are underperforming for their vertical. Apparel and electronics brands at 2.5:1 are roughly normal. Use 3:1 as a sanity floor, not a universal target.
what is the average ltv:cac for apparel and fashion dtc brands?
The 2026 apparel band is 2 to 3:1 typical, with top quartile in the 4 to 5x range. Blended CAC sits in the $70 to $120 range. CAC payback typically runs 12 to 18 months because repeat purchase quality, not subscription, drives the ratio.
what is the average ltv:cac for pet and supplements ecommerce?
Pet brands typically sit at 3.5 to 4.5:1 with CAC of $68 to $90, with top operators above 5x thanks to autoship. Supplements run 3 to 4:1 with CAC of $80 to $130. Both verticals get a structural lift from subscription billing and replenishment frequency that apparel and electronics do not get.
why is consumer electronics ltv:cac so much lower than other verticals?
Electronics LTV is concentrated in the first order on a big-ticket SKU, and repeat purchase cycles are 18 to 36 months. CAC is also the highest of any vertical at $100 to $377 because the ad auction includes Amazon, big-box, and category leaders. The ratio compresses naturally; you make it back on accessory attach and ecosystem cross-sell, not repeat hero-product purchases.
what is the difference between cac payback and LTV-to-CAC ratio?
CAC payback is the number of months until cumulative contribution margin per customer covers the cost to acquire that customer. LTV:CAC is the lifetime ratio. Payback tells you when the cash comes back; LTV:CAC tells you the total return. Investors usually want payback under 12 months on contribution margin (not revenue) and LTV:CAC at or above the vertical median.
should i use blended cac or paid cac for my ltv:cac calculation?
Use blended CAC for total unit economics (all customers, all sources) and paid CAC for channel-level decisions. The compiled and FirstPageSage benchmarks in this post are blended. If you report paid-only CAC and compare to a blended benchmark, you will undershoot the comparison by 30 to 50%.
why is my ltv:cac dropping even though revenue is growing?
Three usual reasons. You scaled paid acquisition into a worse cohort and CAC rose faster than LTV. Your repeat rate slipped because retention was not protected during a growth push. Or you started counting new channels (TikTok Shop, Amazon DSP) that have shorter cohort histories and look unprofitable until they mature. Run the ratio by acquisition cohort and channel, not blended, to find the bleed.