
Insights
Average ecommerce marketing % of revenue by vertical, 2026: 12 public 10-Ks behind the benchmark
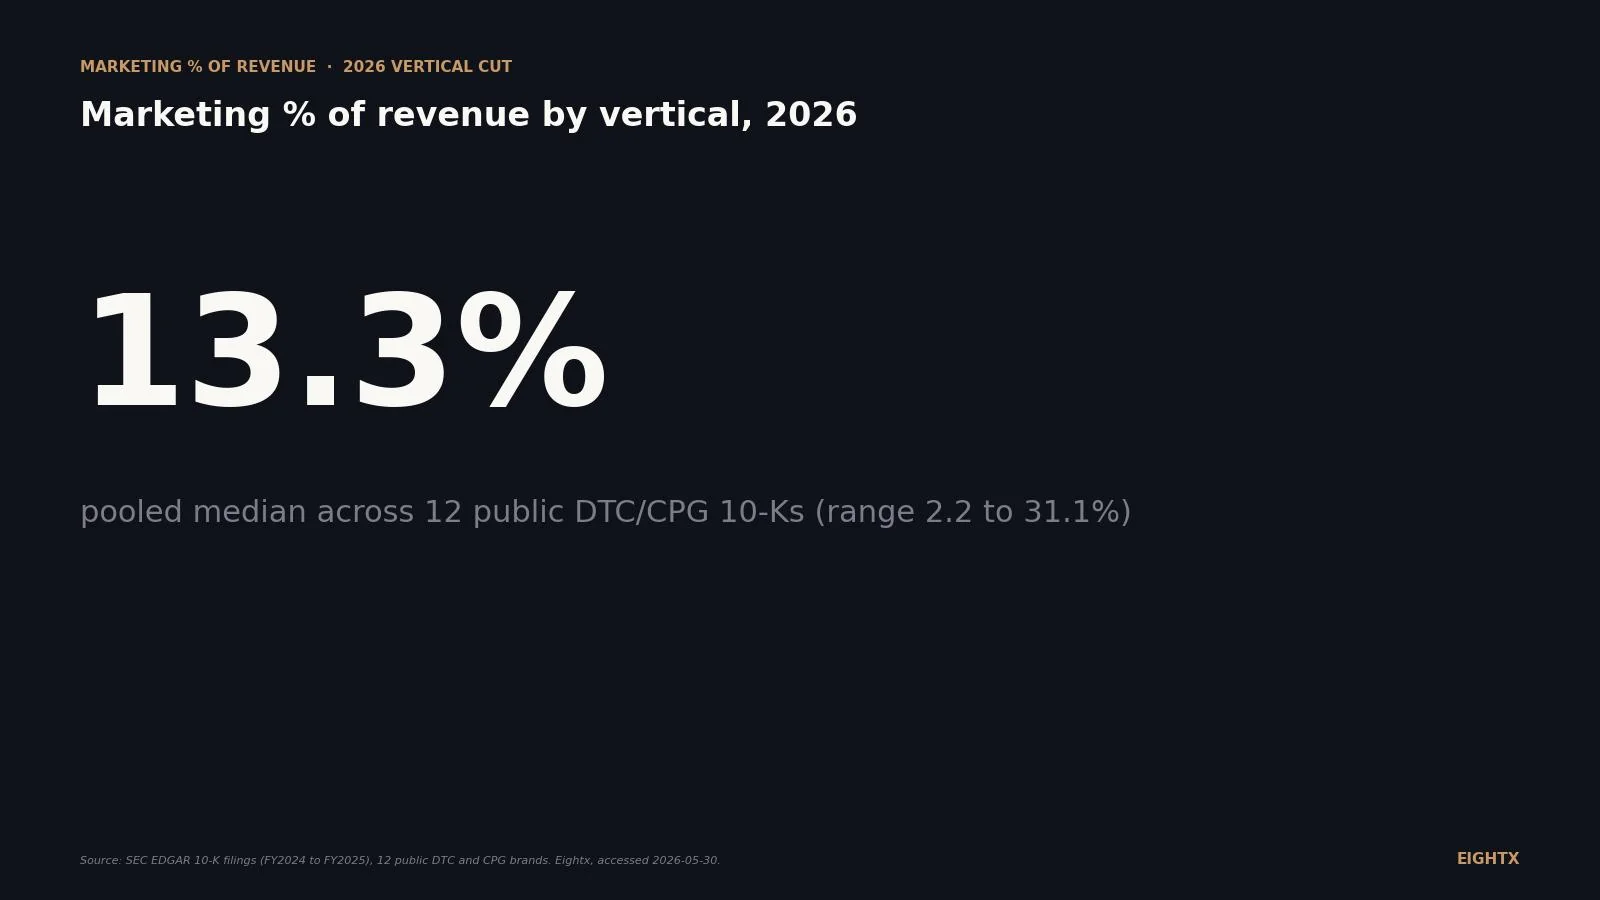
Pooled median marketing spend across 12 public DTC and CPG 10-Ks is 13.3% of revenue, with a range of 2.2% to 31.1%. Beauty CPG runs near 26%, apparel DTC near 12%, and food and beverage near 14%. The benchmark is a guardrail, not a target. The operating rule is contribution margin after marketing (CM3) must stay positive, and no vertical benchmark overrides that floor.
Key Takeaways
- Pooled median marketing spend across 12 public DTC and CPG 10-Ks is 13.3% of revenue (mean 15.0%, range 2.2 to 31.1%). 25th percentile 7.8%, 75th percentile 22.2%. If you only read the headline, the vertical median is the wrong anchor.
- Within-vertical spread is about 1.7x wider than the gap between top and bottom vertical medians. Food and beverage runs from Beyond Meat at 2.2% to Celsius at 26.8%, a 24.6-point spread. The gap between the beauty median (26.3%) and the apparel median (11.9%) is 14.4 points. Apparel itself runs 5.6% (Lululemon) to 22.2% (FIGS). The driver is not vertical, it is gross margin times channel mix times pricing power.
- Beauty CPG runs at the top of the stack: median 26.3%. e.l.f. Beauty 21.4%, The Beauty Health Company 31.1%. The math works because beauty gross margins sit at 65 to 75%, leaving 40+ points of contribution after a 25% marketing line.
- Private $5M to $50M DTC brands typically operate at 15 to 25% of revenue on marketing, vertical-tilted: beauty/supplements 20 to 25%+, F&B 10 to 18%, apparel 12 to 22%. Sub-$5M usually runs 20 to 30%+ because there is no brand pull yet. Public medians are a ceiling, not a target.
- The CM3 anchor (contribution margin after variable marketing of 20 to 25%) overrides every vertical median in the table. Below CM3 20%, scaling grinds. Below CM3 15%, the marketing line is not your problem, your unit economics are. This is the founder-call test.
If you are a $5M to $50M ecommerce operator asking "what should my marketing line look like," the answer most consultants give (a vertical median) is exactly the wrong anchor. The pooled median across 12 public DTC and CPG 10-Ks for 2026 is 13.3% of revenue. But the spread inside a single vertical is roughly 1.7x wider than the gap between top and bottom vertical medians. Food and beverage alone spans 24.6 points (Beyond Meat 2.2% to Celsius 26.8%) versus a 14.4-point gap between beauty (26.3%) and apparel (11.9%) medians. Lululemon at 5.6% and FIGS at 22.2% are both apparel. The driver is not the vertical, it is gross margin times channel mix times pricing power. This post walks through the 12-brand public benchmark, the private operating range $5M to $50M brands actually live in, the Allbirds case study on what happens when revenue falls faster than marketing spend, and the CM3 anchor that overrides every vertical median in the table.
What the 2026 public 10-Ks actually say
The headline number is the pooled median: 13.31% of revenue on selling and marketing across 12 US-listed DTC and CPG brands, mean 15.02%, 25th percentile 7.78%, 75th percentile 22.19%, range 2.21 to 31.11%. The vertical cut sits on top of that pooled number.
Beauty CPG leads at 26.3% median. Food and beverage CPG at 14.5%. Personal care 13.8%. Pet DTC 12.8%. Apparel DTC 11.9%. Other DTC 10.2%. Two facts to anchor on before you do anything with this table.
First, sample sizes are small. Beauty and food and beverage each have n=2. Personal care and pet each have n=1. The vertical medians are directional, not statistically reliable. If your category is "beauty" and you read the 26% number as a target, you are anchoring on two companies (e.l.f. and The Beauty Health Company), not a representative sample. The pooled n=12 median (13.3%) is the only number with enough data to be a real benchmark.
Second, the within-vertical spread is wider than the across-vertical spread. Apparel maxes out at 22.2% (FIGS) and bottoms at 5.6% (Lululemon). That apparel max sits above the beauty min (e.l.f. at 21.4%). If you are an apparel operator running 22% of revenue on marketing, you are inside the FIGS band, not the Lululemon band. Same vertical, two different businesses.
Vertical Brand Ticker Fiscal year S&M % of revenue Beauty CPG e.l.f. Beauty ELF FY2025 21.43% Beauty CPG The Beauty Health Company SKIN FY2024 31.11% Food & Beverage CPG Beyond Meat BYND FY2024 2.21% Food & Beverage CPG Celsius Holdings CELH FY2024 26.77% Personal Care CPG Honest Co. HNST FY2024 13.79% Pet DTC BARK BARK FY2025 (Mar) 12.83% Apparel DTC Lululemon LULU FY2024 5.56% Apparel DTC Revolve RVLV FY2024 14.31% Apparel DTC Stitch Fix SFIX FY2024 15.20% Apparel DTC FIGS FIGS FY2024 22.19% Other DTC Warby Parker WRBY FY2024 7.78% Other DTC Yeti YETI FY2024 12.64%
Why beauty sits at 26% and food at 14% (it is not what you would guess)
The naive read on the vertical table is "beauty buyers need more ads than food buyers." That is wrong. The real driver is gross-margin runway and where the trade spend sits.
Beauty CPG runs at 26% because beauty gross margins are 65 to 75%. With 70% GM, a brand can spend 25% of revenue on marketing and still leave 45 points of gross profit to cover fulfillment, payment processing, overhead, and a 20%+ CM3. The math works. The category does not "need" more marketing, it has the headroom to fund more marketing without breaking unit economics.
Food and beverage runs at 14% median but with a 24.6-point absolute spread (Beyond Meat 2.2%, Celsius 26.8%) because the channel mix is split. Wholesale-heavy F&B brands (Beyond Meat, most center-aisle CPG) push product through grocery and club channels, where the retailer does the conversion. The "marketing" line on a wholesale-heavy 10-K is mostly brand and trade marketing supporting retail distribution. Trade spend (slotting, co-op, retailer-funded promotion) gets buried in cost of goods sold or netted against gross revenue, not on the marketing line. Beyond Meat's 2.2% is not a real-world ad budget benchmark for any DTC brand. It is what happens with a wholesale-dominant revenue mix where the actual customer-acquisition spend lives somewhere else on the P&L.
Celsius at 26.8% is the opposite. DTC and field-marketing heavy, with paid-media and event activation carrying the volume. Different channel mix, same vertical, a 24.6-point gap on the marketing line. If you are a $20M F&B brand looking at the food and beverage median (14.5%), you cannot use it without first answering "what is my wholesale-to-DTC split."
The same logic plays out inside apparel. Lululemon at 5.6% is a 10-figure-revenue brand where physical stores and brand search do most of the conversion work. FIGS at 22.2% is a single-product DTC brand still paying full freight for paid acquisition. Both are "apparel." Neither tells you what your apparel brand should spend.
What private DTC brands actually spend, by vertical and stage
Public-company medians are a ceiling reference. The private operating range for $5M to $50M DTC brands sits higher.
The pattern: private brands at sub-scale carry more of the marketing burden directly because they do not have the brand-search demand, PR halo, or retail distribution that public brands lean on. Across our portfolio (35+ DTC and CPG engagements covering $650M+ in revenue), the operating ranges land at:
- Beauty and supplements: 20 to 25%+ at $5M to $50M, dropping toward 15 to 22% above $50M
- Apparel DTC: 12 to 22% at $5M to $50M, depending on AOV and repeat rate
- Food and beverage: 10 to 18% at $5M to $50M, depending on DTC-vs-wholesale split
- Pet DTC: 15 to 22% at $5M to $50M, paid-acquisition heavy
- Personal care: 12 to 20% at $5M to $50M
Stage matters as much as vertical. The by-stage cut:
Revenue stage Beauty / supplements Apparel DTC Food & beverage Sub-$5M 25 to 30% 20 to 30% 18 to 25% $5M to $25M 22 to 28% 18 to 25% 15 to 22% $25M to $100M 18 to 25% 15 to 22% 12 to 20% $100M+ 15 to 22% 12 to 18% 8 to 15%
The pattern compounds across vertical and stage. A $5M beauty brand running 25% of revenue on marketing is normal. A $25M food brand running 25% is aggressive. A $100M apparel brand running 25% is broken. The benchmark is the intersection of vertical, stage, and gross margin, not any one of them alone.
The Allbirds trap: when the ratio goes up because revenue went down
The cleanest cautionary tale in the public dataset is Allbirds (BIRD). Three years of 10-K filings tell a specific story about how marketing-to-revenue can climb even when absolute spend falls.
Allbirds went from $277.5M of net revenue in FY2022 to $190.0M in FY2024, a 32% revenue contraction over two years. Marketing as a percent of revenue went the other direction: 17.8% in FY2022, 19.3% in FY2023, 21.9% in FY2024. The percent climbed every year while the underlying revenue base shrank.
This is what happens when fixed marketing commitments (agency retainers, content production, brand-team headcount, tooling) do not flex down as fast as revenue falls. The absolute marketing dollars can decline year-over-year and still leave the ratio climbing because the denominator is falling faster. The Allbirds 21.9% in FY2024 is not "more aggressive spending." It is "less spending, but on a much smaller base."
Two operator takeaways. First, track marketing as a percent of revenue monthly, not quarterly. A brand on a soft revenue trajectory will see the ratio creep up in real time, well before the annual 10-K confirms it. Second, build flex into your marketing commitments. Quarterly agency reviews, month-to-month tooling contracts, and variable-spend creative budgets are the levers that let you flatten the ratio when revenue softens. Long-term agency retainers and 12-month content commitments lock in a fixed line that cannot absorb a 20% revenue contraction.
The CM3 anchor that overrides every vertical median
Across our portfolio, the single number that matters more than the vertical median is CM3: contribution margin after variable marketing.
CM3 equals gross profit, minus payment processing, minus variable fulfillment, minus variable marketing. It is the margin left over after you have paid for the product, shipped it, processed the payment, and acquired the customer. The Eightx target across vertical and stage: 20 to 25% CM3.
Below CM3 20%, scaling grinds. You can still grow, but every incremental dollar of revenue produces less operating headroom. Below CM3 15%, the marketing line is not your problem. Your unit economics are. Adding 5 points of marketing spend to a 12% CM3 business does not buy growth, it accelerates the burn. The fix is upstream: raise prices, drop low-margin SKUs, renegotiate fulfillment, or rebuild the product mix to lift GM.
The pooled median is 13.3%. The vertical medians span 10 to 26%. The within-vertical spread is roughly 1.7x wider than the gap between top and bottom vertical medians. Every benchmark in this post is a ceiling reference. The number that decides whether your marketing line is right is your CM3. Under 20%, fix it. Under 15%, your unit economics need work the marketing line cannot solve.
This is what we see across the portfolio: a brand can have a "correct" marketing percent for its vertical and stage and still have broken unit economics if CM3 sits in the high teens. The fix is rarely in the marketing line. It is in pricing, AOV, or fulfillment.
How to use this benchmark in your 2026 plan
Three honest uses of this data, in order.
Sanity-check against vertical and stage simultaneously. Not the vertical median alone. A $15M apparel brand should be looking at the $5M to $25M apparel cell (18 to 25%), not the public apparel median (11.9%). A $80M beauty brand should be looking at the $25M to $100M beauty cell (18 to 25%), not the public beauty median (26.3%). The single cell is the working range. The vertical median is the ceiling reference.
Inspect the within-vertical spread, not just the median. Whatever vertical you are in, the spread between the worst and best operator in the public sample is probably 3 to 12x. That spread is where your real benchmarking lives. If you are an apparel operator at 18% of revenue on marketing, you are not "above the apparel median of 12%." You are inside the apparel band (5.6 to 22.2%) at the higher end. Identify the public brand whose channel mix and scale most resembles yours, then anchor on that.
Anchor on CM3, not the marketing percent. The percent is the input. CM3 is the output. If your CM3 lands inside the 20 to 25% band, your marketing percent is correct for your business regardless of what the vertical median says. If your CM3 is below 20%, the marketing line is a symptom, not the disease. Fix CM3 first by interrogating gross margin, payment processing, and fulfillment. Then revisit marketing.
If you want the by-stage cut without the vertical layer, see our ad spend percent of revenue by stage, 2026 benchmark. If you want the time-series view of how the DTC marketing line has shifted since 2020, see our DTC marketing spend trend, 2020 to 2026. For the strategic view on how marketing fits into total customer acquisition cost, see our average CAC by ecommerce vertical and average MER by ecommerce vertical, 2026.
Sources and methodology
Primary data was pulled from SEC EDGAR 10-K filings, selling and marketing expense line as reported on the consolidated statements of operations, divided by net revenue or net sales for the same fiscal year. The 12-company pool covers 6 vertical buckets: Beauty CPG (ELF CIK 0001600438, SKIN CIK 0001818093), Food & Beverage CPG (BYND CIK 0001655210, CELH CIK 0001321655), Personal Care CPG (HNST CIK 0001664272), Pet DTC (BARK CIK 0001819574), Apparel DTC (LULU CIK 0001397187, FIGS CIK 0001774170, RVLV CIK 0001746618, SFIX CIK 0001576942), Other DTC (WRBY CIK 0001504776, YETI CIK 0001670592). All filings accessed via the SEC EDGAR company-search and filing-browser tools on 2026-05-30.
The Allbirds time series was pulled from BIRD (CIK 0001653909) 10-K filings for fiscal years 2022, 2023, and 2024. Net revenue and marketing expense were taken directly from the consolidated statements of operations. Marketing percent of revenue was calculated as marketing expense divided by net revenue for each fiscal year.
Private DTC operating ranges were synthesized from Eightx portfolio engagements: 35+ DTC and CPG brands managing $650M+ aggregate revenue. This is not a survey panel, it is a portfolio observation set across active and recent fractional CFO engagements. The by-stage cut (sub-$5M through $100M+) reflects what we see in actuals across the portfolio, not a projection or a target.
Limitations to surface up front. Sample sizes are small inside several verticals (beauty n=2, food and beverage n=2, personal care n=1, pet n=1). Vertical medians are directional, not statistically reliable, and we have flagged this in the body. The "selling and marketing" line on a public 10-K typically bundles team salaries, agency fees, and brand investment alongside paid media; it reads 2 to 5 percentage points higher than pure-paid MER inputs. Most critically, "selling" means different things across the pool: for CPG brands (ELF, SKIN, BYND, CELH, HNST) the "selling" portion of S&M includes sales-force compensation, retail merchandising, and broker fees, which is sales infrastructure, not marketing; for pure-DTC brands (FIGS, RVLV, WRBY, YETI) the S&M line is much closer to pure marketing. This means CPG S&M reads higher than apples-to-apples DTC marketing, and e.l.f. at 21.4% is not directly comparable to FIGS at 22.2% even though the headline numbers look similar. Wholesale-heavy CPG brands (Beyond Meat being the most obvious case) also bury trade spend, slotting, and retail co-op in COGS or against gross revenue, so the S&M percent further understates true acquisition cost for that subset. Beyond Meat at 2.2% is not a real-world DTC ad-budget benchmark.
Third-party context (used as cross-reference, not primary source): the Ecommerce Foundation 2026 synthesis pegs ecommerce-wide marketing spend at 8 to 12% of revenue for typical brands, 15 to 20% for aggressive-growth brands. That ecommerce-wide range sits lower than the public DTC pool because the wider ecommerce universe includes mature retail-heavy and B2B brands. The public DTC pool we benchmark here is selection-biased toward consumer-facing paid-media-dependent companies, which is why it skews higher.
Update cadence. This is a living index. We refresh the table quarterly when public 10-Q filings land (mid-February, mid-May, mid-August, mid-November), with a full refresh at each annual 10-K cycle. Next refresh target: Q3 2026 after the August 10-Q wave. The 12-brand pool is held stable for year-over-year comparability; pool expansions are flagged in the methodology note when they happen.
Frequently asked questions
what's a healthy marketing spend percent of revenue for a $10m ecommerce brand?
Depends on your vertical and gross margin. Beauty or supplements at 65 to 75% GM: 20 to 25% of revenue on marketing is normal at $10M. Apparel at 50 to 60% GM: 15 to 22%. Food and beverage at 35 to 50% GM: 10 to 18%. Then back-test against the CM3 anchor: gross profit minus payment processing, fulfillment, and marketing should leave 20 to 25 points. If it does not, the percent line is fine but your unit economics need work.
why is lululemon only spending 5% on marketing when revolve spends 14%?
Scale plus brand-search plus retail. Lululemon's 10-figure revenue base means even a large absolute marketing budget lands at 5.6% of revenue. Most of their acquisition happens through physical stores and brand search, not paid social. Revolve is still buying prospecting demand at scale, and their channel mix is paid-social heavy. The Lululemon ratio is what happens after you build a brand and a store fleet. It is not a target a $25M operator can chase.
how much marketing spend is too much if my gross margin is 45%?
Above 20 to 22% of revenue gets dangerous. With 45% GM, every dollar of marketing eats 2.2% of gross profit. Spending 22% of revenue on marketing leaves you 23 points of GM to cover payment processing (2 to 3%), fulfillment (8 to 12%), and overhead. Your CM3 lands at 8 to 13%, which is the scaling-grinder zone. Either raise prices, fix product mix to lift GM, or cut marketing to 15 to 18%.
how does wholesale revenue change the marketing percent benchmark for a cpg brand?
It hides trade spend in COGS. Wholesale-heavy CPG brands (Beyond Meat at 2.2% being the most obvious case) bury slotting fees, trade promotion, and retailer co-op marketing inside cost of goods sold or against gross revenue, not on the marketing line. The public "selling and marketing" percent understates true acquisition cost. If your business is 60%+ wholesale, the marketing percent of revenue is not a real benchmark. Track trade spend separately and total customer-acquisition cost as a combined view.
why did allbirds' marketing percent go up when their revenue went down?
Fixed marketing commitments do not flex down as fast as revenue. Allbirds went from FY22 to FY24 with revenue falling from $277.5M to $190M (down 32%), but marketing spend fell less than revenue did. Result: marketing as a percent of revenue climbed from 17.8% to 21.9%, even though absolute dollars fell. This is why we track marketing-to-revenue monthly, not quarterly. A shrinking-revenue brand can look like it is spending more aggressively when it is actually under-pacing the contraction.
what's the difference between marketing percent of revenue and mer?
They are inverses. Marketing % of revenue equals marketing spend divided by revenue. MER (marketing efficiency ratio) equals revenue divided by marketing spend. A 20% marketing line equals MER 5. A 10% marketing line equals MER 10. Marketing % of revenue is the CFO-friendly framing (every line on the P&L is a percent of revenue). MER is the marketer-friendly framing. Use whichever your team already speaks, but do not flip back and forth inside the same conversation.
should brand spend live inside the marketing line or be tracked separately?
Track it separately if you can. Brand marketing (PR, content, sponsorships, brand-search defense) has a different payback curve than performance marketing (Meta, Google, TikTok prospecting). Bundling them produces an averaged-out percent that hides what is actually working. A clean P&L splits performance marketing, brand and content, and lifecycle/retention as three lines. If you are at sub-$10M you can run them as one line but split it inside the budget conversation.
what marketing percent should i target by stage, under $5m, $5-25m, $25-100m?
Sub-$5M typically runs 20 to 30%+ because there is no brand pull yet. $5 to $25M usually 18 to 25% as efficiency starts compounding. $25 to $100M lands at 15 to 22% as repeat revenue carries more of the load. $100M+ converges toward the public median of 13 to 15% with vertical tilt. The by-stage cut matters as much as the by-vertical cut, which is why we publish ad spend percent of revenue by stage as a sister benchmark.