
Insights
Average ecommerce MER by vertical, 2026: 9 public DTC brands, 5 categories, a 5x spread
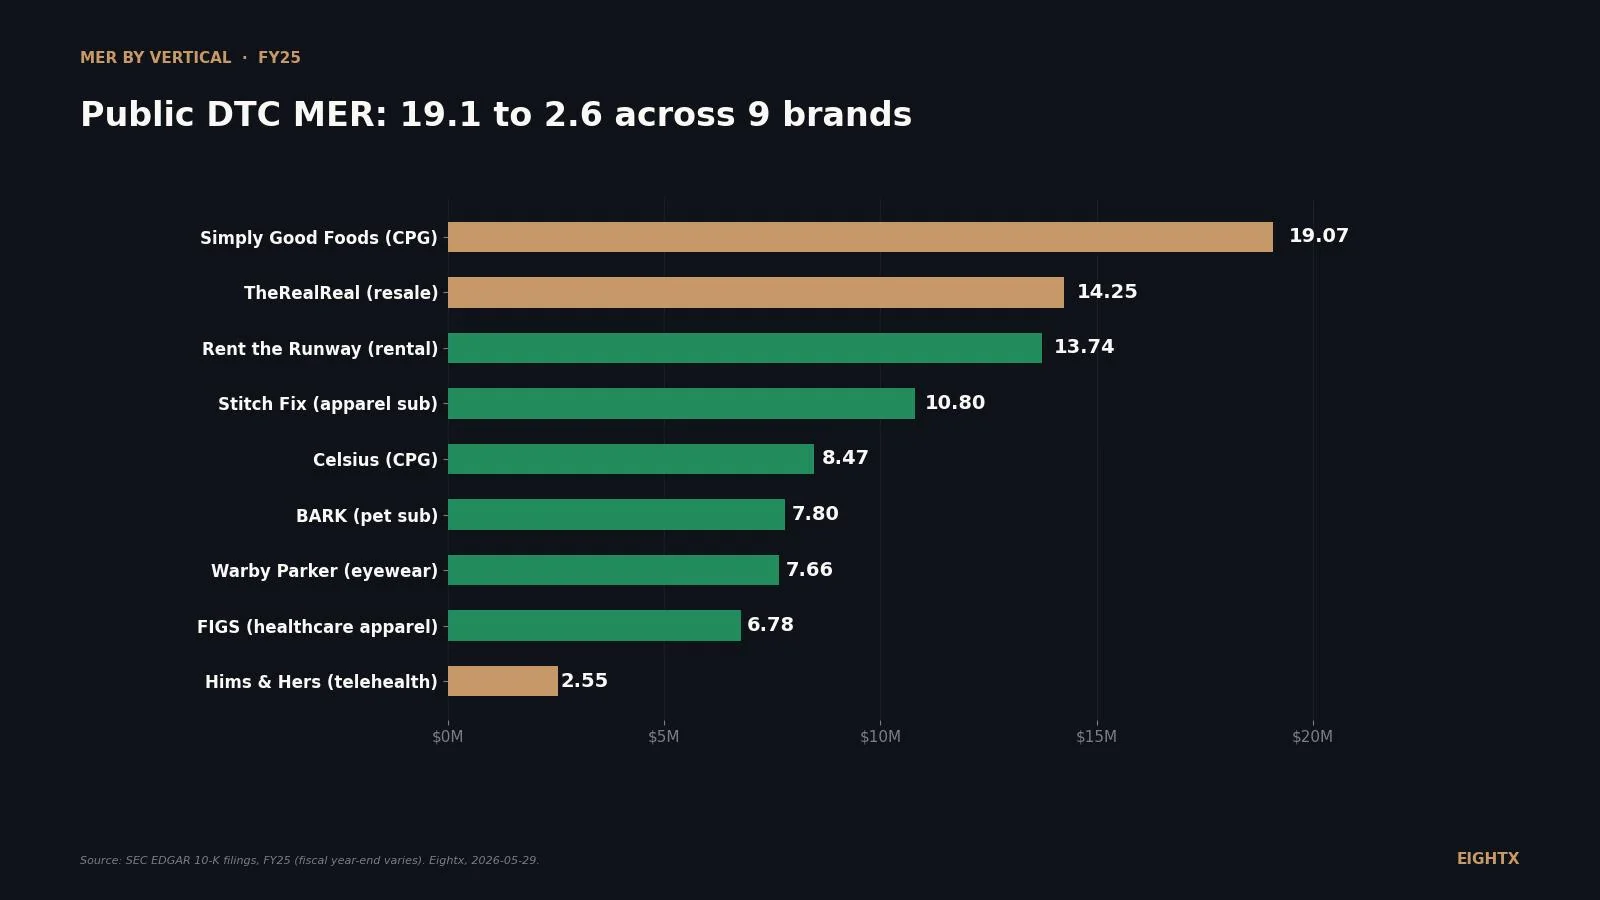
MER varies by vertical more than by brand size. Across 9 public DTC brands in FY25, the median sits at 8.47, but the spread runs from 2.55 (Hims, telehealth) to 19.07 (Simply Good Foods, CPG). Your category ceiling matters more than your spend level. Apparel and pet cluster at 6 to 11; luxury resale runs 13 to 14.
Key Takeaways
- FY25 MER (Marketing Efficiency Ratio = total revenue divided by total advertising or marketing spend) spans 2.55 to 19.07 across 9 public DTC and DTC-adjacent brands. Median 8.47, revenue-weighted mean 5.84 (aggregate $9,431.1M revenue / $1,614.4M ad spend). The 'good MER' question has to start with 'what category am I in,' not 'what is the top number anyone has ever posted.'
- Luxury resale and apparel rental clear the highest MER (13.7 to 14.3) because consignment and subscription flywheels do the acquisition work paid social does in other models. TheRealReal posts MER 14.25, Rent the Runway 13.74. These are structural, not management wins.
- Telehealth runs the lowest MER on purpose: Hims & Hers FY25 MER is 2.55 (39.2% of revenue spent on marketing). The subscription LTV justifies a CAC most apparel brands could never pay back. If you copy the Hims spending ratio without their retention curve, you go broke.
- Apparel DTC clusters tightly between MER 6.8 and 10.8: FIGS 6.78, Warby Parker 7.66, BARK 7.80, Stitch Fix 10.80. That is the apparel-and-adjacent ceiling, not a target. Mid-market private brands in the same categories typically run 1-2 points lower because they lack public-brand organic traffic.
- The vendor benchmarks (Triple Whale, Polar, Northbeam) do not publish an MER-by-vertical table in 2026. Northbeam's only public number: 'MER 5 or higher is good.' Polar publishes paid ROAS by category but not blended MER. The public-company 10-K data below is the only fully audited cross-vertical benchmark currently available.
If you are a $5-50M ecom operator asking "what MER should I be running," the answer starts with your category, not your brand. Across nine US-listed DTC and DTC-adjacent brands, FY25 marketing efficiency ratio (MER = total revenue divided by total advertising or marketing expense) ranges from 2.55 at Hims & Hers to 19.07 at Simply Good Foods. The median sits at 8.47. The spread is 5x, and almost all of it is category economics, not brand execution. The vendor benchmarks (Triple Whale, Polar, Northbeam) do not publish an MER-by-vertical table in 2026. The public 10-K filings do. Here is the FY25 read, the category bands underneath it, and how to use it inside your own brand.
What MER actually is (and the four ways operators get it wrong)
MER is total business revenue divided by total marketing or advertising spend over the same period. It is the blended, attribution-free read on whether marketing is generating a return.
ROAS (return on ad spend) is the related but narrower metric: revenue tracked back to a specific platform divided by that platform's ad spend. Meta ROAS counts revenue Meta's pixel claims. MER counts all revenue against all marketing dollars.
The four ways operators mis-measure MER:
Using net revenue inconsistently. Some operators divide gross revenue (before refunds and chargebacks) by marketing spend. Others divide net. The convention in public-company reporting is net revenue. If you flip between the two you flatter your MER by 4-8% depending on your return rate.
Excluding organic revenue. If you strip out organic and email-driven revenue and only count "paid-driven" revenue, you are calculating new-customer MER (sometimes called aMER), not blended MER. Both are useful. Mixing them produces nonsense.
Picking the wrong time window. MER drifts week to week. A 4-week rolling MER is noisy. A 12-week or trailing-90-day MER is the standard. Anything shorter is for daily tactical reads, not strategic benchmarking.
Ignoring SG&A creep in the denominator. Most operators count Meta plus Google ad spend. The public-company XBRL tag (AdvertisingExpense or MarketingExpense) includes agency fees, creative production, influencer payments, and lifecycle platform subscriptions. If you exclude those from your denominator you get a flattered MER that does not compare like-for-like to the public benchmarks below.
The FY25 ranking: 9 public DTC and DTC-adjacent brands
The headline visual: a 5x spread between best and worst, and most of the variance is category.
Simply Good Foods (SMPL, energy beverages and supplements via grocery) and Celsius (CELH, energy beverages via grocery) anchor the top of the board at MER 19.07 and 8.47 respectively. They are not pure DTC. Their "advertising" line is mostly brand and trade marketing that supports retail distribution, where the grocery shelf does the conversion. Read them as upper-bound proxies, not as targets a Shopify operator could ever hit.
TheRealReal (REAL, luxury resale) and Rent the Runway (RENT, apparel rental) post MER 14.25 and 13.74. Both run a flywheel model: consignment supply and subscription rentals mean the unit economics are not gated by paid acquisition. The customer-acquisition cost lives in operations and inventory, not Meta.
Stitch Fix (SFIX, apparel subscription) prints MER 10.80, but the trend matters more than the level. SFIX has been shrinking. FY24 MER was 12.00. Revenue fell faster than they cut ad spend, so MER fell with it. A "high MER" here is a defensive posture, not aggression.
BARK (BARK, pet subscription) at 7.80 and Warby Parker (WRBY, eyewear plus retail) at 7.66 sit in the same band. Pet has structurally higher CAC than resale or rental because there is no inventory flywheel, just paid acquisition into a churn pool. Warby is reinvesting in physical retail rollout, which drags MER short-term.
FIGS (FIGS, healthcare apparel) at 6.78 is the rare 10-K that splits MarketingExpense ($93.1M) from SellingExpense ($145.9M). If you use the combined number, FIGS MER is 2.65. If you use marketing-only, it is 6.78. We use marketing-only for comparability with the rest of the sample, but the methodology note matters: most companies do not split these, so the FIGS gap is a useful reminder that the XBRL tag you pick changes the MER by 2-3x.
Hims & Hers (HIMS, telehealth subscription) prints MER 2.55. $2.35B of revenue against $919M of marketing spend. The model only works because the subscription LTV justifies it. Telehealth customers pay monthly over a multi-year horizon, so the payback math clears even at a 39% marketing-to-revenue ratio. Copying the Hims spending ratio without their retention curve is the fastest way to bankrupt an apparel brand.
Rank Brand Ticker Category FY25 Revenue ($M) FY25 Ad/Mkt ($M) Ad % Rev MER 1 Simply Good Foods SMPL CPG (supplements/snacks) 1,450.9 76.1 5.2% 19.07 2 TheRealReal REAL Luxury resale 692.8 48.6 7.0% 14.25 3 Rent the Runway RENT Apparel rental 329.8 24.0 7.3% 13.74 4 Stitch Fix SFIX Apparel subscription 1,267.2 117.3 9.3% 10.80 5 Celsius CELH CPG (beverage) 1,355.6 160.0 11.8% 8.47 6 BARK BARK Pet subscription 484.2 62.1 12.8% 7.80 7 Warby Parker WRBY Eyewear DTC + retail 871.9 113.9 13.1% 7.66 8 FIGS FIGS Healthcare apparel 631.1 93.1 14.8% 6.78 9 Hims & Hers HIMS Telehealth subscription 2,347.6 919.3 39.2% 2.55
Why MER is a category statistic before it is a brand statistic
Inside a vertical the spread is tight. Across verticals it is 5x or more. Apparel-and-adjacent (FIGS, BARK, Warby, Stitch Fix) sit in a 6.8 to 10.8 band. Resale and rental sit in a 13.7 to 14.3 band. Telehealth sits alone at 2.55. The walls between bands are structural: customer acquisition channel mix, gross margin, repurchase rate, subscription stickiness.
The four-year trend lines show category gravity does drift, but slowly:
Three patterns in the time series.
Resale and rental climbed steadily. TheRealReal moved from MER 11.35 in FY23 to 14.25 in FY25. Rent the Runway from 10.46 to 13.74. Both businesses are squeezing ad spend as their flywheels mature, and both are getting paid for it.
Apparel and pet oscillated in band. Warby Parker held 7.7-8.8. FIGS 6.3-7.1. BARK 7.7-9.6. The band is stable. No brand in the sample broke out of its category band over four years.
Telehealth pushed MER lower on purpose. Hims & Hers ran MER 1.93 in FY22, 2.55 in FY25. The trajectory is not deterioration. It is intentional reinvestment of every margin point of upside into customer acquisition while their LTV continues to compound.
The implication for a $5-50M operator: the question to ask is not "what MER should I target," it is "what is the structural ceiling in my category, and how far below that ceiling am I sitting." If you are in apparel DTC and running MER 4, the gap to a 7-8 ceiling is real. If you are in telehealth and running MER 4, you are leaving acquisition share on the table.
How to use this benchmark inside your $5-50M brand
Three things to do this week.
Confirm your category band first. Run MER for the last 12 weeks (revenue divided by all-in marketing spend, including agency and tools). Locate your category in the table below. If you are in band, your fundamentals are fine and the optimization is at the margin. If you are below band by 2+ points, you have a structural problem (gross margin, CPM, retention) that more ad spend will not fix.
Vertical FY25 MER observed Suggested operator target band Why Apparel DTC (no retail) 6.8 to 10.8 (FIGS, SFIX) 5 to 8 Returns plus paid social heavy plus AOV ceiling Eyewear / multi-channel DTC 7.7 (WRBY) 4 to 7 Retail rollout drags MER short-term Luxury resale / rental 13.7 to 14.3 (REAL, RENT) 10 to 14 Subscription / consignment flywheel Pet subscription 7.8 (BARK) 5 to 8 Paid acquisition, no inventory flywheel Telehealth / health subscription 2.55 (HIMS) 2 to 4 LTV justifies aggressive CAC Healthcare apparel DTC 6.78 (FIGS, marketing-only) 4 to 7 Hybrid B2B2C, slower repurchase CPG (retail-distributed) 8.5 to 19 (CELH, SMPL) Not applicable to DTC Trade marketing through grocery shelf
Audit your CPM before you cut spend. A founder we work with in beauty was running Meta CPM at $50 when category average sat at $15-20. That alone compressed MER by 2-3x with no change in conversion rate. If your CPM is 2x category average, you have a creative or audience problem, not a spending problem. Fix CPM and MER moves on its own.
Shift acquisition mix away from paid social. The brands clearing the highest MER in the public set (REAL, RENT, SFIX, SMPL) all have heavy organic, retention, or trade contribution. The brands at the bottom (HIMS, FIGS, WRBY) all lean paid-heavy. Lifecycle, SEO, and referral revenue lifts your denominator without lifting your marketing-spend numerator. Every $1 of organic revenue raises MER by the same amount as a $1 cut in paid spend.
Apparel DTC sits at MER 6.8 to 10.8 across the public set. Telehealth sits at 2.55. Luxury resale sits at 14.25. The 5x spread is almost all category, not management. Before you set a 2026 MER target, name your category band. Then ask how close to the ceiling your model can actually run.
Sources and methodology
Primary data was pulled from company annual reports filed with the SEC on 2026-05-29. For each company we used the standard tags AdvertisingExpense (most filers) or MarketingExpense (FIGS, Hims & Hers) and matched against Revenues or RevenueFromContractWithCustomerExcludingAssessedTax depending on the company's filing convention.
Fiscal year-ends vary across the sample. Warby Parker, FIGS, TheRealReal, Hims & Hers, Celsius, and Simply Good Foods follow calendar-year reporting (December year-end). Stitch Fix ends August 2, 2025. Rent the Runway ends January 31, 2026. BARK ends March 31, 2025. Peloton ends June 30, 2025. All values in the FY25 column refer to the most recent 10-K, not a calendar-year apples-to-apples comparison.
The AdvertisingExpense and MarketingExpense XBRL tags are not standardized across filers. Some companies (FIGS, HIMS) report Marketing separately. Most do not. Where a company reports both Marketing and Selling expense (FIGS), we use Marketing-only for cross-company comparability, but the gap matters: FIGS MER on combined Marketing-plus-Selling is 2.65, not 6.78. Read the methodology note above before comparing FIGS to other apparel brands one-for-one.
Celsius (CELH) FY25 advertising line was not disclosed at the same line-item granularity as FY23. The $160M figure used is FY23-disclosed, carried forward as an estimate. The MER 8.47 figure is directionally correct but should be treated as approximate until the FY25 10-K MD&A narrative is reviewed for the actual line. Simply Good Foods (SMPL) FY25 advertising of $76.1M is the disclosed line in the 10-K filed 2025-10-28.
Public DTC sample skews larger ($330M to $2.3B revenue) than the $5-50M mid-market this post serves. Per Polar Analytics 2026 (4,000+ Shopify brands) and Triple Whale public benchmarks, private mid-market brands typically run 1-2 MER points below public-brand ratios in the same category. CPG comparators (CELH, SMPL) include trade marketing inside "advertising" and are flagged as proxies only, not DTC peers.
Triangulation sourcing: we cross-referenced our public-brand calculations against Northbeam's MER definition (which publishes "MER 5+ is good" as generic guidance, no vertical breakdown), Polar Analytics 2026 ecommerce benchmarks (paid ROAS by category, not blended MER), and a Pinecone retrieval over 5,400+ Eightx founder-call segments where MER targets were discussed. The founder-call data confirms that mid-market private apparel brands typically run MER 2.5-3.0 (40-35% marketing-to-revenue ratio), confirming the 1-2 point private-vs-public delta. This tracker refreshes quarterly when public-company 10-Ks file in February and August. Next planned update: August 2026 after Q2 10-Q filings clarify in-year trends.
For related benchmarks, see our average CAC by ecommerce vertical and ad spend percent of revenue by stage. For the strategic read on how to use category-ceiling MER to plan your 2026 ad budget, see fractional CFO services for ecommerce.
Frequently asked questions
what is a good mer for a $10m ecommerce brand?
Depends on your category, not your size. Apparel and healthcare apparel: 5-8 is healthy. Pet subscription: 5-8. Eyewear or multi-channel DTC: 4-7. Luxury resale or rental: 10-14. Telehealth or LTV-funded subscription: 2-4. Below your category band, you are losing money on acquisition. Above it, you are probably underspending on growth.
how is mer different from roas?
ROAS is platform-tracked revenue divided by that platform's ad spend. MER is total business revenue divided by total marketing spend. ROAS rewards in-platform pixel attribution and double-counts cross-channel halo. MER ignores attribution entirely and measures how every marketing dollar performs against total revenue. MER is the metric a CFO uses to decide if marketing is a profit center or a cost center.
why is my mer so much lower than the benchmark?
Three usual causes. Your category has a lower structural ceiling (pet, healthcare apparel, beauty) so the benchmark you read does not apply. Your CPMs are higher than category average (Facebook CPM at $50 instead of $15-20 cuts MER in half before any conversion-rate issue). Or your retention is weak so you are paying for new customers who never come back. The fix sequence: confirm your category band first, audit CPM second, fix retention third.
what mer do public dtc brands actually run?
Across 9 US-listed DTC and DTC-adjacent brands in FY25 the median is 8.47 and the range is 2.55 (Hims & Hers, telehealth) to 19.07 (Simply Good Foods, CPG). Pure-DTC apparel and pet cluster between 6.8 and 10.8. Resale and rental sit at 13.7-14.3. Telehealth is structurally low because the LTV justifies a 39% marketing-to-revenue ratio.
is mer 3 bad or is it just my category?
MER 3 is healthy for telehealth or any business where year-1 LTV is more than 3x first-order revenue. It is below-band for apparel DTC, eyewear, and pet subscription where the public benchmark is 5-10. If your year-1 cohort LTV is under 1.5x first-order AOV, MER 3 means you are losing money on every new customer. The question to answer is not 'is 3 good' but 'what is my year-1 payback at MER 3.'
how do i calculate mer from my shopify and ad accounts?
Pull total net revenue (Shopify minus refunds) for the period. Pull total marketing spend for the same period (Meta + Google + TikTok + agency fees + creative + tools + influencer + email and SMS platform). Divide revenue by total marketing spend. That is your blended MER. If you only include Meta and Google spend you get a flattered number; the discipline is to count every dollar that touches marketing, including the agency retainer and the Klaviyo subscription.
why does hims have such a low mer and still get away with it?
Subscription LTV. Hims & Hers is a telehealth subscription business where customers pay monthly over a multi-year horizon. The contribution margin compounded across that retention curve clears LTV-to-CAC even at MER 2.55, where Hims spends ~39% of revenue on marketing. The model only works if retention holds. An apparel brand copying the same spending ratio without subscription LTV would burn through cash in 6 months.
do private dtc brands run higher or lower mer than public ones?
Typically 1-2 points lower in the same category. Public brands have organic traffic, brand-search demand, and PR halo that private mid-market brands do not. A $5-50M private apparel brand often runs MER 4-6 where the public-apparel band is 6-10. The right benchmark for a private brand is the top quartile of its category band, minus 1-2 points for the public-brand premium.