
eCommerce
Average ecommerce promo frequency by vertical 2026: apparel runs 8-14 sitewide sales a year, electronics runs 3-6
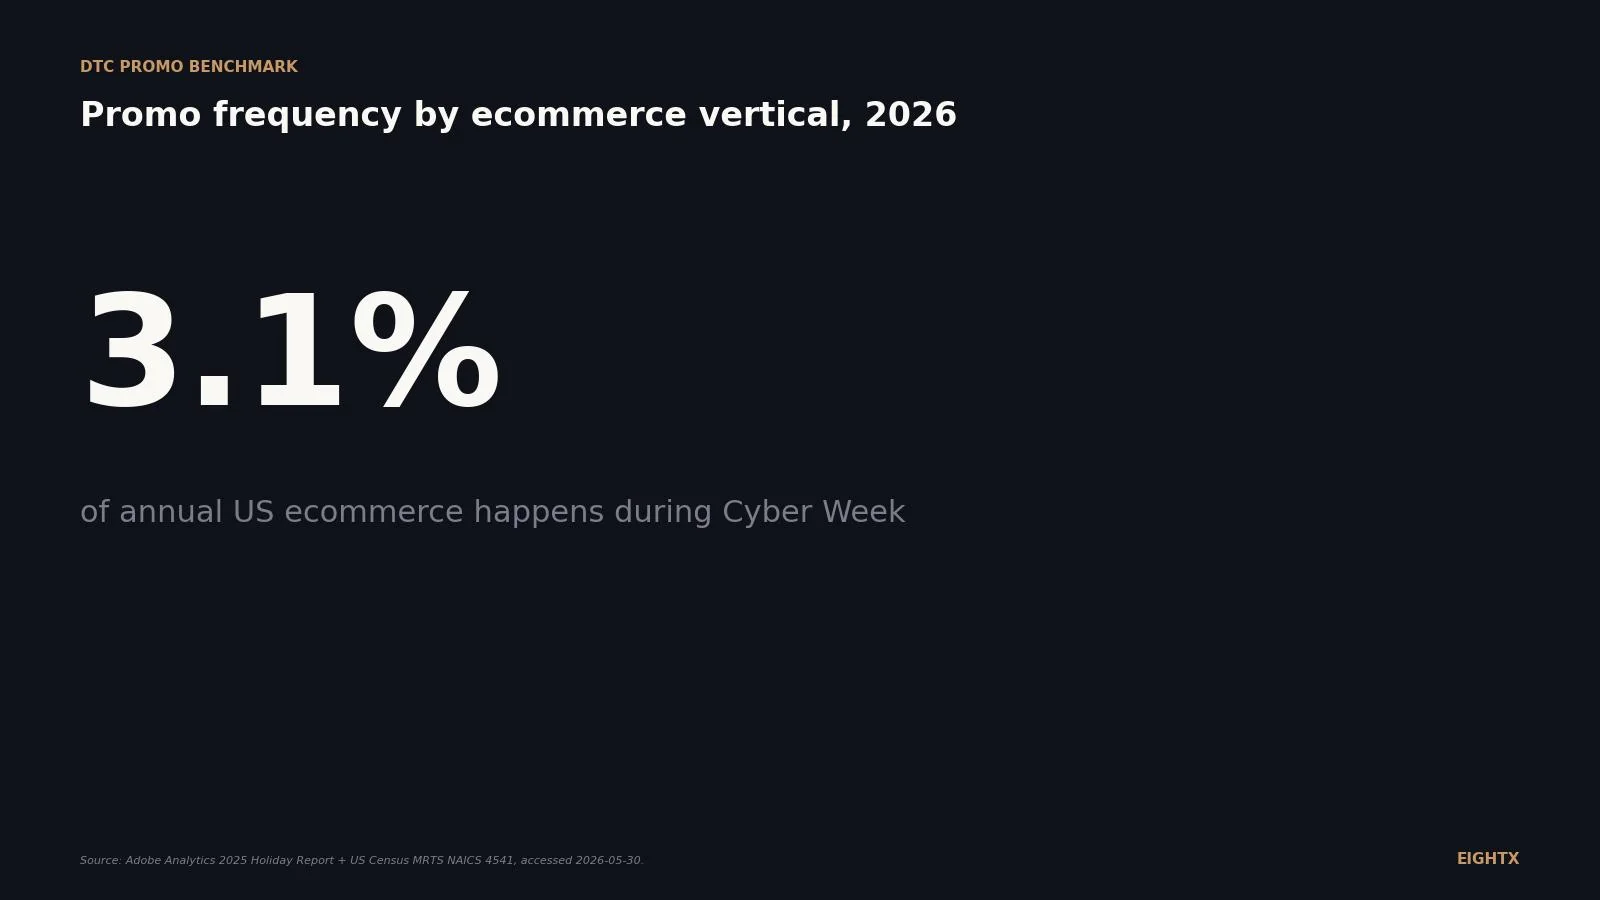
Apparel DTC brands run 8 to 14 sitewide promotional events per year, electronics brands run 3 to 6, and beauty and supplements land in between. BFCM accounts for 3.1% of annual US ecommerce (Census MRTS, $1.43T base), not the 20 to 30% operators often assume. Vertical norm determines margin risk: apparel brands discounting 14 times a year train customers to wait, compressing full-price mix.
Key Takeaways
- Cyber Week 2025 was 3.1% of annual US ecommerce ($44.2B of $1.43T). The 'BFCM is 30% of our year' founder narrative is off by an order of magnitude. November plus December combined captured 20.3%.
- Apparel DTC brands run 8-14 sitewide promos per year. Electronics runs 3-6. Beauty, home, jewelry and supplements cluster between those poles. The variance is structural, not strategic, and it tracks gross margin.
- Apparel took 36.0% of tracked BFCM 2025 revenue, up from 30.5% in 2024 (Triple Whale brand sample). Every other vertical lost share. If you're a non-apparel brand competing for BFCM dollars, the auction is getting worse, not better.
- Discount penetration is the metric that matters more than promo count. Heavy-promo apparel brands run 70%+ of orders with a discount on the year. The 'non-promo' baseline most founders think they have does not exist in apparel and footwear.
- Build your 2026 promo calendar to the midpoint of your vertical, not to your competitor's calendar. Cap events at the median, leave 6 or more weeks between them, and gate your two deepest discounts to BFCM plus one anchor event.
If you run a DTC ecommerce brand, the question of how many sitewide promos to schedule next year is one of the highest-impact gross-margin decisions on your calendar. It also gets answered almost entirely by looking sideways at competitors instead of looking down at the data. We pulled the actual numbers from US Census MRTS (Monthly Retail Trade Survey), Adobe Analytics, Shopify, Triple Whale, and our internal operator-call segment library so the answer for your category is a benchmark, not a guess.
Two reframes drive every other answer in this post. First, BFCM (Black Friday and Cyber Monday) is 3.1% of annual US ecommerce, not 30%. Founders quote the 30% number on calls; the Census and Adobe data say it is 3.1%. Second, sitewide promo frequency varies by 3 to 4x across verticals (apparel runs 8 to 14 a year, electronics runs 3 to 6), and the gap tracks gross margin, not marketing sophistication.
BFCM is 3% of US ecommerce, not 30%
US ecommerce hit $1,431,304 million in 2025 (US Census MRTS, NAICS 4541, electronic shopping and mail-order houses, not seasonally adjusted, sum of January through December 2025). Cyber Week 2025 (Thanksgiving through Cyber Monday) was $44.2B of US online spend per Adobe Analytics, up 7.7% year-over-year. The arithmetic: $44.2B divided by $1,431B is 3.1%.
The "BFCM is 30% of my year" claim shows up on almost every founder call we run in November. It is not true at the channel level, and it almost certainly is not true at your brand level either. November plus December 2025 combined was $290.8B per Census MRTS NAICS 4541, or approximately 20.3% of annual US ecommerce on that same Census basis. (Adobe Analytics reports a smaller Nov-Dec online total of $257.8B. The 20.3% figure uses Census as both numerator and denominator scope, while the 3.1% Cyber Week share mixes Adobe in the numerator and Census in the denominator. See methodology.) The "holiday quarter" really does carry a fifth of online revenue, but it is spread across 8+ weeks, not stacked into BFCM. Across the last two years for which we have both Adobe Cyber Week totals and Census annual totals, Cyber Week's share has held at approximately 3.1% in 2024 ($41.1B of $1,337.3B) and 3.1% in 2025 ($44.2B of $1,431.3B). Flat in share even as the absolute number has grown.
Why this matters for your business: if your annual revenue plan has BFCM at 25 to 40% of the year, you are either building to a fiction or you have a year-round demand problem that BFCM is masking. Both situations get diagnosed the same way: pull your last 24 months of revenue, compute the share that landed in Cyber Week, and benchmark it against your vertical's mix. The market-level number is 3%. Apparel brands routinely land at 6 to 10% concentrated in that week. Electronics and supplements typically land at 2 to 5%. If you are above 25%, you are not a promo-strength story, you are a demand-concentration risk.
How many sitewide promos a year is normal in your vertical
The per-vertical ranges below are synthesized from three sources: Adobe Digital Economy Index category-level discount-depth data, Nebulab's discount-penetration research, and the audited promo counts in our operator-call segment library (anonymized brand-level data, $5M to $150M DTC, 2024 through 2026). They are guardrails, not census-level facts, but the directional spread is consistent across all three data sources.
The full benchmark table below adds typical event duration and discount-penetration bands, which is the metric most founders should be tracking instead of raw promo count.
Vertical Events per year Typical avg discount Typical event duration Discount penetration band Apparel / fashion 8 to 14 20 to 30% off 3 to 7 days 35 to 70%+ Footwear 6 to 10 20 to 30% off 3 to 6 days 30 to 60% Beauty / cosmetics 6 to 10 20 to 25% off 3 to 5 days 25 to 50% Home goods 5 to 9 20 to 30% off 4 to 7 days 30 to 50% Jewelry 4 to 8 15 to 25% off 3 to 6 days 20 to 40% Supplements / nutrition 4 to 8 15 to 25% off 3 to 5 days 25 to 45% Food and beverage 3 to 7 10 to 20% off 3 to 5 days 20 to 40% Electronics 3 to 6 10 to 20% off 3 to 7 days 15 to 30%
Caveat on these ranges. Per-vertical promo-frequency benchmarks are not directly published by Shopify, Adobe, NRF, Klaviyo, Salesforce, or Yotpo. The ranges above are synthesized from category-level discount-depth data (Adobe), discount-penetration research (Nebulab), and audited operator-call data from our segment library. They are guardrails for planning, not census-level facts. The Census MRTS, Adobe Cyber Week, and Triple Whale numbers elsewhere in this post are primary-source.
Why apparel runs so many more promos than electronics
The 3 to 4x spread between apparel (8 to 14 events) and electronics (3 to 6) is not a marketing-sophistication story. It is a gross-margin and inventory-pressure story.
Apparel DTC brands typically carry 55 to 70% gross margin and ship seasonal inventory that has to clear every 90 days. A 25% sitewide discount in apparel still leaves 30 to 45 points of contribution, and the alternative is markdowns at the end of season or carrying stale inventory into the next cycle. Both alternatives are worse. So the discounting is rational at the gross-margin level even when it looks aggressive on the calendar.
Electronics DTC brands typically carry 25 to 40% gross margin and ship products with longer life cycles. A 25% sitewide discount in electronics often clears zero contribution. The category structurally cannot run apparel-style promo cadence without losing money on every promoted unit. Founders new to DTC sometimes copy the apparel calendar into a sub-40%-margin category and wonder why the contribution-margin trend goes negative through Q4. Now you know.
The CAC and conversion numbers that pair with this story sit in our average CAC by ecommerce vertical post and the average conversion rate by ecommerce vertical 2026 benchmark. Read them together. The promo calendar makes sense once you see how the margin structure differs by category.
Cyber Week's revenue mix is shifting toward apparel
The vertical mix at BFCM is heavily apparel-skewed and getting more so. Apparel was 30.5% of tracked BFCM 2024 revenue in the Triple Whale brand sample. In 2025 the same sample showed apparel at 36.0% of $2.9B tracked GMV. Every other vertical lost share. (Shopify's broader merchant sample puts apparel at a lower share of BFCM GMV. Triple Whale's sample skews more apparel-heavy because it over-indexes on growth-stage DTC brands. The directional shift toward apparel shows up in both, but the level is higher in the Triple Whale sample.)
What this means for your business if you are not in apparel: the BFCM auction is getting harder, not easier. Apparel is willing to bid CPMs higher because it has the margin to absorb a 25% off promo plus the customer-acquisition cost. If you are running supplements at 60% margin or electronics at 35% margin, you are competing in the same Meta and Google auction against bidders with structurally more headroom. The defensive play is to under-allocate to BFCM relative to your year-round spend pattern, not over-allocate to "make up for it" with a deeper discount. A 30% off promo from a 35%-margin electronics brand is contribution-negative on the marginal acquired customer. From a 65%-margin apparel brand it is still profitable.
The number to track instead of promo count: discount penetration
Promo count tells you what landed on your marketing calendar. Discount penetration tells you what landed on your P&L. Heavy-promo apparel brands now ship 70%+ of orders with a discount on the year (Nebulab "Stop Killing Your Margins", 2025). That means the "non-promo baseline" most founders mentally protect does not exist in apparel and footwear. Most "non-promo" days are not actually non-promo days, because the welcome-flow code, the abandoned-cart code, the loyalty discount, the affiliate code and the influencer code are all live in the background.
For most operators the fastest discount-penetration audit is one query: of orders shipped in the last 90 days, what share had any discount code applied. If that number is above 50% and you only "ran" four sitewide sales in the quarter, you have a discount problem hiding outside the promo calendar. The fix is not running fewer sitewide sales (those are visible and budgeted). The fix is auditing the welcome flow, the abandoned-cart code, the loyalty tier, and the affiliate stack and capping how many of them can stack on a single order.
For more on how this rolls into year-over-year EBITDA performance, see the related work in our interim CFO services overview. The CFO read on this category of margin leak is consistent: the visible discounts are usually fine. The invisible stacking is what compounds.
How to build a 2026 promo calendar from these benchmarks
Three rules and you have a 2026 promo calendar that maps to your vertical, your margin, and the data:
Rule 1: cap your sitewide-event count at the midpoint of your vertical. Apparel 11, footwear 8, beauty 8, home 7, jewelry 6, supplements 6, food and beverage 5, electronics 4. If you are running materially more than the midpoint, you are pulling demand forward and training customers to wait, which depresses full-price conversion the rest of the year.
Rule 2: leave 6 or more weeks between events. Each sitewide promo needs enough demand recovery time to land into. Stacked promos within a 4-week window cannibalize each other and compress the lift on the second event by 30 to 50% in our segment-library data.
Rule 3: gate your two deepest discounts to BFCM plus one other anchor event. Pick one anchor moment that fits your brand (back-to-school for apparel, Mother's Day for jewelry, Memorial Day for furniture). Run your two deepest discounts of the year there. Cap all other sitewide events at the lower end of your vertical's typical discount band. This protects the perceived urgency and uniqueness of your two anchor events, which is the only durable defense against the "wait for the next sale" customer behavior every category is trending toward.
Cyber Week is 3.1% of annual US ecommerce. The other 96.9% is your real business. If you build your promo calendar to the 3% peak instead of the 97% baseline, you are optimizing the wrong end of the year. Cap your sitewide events at the midpoint of your vertical, leave breathing room between them, and protect the depth on the two events that actually drive customer urgency.
Sources and methodology
We piece this benchmark together from primary US government data, third-party ecommerce analytics, and our own operator-call segment library. The headline shares are primary-sourced. The per-vertical promo-frequency ranges are synthesized.
US Census Monthly Retail Trade Survey (MRTS), NAICS 4541 ("electronic shopping and mail-order houses"). We pulled 36 monthly observations from January 2023 through December 2025 via the Census time-series API. 2025 annual sum: $1,431,304M. November 2025: $134,177M. December 2025: $156,635M. Values in $ millions, not seasonally adjusted. Limitation: NAICS 4541 captures pure-play ecommerce and catalog retailers but excludes online sales by traditional brick-and-mortar retailers (Walmart.com, Target.com, in-store-anchored brand sites). For DTC brand context, 4541 is the more relevant series than the Census Q4 ecommerce-of-retail release.
Adobe Analytics 2025 Holiday Shopping Report (press release "Holiday Shopping Season Drove a Record $257.8 Billion Online", 2026-01-07). Key figures used: Cyber Week 2025 = $44.2B (+7.7% YoY), Cyber Monday 2025 = $14.25B (+7.1% YoY), Nov 1 to Dec 31 2025 = $257.8B (+6.8% YoY). Limitation: Adobe tracks online spend across 1T+ visits to US retail sites, not Census-bureau NAICS. The two sources line up directionally but use different scopes.
Shopify BFCM 2025 recap (press release 2025-12-02). Global GMV $14.6B, +27% YoY. Used as a DTC-heavy-sample proxy, not US-only.
Triple Whale BFCM recaps (2025 and 2024). 2025: $2.9B tracked GMV, apparel 36.0%. 2024: apparel 30.49%. Used for the vertical-mix shift chart. Limitation: brand-sample only (Triple Whale customers, skewed to growth-stage Shopify DTC). Sub-shares below apparel in the 2024 recap are interpolated and should be read as approximate.
Per-vertical promo-frequency ranges are synthesized from Adobe Digital Economy Index 2024 and 2025 holiday reports (category-level discount-depth), Nebulab "Stop Killing Your Margins" (2025) for discount-penetration framing, Yotpo 2026 DTC Brand Comparison (vertical resilience), and our anonymized operator-call segment library (audited promo counts from $5M to $150M DTC brands, 2024 through 2026). Ranges represent the interquartile band of operator behavior. Client names anonymized per editorial policy.
Promo-frequency benchmarks by vertical are NOT directly published by any of Shopify, Adobe, NRF, Klaviyo, Salesforce, or Yotpo. The ranges in this post are synthesized from category discount-depth data, discount-penetration research, and operator-call audit data. They are guardrails, not census-level facts. The Census MRTS, Adobe Cyber Week, and Triple Whale numbers are primary-source.
Update cadence. This page is refreshed quarterly. Next update target: October 2026, after Q3 holiday-prep data lands.
Frequently asked questions
how many sitewide promos a year is normal for a dtc apparel brand?
Eight to fourteen sitewide events is the typical band for DTC apparel in 2026, with the median operator running about eleven. Below eight you are leaving holiday and seasonal revenue on the table. Above fourteen you are training customers to wait for the next sale, which is what most founders are accidentally doing right now.
is bfcm really 30% of my year or is that a myth?
Myth. Cyber Week 2025 was 3.1% of annual US ecommerce ($44.2B of $1.43T per Adobe Analytics and US Census MRTS). November plus December combined was 20.3%. Your individual brand mix can skew higher if you over-index on apparel, but if you are above 25% concentrated in one week you have a year-round demand problem, not a peak-week strength.
what share of annual ecommerce revenue actually happens during cyber week?
Approximately 3.1% in 2025 ($44.2B of $1,431.3B) and 3.1% in 2024 ($41.1B of $1,337.3B), per Adobe Analytics and US Census MRTS NAICS 4541. Cyber Week's share has held in the low 3% range across both years even as the absolute dollars have grown. The peak has not gotten more concentrated, the year has just gotten bigger.
how often should a beauty brand run a sitewide sale vs a gift with purchase?
Beauty's sitewide-sale band is six to ten events per year. Gift-with-purchase and tiered-spend incentives are mostly category-additive on top of that, not replacements, which is part of why beauty discount penetration runs 25 to 50%. If your sitewide-sale count is already at ten, switching the next planned event to a GWP is usually higher-margin than another 20% off.
is discount penetration a better metric than promo count?
Yes, especially in apparel and footwear. Promo count tells you how many calendar events you ran. Discount penetration tells you what share of orders actually shipped with a code. Heavy-promo apparel brands now ship 70%+ of orders with a discount on the year (Nebulab 2025), which means the "non-promo baseline" on the P&L is mostly fictional.
why do electronics dtc brands run fewer sitewide sales than apparel brands?
Margin and inventory pressure. Electronics carries 25 to 40% gross margin in DTC vs 55 to 70% for apparel, so a 25% sitewide discount in electronics often clears zero contribution. Apparel also has seasonal inventory it has to move every quarter. Electronics typically doesn't, so the calendar pressure to discount is structurally lower.
what was cyber monday 2025 worth in real numbers?
$14.25B in US online sales, up 7.1% year-over-year (Adobe Analytics). Largest single online shopping day in US history. As a share of the year, one Cyber Monday equals 1.0% of total annual US ecommerce.
how do i build a 2026 promo calendar from a benchmark instead of copying competitors?
Three rules. Cap your sitewide-event count at the midpoint of your vertical (apparel 11, beauty 8, electronics 4). Leave 6 or more weeks between events so each one has demand to land into. Gate your two deepest discounts of the year (your top 20%+) to BFCM and one other anchor event, and never run a third deep discount in the same quarter.