
Insights
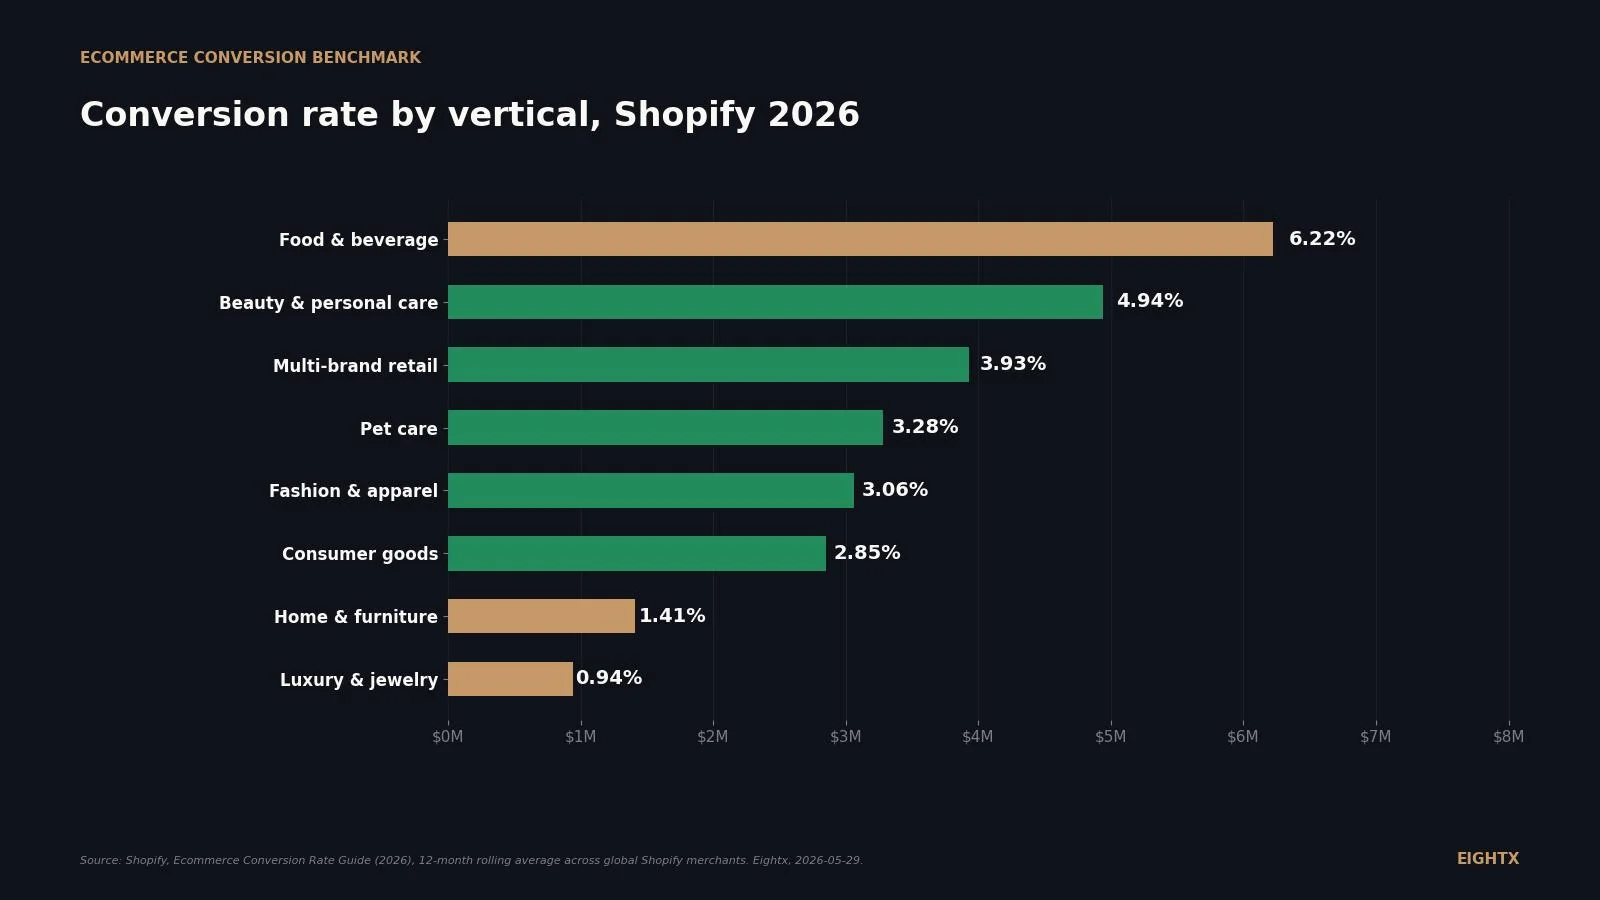
Average ecommerce conversion rate by vertical (2026): food & beverage 6.22%, luxury & jewelry 0.94%, the 6.6x gap operators keep mispricing
Ecommerce conversion rates vary 6.6x by vertical in 2026, based on Shopify data. Food and beverage leads at 6.22%, home and furniture sits at 1.41%, and luxury and jewelry trails at 0.94%. Desktop converts higher than mobile in every vertical. Benchmark against your category ceiling, not the blended 2 to 3% figure, or you will either panic at normal performance or miss a real problem.
Key Takeaways
- Shopify's 2026 conversion-rate table spans 6.22% (food & beverage) down to 0.94% (luxury & jewelry). That is a 6.6x gap inside the same platform, and it has almost nothing to do with optimization.
- The Shopify-store median across ALL industries is 1.4% (Littledata), matching Statista's Q1 2026 global figure. The '2-3% average' most operators quote is the top-quartile threshold, not the median.
- Mobile carries 73-78% of traffic but converts at roughly half the desktop rate (Contentsquare 2026: desktop 3.7% vs. mobile 2.0%). A brand with 80% mobile traffic and a 2.5% blended rate is closer to top-quartile than they think.
- Retail conversion rates compressed 5.5% year-over-year in 2026 (Contentsquare). IRP Commerce shows three of four UK verticals down 18-23% year-over-year. If your number held flat, you outperformed.
- Diagnose with TWO conversion rates, not one. Session-to-order says whether traffic and offer are working. Checkout-completion says whether the funnel breaks at checkout. They tell different stories.
Picture a $20M home and furniture brand reading "average ecommerce conversion is 2.5-3%" in a generic CRO post, then opening their dashboard to see 1.4%. They go hunting for a broken funnel that does not exist. Shopify's own 2026 data puts luxury and jewelry at 0.94% and food and beverage at 6.22%, a 6.6x gap inside the same platform (and home and furniture at 1.41%, still a 4.4x gap versus food and beverage). That gap matters because operators in low-conversion verticals routinely pay for CRO work they did not need and skip the AOV and LTV plays that would actually move the P&L. This post is the right peer-set benchmark: compare to your vertical, not the blended global number, then split desktop vs. mobile, and watch the year-over-year direction. We will also walk through how to diagnose where your funnel is actually breaking using two conversion rates instead of one.
The 2026 by-vertical conversion table
Shopify's published industry data is the cleanest by-vertical conversion benchmark for DTC operators. It is a 12-month rolling average across global Shopify merchants, measured visitors-to-orders. The table:
Industry Average conversion rate Food & beverage 6.22% Beauty & personal care 4.94% Multi-brand retail 3.93% Pet care & veterinary services 3.28% Fashion, accessories & apparel 3.06% Consumer goods 2.85% Home & furniture 1.41% Luxury & jewelry 0.94%
The story behind the spread is category gravity. Food and beverage has high purchase frequency, low consideration time, low AOV, replenishment baked in. Luxury and jewelry is the opposite: high AOV, multi-session research, considered purchase, one-shot orders. The conversion-rate gap is not about which brand has a better site. It is about how each category buys.
This matters because operators routinely benchmark against the wrong row. On a recent call with a multi-category DTC brand, the team asked whether they needed to fix their site at 3.2% conversion. The answer was no: 3.2% is above the typical Shopify all-store median and inside the top-20% threshold. The site did not need attention. The bigger win was elsewhere.
The Shopify-store median is 1.4%, not 3%, and why operators benchmark themselves wrong
Here is the trap. Most operators quote "2-3% is average" because that is the number that floats around in CRO blog posts. The actual Shopify-store median across all industries is 1.4%, per the Littledata benchmark survey. Statista's Q1 2026 global ecommerce conversion is also 1.4%. The convergence is the signal.
The 3% number people quote is closer to the top-20% threshold. Littledata's tier breakdown:
Tier Conversion rate Median (all Shopify stores) 1.4% Top 20% threshold 3.2% Top 10% threshold 4.7%
There is also a methodology trap to watch. Shopify's industry table is visitors-to-orders. Littledata, GA4, IRP Commerce, and most ecommerce platform reports use sessions-to-orders. The same store will report two different numbers because one visitor often has multiple sessions before they buy. Sessions-to-orders is typically 20-40% lower than visitors-to-orders for the same business. If your GA4 says 1.8% and Shopify's industry table says 3.06% for fashion, the funnel is probably not broken. You are comparing two different denominators. Pick one definition and stick with it.
Mobile vs. desktop: the 1.85x gap is still real in 2026
Mobile carries 73-78% of ecommerce traffic and roughly half the conversion rate. Contentsquare's 2026 Digital Experience Benchmark for retail puts desktop at 3.7% and mobile at 2.0%, a 1.85x gap. Luxury splits the same way: desktop 1.4% vs. mobile 0.9%.
Cut Desktop Mobile All retail (blended) 3.7% 2.0% Luxury 1.4% 0.9%
For an operator at $5-50M revenue, the device split changes how you read your blended rate. If your traffic is 80% mobile and your blended rate is 2.5%, you are actually closer to top-quartile than the headline suggests. IRP Commerce reports UK mobile at 62.4% of sales in April 2026 and desktop at 35.7%. The traffic mix differs by region, so when you benchmark, do it against your device mix, not against a US/UK-blended average.
Conversion rate is compressing in 2026
Two independent signals say the 2026 conversion-rate baseline is softer than 2025. Contentsquare reports overall retail conversion declined 5.5% year-over-year. IRP Commerce's April 2026 UK data shows three of four major verticals down double-digits.
Vertical Apr 2026 Apr 2025 YoY change Apparel 1.41% 1.29% +9.6% Beauty & Health 1.99% 2.57% -22.6% Home & Kitchen 2.72% 3.54% -23.4% Food & Drink 0.94% 1.16% -18.7%
The implication for your 2026 plan: do not expect CRO wins to pull your number back to 2024 levels. Reset the bar against the 2026 vertical median, not last year's. If your number held flat year-over-year, you outperformed the market.
Diagnose with TWO conversion rates: session-to-order AND checkout-completion
This is the single most useful diagnostic move for an operator stuck below vertical median. Pull two numbers, not one.
Session-to-order tells you whether traffic, offer, and PDP are doing their job. Checkout-completion tells you whether the funnel breaks at checkout (payment options, shipping cost reveal, account creation, address friction).
Vertical Checkout completion rate Food & beverage 55-65% Pet 50-60% Health & supplements 50-60% Beauty & cosmetics 48-58% Sporting goods 44-54% Apparel & accessories 42-52% Electronics 38-48% Home & furniture 32-42% Cannabis & CBD 30-40% Jewelry 28-38%
Read it like this. If your session-to-order is below vertical median but your checkout-completion is at or above the Cartylabs band, the break is upstream: PDP, offer, traffic quality. If your session-to-order is at median but your checkout-completion is below band, the break is at checkout: payment friction, shipping cost reveal, account creation. Two different diagnoses, two different fixes. One conversion-rate number cannot tell them apart.
US ecommerce GMV is still climbing while conversion rates compress
The 2026 conversion-rate softness is not a demand story. US ecommerce sales (Census Bureau, NAICS 4541 electronic shopping and mail-order houses) hit $128.4 billion in March 2026, up 10.6% year-over-year and at a fresh all-time high.
What you are looking at is two trends running side by side. Sessions and traffic are absorbing the GMV growth (more people shopping, more often), but the funnel is not lifting per-session. That means your 2026 budget should plan for traffic absorption, not for funnel-lift wins. If you doubled ad spend and your conversion rate stayed flat, the math still works because revenue scales with sessions when CVR holds. Plan for the world where you do not get a CRO uplift and the model still has to hit.
What this means for your business
Three concrete actions for an operator at $5-150M revenue.
Stop benchmarking against the global blended number. Pull the Shopify row for your vertical, then split your traffic by device, then compare to Contentsquare's desktop and mobile cuts. A 2.5% blended rate from 80% mobile traffic is not the same as a 2.5% blended rate from 50% desktop. Until you control for vertical and device, you are reading noise.
In low-conversion verticals, fix the constraint, not the symptom. Home, luxury, jewelry, and electronics all sit below 1.5% on Shopify. At a 1.41% conversion rate and a 1% CRO lift, you add 1.4 basis points. At a $400 AOV and a 10% basket lift, you add $40 per order. The unit economics move faster on AOV and LTV in low-CVR verticals. As Matt put it on a recent call with an apparel and sleep brand, conversion-rate at 1.2% was real but the bigger question was always constraint-based: what is the thing holding you back? Fix that first and everything else follows.
Plan 2026 ad budget against the traffic-growth trend, not a CRO lift. US ecommerce GMV is +10.6% year-over-year, and that growth is absorbing into sessions, not into funnel efficiency. Build your model with conversion rate flat, then layer any CRO program on top as upside. A plan that needs a 30 basis point CVR lift to hit budget is a plan that breaks when CRO does not land.
The 2.5-3% "average" most operators quote is actually the top-20% threshold. The real all-store median is 1.4%. Benchmark to your vertical row and your device mix before you decide your funnel is broken, because in low-conversion verticals the bigger win is on AOV and LTV, not CRO.
Sources and methodology
Shopify, "Ecommerce Conversion Rate: How To Improve Yours (2026)." URL: https://www.shopify.com/blog/ecommerce-conversion-rate. The published industry breakdown gives 8 verticals with 12-month rolling average conversion rates. Metric definition is visitors-to-orders, not sessions-to-orders. Global Shopify merchant base. No device split is published in the article itself. Eight rows: Food & beverage 6.22%, Beauty & personal care 4.94%, Multi-brand retail 3.93%, Pet care & veterinary services 3.28%, Fashion, accessories & apparel 3.06%, Consumer goods 2.85%, Home & furniture 1.41%, Luxury & jewelry 0.94%.
Contentsquare 2026 Digital Experience Benchmark, retail conversions guide. URL: https://contentsquare.com/guides/retail-digital-experience/conversions/. Reports overall retail conversion declined 5.5% year-over-year. Device split for all retail is desktop 3.7% vs. mobile 2.0%. Selected verticals: Luxury desktop 1.4% vs. mobile 0.9%, Health & beauty mobile 3.4%. The Health & beauty desktop figure is not visible on the public guide page, only the mobile number, so it is omitted from the table above.
Littledata Shopify benchmark survey. Referenced via 2025-26 benchmark aggregators (the live vertical table on littledata.io is behind a tool flow). Median Shopify-store conversion is 1.4%. Top-20% threshold is 3.2%, top-10% threshold is 4.7%. Metric definition is sessions-to-orders, Shopify-only sample.
US Census Bureau, Monthly Retail Trade Survey (MRTS). Series category_code=4541 (Electronic shopping and mail-order houses, NAICS 4541), data_type_code=SM (sales in millions of dollars), seasonally adjusted. Pulled 2024-01 through 2026-03 (latest available release as of 2026-05-29). 27 months. March 2026 = $128,366M vs. March 2025 $116,016M, +10.6% year-over-year. MRTS lags by approximately six weeks.
IRP Commerce, UK Ecommerce Market Data (April 2026). URL: https://www.irpcommerce.com/en/gb/EcommerceMarketData.aspx. Methodology is sessions-to-orders on a UK SME-heavy panel. Vertical cuts retained: Fashion Clothing & Accessories 1.41% (vs. 1.29% in April 2025, +9.6% YoY); Health and Wellbeing 1.99% (vs. 2.57%, -22.6%); Kitchen & Home Appliances 2.72% (vs. 3.54%, -23.4%); Food & Drink 0.94% (vs. 1.16%, -18.7%). Overall April 2026 mobile = 62.4% of sales, desktop = 35.7%.
Statista, Global ecommerce conversion rate. URL: https://www.statista.com/statistics/439576/online-shopper-conversion-rate-worldwide/. Q1 2026 global visit-to-purchase = 1.4%.
Cartylabs, "Shopify Checkout Conversion Benchmarks" (2026). URL: https://cartylabs.com/blog/shopify-checkout-conversion-benchmarks/. Metric is orders divided by checkouts started, not orders divided by sessions. Ten verticals, expressed as ranges. Use as the second-funnel diagnostic alongside session-to-order benchmarks.
Limitations. Shopify's 8 industries do not cover every vertical operators care about; supplements, electronics, B2B, sports and outdoors are missing. Shopify uses visitors-to-orders; Littledata, GA4, and many platform reports use sessions-to-orders, which is typically 20-40% lower for the same business. Contentsquare's full retail-vertical breakdown sits inside a gated PDF; only narrative excerpts are quotable. IRP Commerce publishes UK-only data on an SME panel, so absolute levels run lower than US Shopify benchmarks but the year-over-year direction is the read. Census MRTS NAICS 4541 is a GMV proxy, not a conversion-rate signal, and is used here only for volume context.
Refresh cadence. This page is a living index, refreshed quarterly. Next update target: 2026-08-29. Shopify updates its 12-month rolling average continuously; Contentsquare publishes annually; IRP Commerce publishes monthly. We re-pull the Shopify table and the latest IRP Commerce month each quarter and update the YoY change where applicable.
For more on diagnosing the funnel underneath a soft conversion rate, see our average ecommerce return rate by vertical benchmark and our average AOV by ecommerce vertical breakdown. For the CFO read on whether to fund CRO or AOV work first, see interim CFO services.
Frequently asked questions
what is the average ecommerce conversion rate in 2026 across all verticals?
The Shopify-store median across all industries is 1.4% (Littledata), and Statista's Q1 2026 global figure is also 1.4% visit-to-purchase. The convergence is the story. The "2-3% average" most operators quote is actually the top-quartile threshold (Littledata puts top-20% at 3.2%, top-10% at 4.7%), not the median.
what is a good conversion rate for a shopify store in 2026?
Depends entirely on your vertical and device mix. Food & beverage tops Shopify's published table at 6.22%, luxury & jewelry sits at 0.94%, and the all-store median is 1.4%. A "good" number is at or above your vertical's published row AND above the top-20% Littledata threshold (3.2%) when you blend desktop and mobile fairly.
why is my apparel store converting at 2% when the average is 3%?
Two reasons usually. First, the 3% number is Shopify's fashion/apparel/accessories row at 3.06%, but that is visitors-to-orders. If you are measuring sessions-to-orders in GA4, the same store will report 20-40% lower. Second, if you are mostly mobile (apparel typically is) your blended rate compresses, because mobile retail converts at 2.0% vs. desktop 3.7% (Contentsquare 2026).
is the 1.41% home and furniture conversion rate normal or is something broken?
It is the vertical median per Shopify's 2026 table, so almost certainly normal. Home & furniture is high-AOV, high-consideration, multi-session by nature. Operators waste cycles fixing CRO at 1.41% when the bigger win is on AOV (raise basket value) and LTV (replenishment, attachments). Confirm by checking checkout-completion separately. If session-to-order is 1.4% but checkout-completion is at or above the Cartylabs home & furniture band (32-42%), nothing is broken at checkout.
how should i benchmark supplements or vitamins conversion when shopify does not publish that vertical?
Use multi-source ranges as a directional benchmark. Contentsquare reports health & beauty mobile at 3.4%; multi-source 2025-26 syntheses peg health and supplements at 2.5-4.5% average, with top-quartile at 4.5%+. Cartylabs checkout-completion for health and supplements lands at 50-60%. These are aggregator-derived, not single primary sources, so use them as a band, not a target.
why is my mobile conversion rate so much lower than desktop?
It is real, not an attribution artifact. Contentsquare's 2026 all-retail benchmark shows desktop 3.7% vs. mobile 2.0%, a ratio of 1.85x. Luxury sits at desktop 1.4% vs. mobile 0.9%. The drivers: smaller screens for product comparison, autofill friction on checkout, slower trust-building on first session. The biggest wins are on mobile checkout (Apple Pay, Shop Pay, Google Pay) and mobile PDP load speed, not on a CRO overhaul.
should i optimize for conversion rate or for aov first if i sell home goods or furniture?
AOV first if your vertical median is below 1.5%. The math: at 1.41% conversion and a 1% lift you add 1.4 basis points. At a $400 AOV and a 10% lift you add $40 per order. The unit economics move faster on basket value and attachments in low-CVR verticals. Run AOV and LTV plays first, then revisit CRO once the offer is monetizing every conversion fully.
what is the difference between sessions-to-orders and visitors-to-orders and which should i use?
Visitors-to-orders divides orders by unique visitors. Sessions-to-orders divides orders by sessions. The same store typically reports 20-40% lower on sessions because one visitor often has multiple sessions before they buy. Shopify's industry table is visitors-to-orders; GA4, Littledata, and IRP are sessions-to-orders. Pick one definition and stick with it across your benchmarking. Comparing Shopify (visitors) to GA4 (sessions) is how operators conclude their funnel is broken when it is not.