
Insights
Average ecommerce ROAS by vertical (2026): Meta 1.93x, Google 3.68x
Meta ROAS across ecommerce averages 1.93x and Google averages 3.68x in 2026, but vertical spread is wide. Fashion and home goods sit below blended average on Meta while health, beauty, and high-ticket verticals pull above. Use vertical-specific benchmarks to set targets, not platform averages, or you will misfire on budget allocation.
Key Takeaways
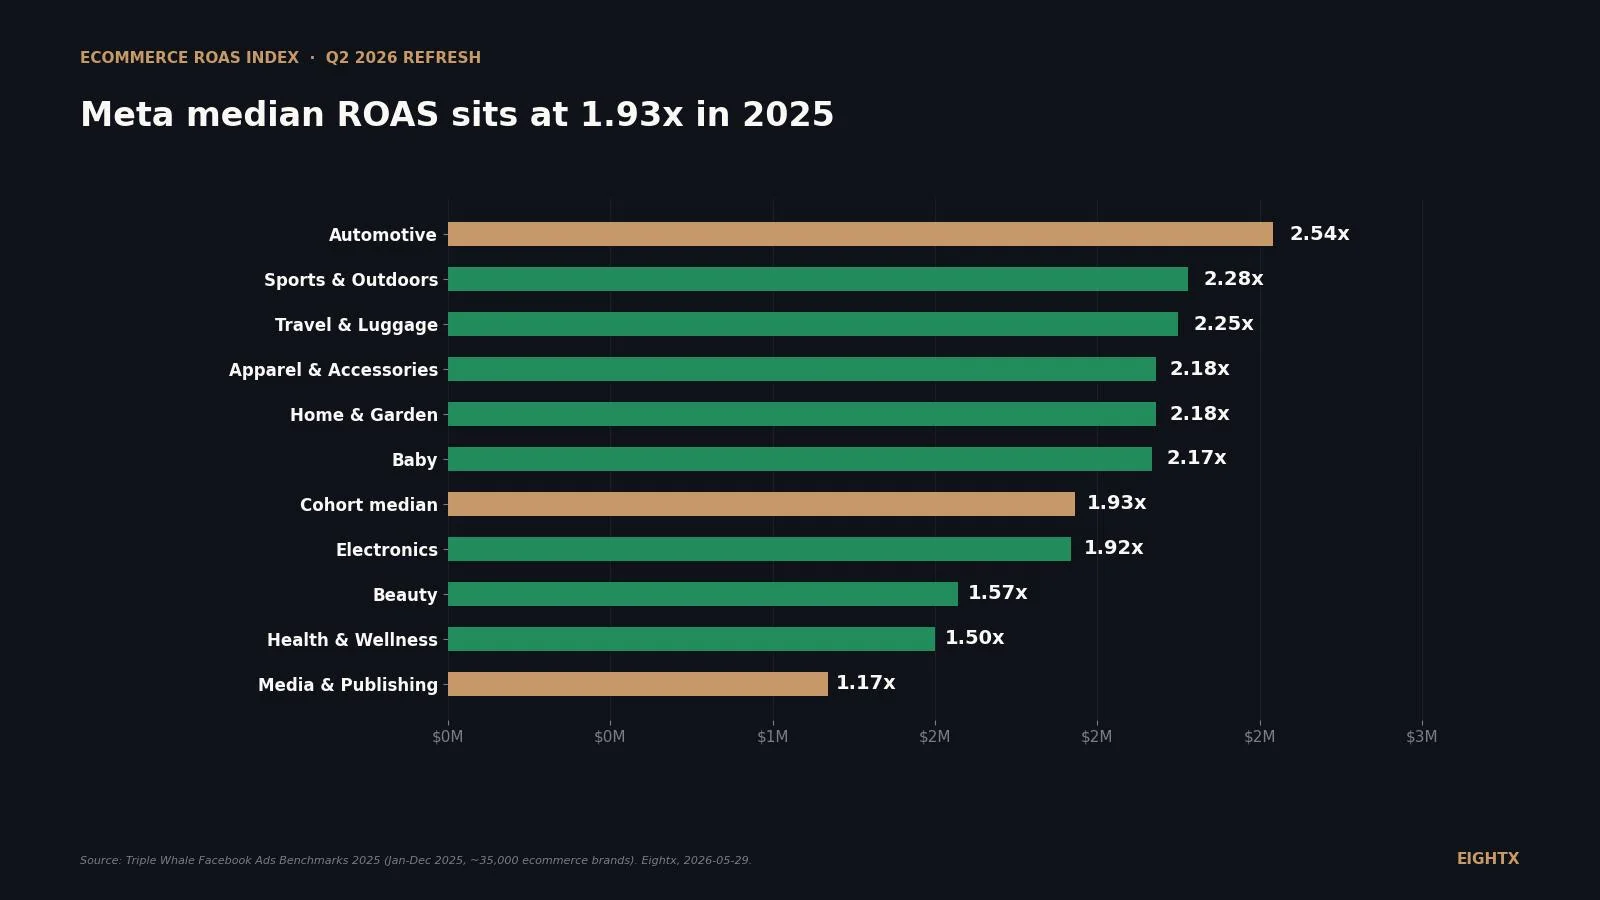
- Meta median ROAS is 1.93x across 35,000 ecommerce brands in 2025 (Triple Whale). The spread inside Meta alone (Automotive 2.54x to Media & Publishing 1.17x) is bigger than the gap between Meta and Google overall.
- Google beats Meta in 8 of 9 paired verticals (median ~50% premium, ranging +23% Sports to +91% Beauty) in the Ryze AI 2026 dataset (15,000 advertisers, $2.8B spend). The Triple Whale overall medians (Meta 1.93x vs Google 3.68x) read as a ~2x channel gap; per-vertical, the spread is narrower. The only flip is Baby Products: Meta 4.1x vs Google 3.8x.
- Your real ROAS target is mechanical, not aspirational: 1 / contribution profit %. A 40% margin business breaks even at 2.5x; at 30% margin, 3.33x; at 25%, 4.0x. Most operators run campaigns against a target their margin structure cannot support.
- Inside a single Meta account, Advantage+ Shopping (4.52x) runs 2x standard prospecting (2.20x). Campaign-type mix is a bigger lever than vertical. Read with caveat: Meta-reported ROAS absorbs branded and retargeting clicks that would have converted anyway.
- US ecommerce GMV hit $326.7B in Q1 2026, up 9.8% YoY (FRED ECOMSA). Demand is growing 10%; paid ROAS is compressing. If your ROAS is flat YoY in a 10%-growth market, you're holding share, not losing it.
The 2026 ROAS spread between Meta and Google sits at roughly 2x at the overall channel median, but it narrows per-vertical. Triple Whale's January to December 2025 dataset of ~35,000 ecommerce brands puts Meta median ROAS (return on ad spend) at 1.93x while Google sits at 3.68x (a 1.9x channel-level gap). Paired-vertical data from Ryze AI tells a tighter story: Google wins 8 of 9 verticals by ~50% on median (range +23% Sports to +91% Beauty), with Baby Products the only flip. Inside Meta alone, the spread between top and bottom vertical (Automotive 2.54x vs Media & Publishing 1.17x) is bigger than the per-vertical platform spread.
The story most operators miss: the absolute ROAS number is mechanically dictated by contribution margin, not media-buying skill. A 3x ROAS on a 30% contribution margin is barely breakeven. A 2x on a 60% margin is fine. Operators should stop benchmarking against the global "good ROAS = 4x" line and start benchmarking three layers: their vertical median on Meta and Google separately, their breakeven ROAS (1 / contribution margin %), and their blended ROAS / MER (marketing efficiency ratio) which is the only number that maps to P&L.
This post is a living index. We refresh it quarterly as Triple Whale, Ryze AI, and Northbeam update their cuts.
The 2026 Meta ROAS table by vertical
Triple Whale's full-year 2025 dataset (the largest publicly disclosed sample at ~35,000 brands) runs from Automotive at 2.54x at the top to Media & Publishing at 1.17x at the bottom. Median sits at 1.93x. Apparel & Accessories and Home & Garden tie at 2.18x. Electronics 1.92x. Beauty 1.57x. Health & Wellness 1.50x.
Eleven of 15 verticals were up year-over-year, but the absolute numbers still sit well below the "3-4x is good" rule that lives in most operator playbooks. A Meta media buyer hitting 2.5x in Apparel is at the top of the distribution, not the middle.
Vertical Meta ROAS 2025 YoY change Automotive 2.54x +1.66% Sports & Outdoors 2.28x +3.77% Travel Accessories & Luggage 2.25x -0.81% Apparel & Accessories 2.18x +3.9% Home & Garden 2.18x +7.04% Baby 2.17x +1.63% Toys, Art & Collectibles 1.93x +2.70% Lifestyle & Boutique 1.93x +2.70% Electronics 1.92x +1.46% Books & Music 1.65x +2.81% Pets & Animals 1.58x +7.07% Beauty 1.57x -1.07% Food & Beverage 1.56x +7.17% Health & Wellness 1.50x -2.78% Media & Publishing 1.17x -2.22%
On a 2023 CFO call with a multi-channel DTC operator, Matt put it this way: "Blended ROAS directly ties to the bottom line in a way I can understand very simply. So for you, it's just managing blended ROAS between things we agree on and targets. What I do realize is I need to give you some scaling where it works for us. We just have to be in communication on blended ROAS." The platform number is for the media buyer. The blended number is for the P&L.
Meta vs Google: Google wins 8 of 9 verticals, but the spread is narrower than the overall medians imply
Two sources, two reads. Triple Whale's overall medians (Meta 1.93x vs Google 3.68x across the full ~35K + ~18K cohorts) print as roughly a 2x channel gap. Ryze AI's paired-vertical cut (15,000 advertisers, $2.8B in combined spend) shows the per-vertical Google premium is narrower: median ~50%, ranging from +23% (Sports & Fitness) to +91% (Beauty). Only Beauty hits a true 2x premium; the rest of the Google-winning verticals run +23% to +66%. Use the channel-level 2x as the broad-stroke story; use the per-vertical 50% premium when you're modeling your own mix.
Vertical-by-vertical from Ryze: Beauty & Personal Care: Google 6.1x vs Meta 3.2x. Fashion & Apparel: Google 4.8x vs Meta 2.9x. Home & Garden: Google 4.2x vs Meta 2.8x. Healthcare and supplements: Google 2.1x vs Meta 1.4x. The only flip: Baby Products, where Meta runs 4.1x vs Google's 3.8x. Community plus emotional creative beats search intent for that segment.
Vertical Google ROAS Meta ROAS Platform winner Beauty & Personal Care 6.1x 3.2x Google (+91%) Fashion & Apparel 4.8x 2.9x Google (+66%) Home & Garden 4.2x 2.8x Google (+50%) Ecommerce (general) 4.0x 2.8x Google (+43%) Electronics 3.9x 2.6x Google (+50%) Baby Products 3.8x 4.1x Meta (+8%) Food & Beverage 3.2x 2.1x Google (+52%) Sports & Fitness 2.7x 2.2x Google (+23%) Healthcare / Supplements 2.1x 1.4x Google (+50%)
If you're a baby brand, weight Meta heavier than the cross-vertical heuristic suggests. For most non-baby verticals, an under-allocated Google share usually maps to easy efficiency wins, but check your category's monthly search-volume ceiling first. Google scales only as far as demand-side intent exists; past that ceiling, incremental dollars go to Meta whether you like the ROAS gap or not.
The ROAS number you should actually target = 1 / contribution margin %
This is the section that does the work for the operator reader. Most paid-media benchmarks publish a number ("4x is good") without telling you the number is conditional on margin. It isn't. Breakeven ROAS = 1 / contribution margin %. A 40% margin brand breaks even at 2.5x. A 30% margin brand breaks even at 3.33x. A 25% margin brand needs 4.0x just to clear breakeven, not to print profit.
InsightIQ's 2026 cut put it directly: "A 3x ROAS on a 20% margin product isn't profitable. You need at least 5x just to break even." That's the conversation operators keep skipping. On a 2025 founder call with a scaling DTC apparel operator, the diagnostic ran the same way every time: "What is your MER or your ROAS right now? And what did you say your gross margin was? Let me pull up the spreadsheet. This is literally your new customer MER." Pull the two numbers up next to each other. Without both, the ROAS figure is noise.
Contribution margin Breakeven ROAS Profitable target (2x breakeven) 20% 5.0x 10.0x 25% 4.0x 8.0x 30% 3.33x 6.67x 35% 2.86x 5.71x 40% 2.5x 5.0x 45% 2.22x 4.44x 50% 2.0x 4.0x 55% 1.82x 3.64x 60% 1.67x 3.33x 65% 1.54x 3.08x 70% 1.43x 2.86x
Reread the Meta vertical table above with this in mind. Beauty Meta median is 1.57x. If your beauty brand runs 50% contribution margin, you break even at 2.0x and the 1.57x category median is structurally unprofitable on Meta alone. The brands that print at category-median Meta are running blended programs (Google plus Meta plus email plus retention) where the blended ROAS clears breakeven, not isolated Meta campaigns.
Inside a single Meta account, campaign type is a bigger lever than vertical
Across the same dataset, Advantage+ Shopping averages 4.52x, retargeting sits at 3.60x median, and standard prospecting runs 2.2x. That's a 2x spread inside the same Meta account, on the same vertical, on the same creative library.
Operators chasing "what's a good ROAS for apparel?" are asking the wrong question. The bigger lever is "what % of my Meta budget sits on Advantage+ Shopping vs standard prospecting?" If you have 50+ conversions per week and your Advantage+ allocation is under 40% of Meta budget, you're leaving ROAS on the table. Read the Advantage+ figure with one caveat though: Meta's reporting includes incremental and non-incremental conversions, so the headline lift over standard prospecting is real but overstated. Run a geo-holdout or a synced lift test if you want the real incrementality number.
The inverse case is also instructive. On a 2025 Google paid-media review with a founder client, the spend printed 1.24x ROAS for the month ($3.8K spend, $5.5K revenue, 34 purchases). When Google ROAS sits materially below 2x, the diagnostic is almost always bidding strategy (max-clicks vs max-conversions) or feed quality, not creative. Different platform, different first question.
The macro: median CAC up, top quartile pulling away
Northbeam's January 2026 cut shows the macro pressure under the vertical numbers. The median business in January 2026: spend up, new-customer revenue down, blended MER barely moved, new-customer MER fell, CAC rose, conversion rate dropped. Top quartile: spend up aggressively, revenue kept pace, blended MER improved, CAC fell.
2026 is a year where the average operator is paying more for less and the top quartile is pulling away. The split is creative and incrementality testing, not channel mix.
Macro demand is still growing. US ecommerce GMV reached $326.7B in Q1 2026 (FRED ECOMSA, seasonally adjusted), up 9.8% year-over-year from $297.7B in Q1 2025. Aggregate ecommerce demand is up roughly 10%, but average ROAS is compressing. That means the dollar growth is being absorbed by more session volume, not better paid-funnel efficiency. Add traffic, expect lower ROAS. If your ROAS is flat year-over-year in a 10%-growth market, you're holding share. If your ROAS is down 10% in a 10%-growth market, you're losing it.
Stop benchmarking against "good ROAS = 4x." Start benchmarking against three layers: your vertical median on Meta and Google separately, your breakeven ROAS (1 / contribution margin %), and your blended ROAS / MER. The first tells you where you stand against peers. The second tells you what you mathematically need. The third is the only number that maps to the P&L.
What this means for your business at $5-150M revenue
Three actions for this week.
Compute your breakeven ROAS today. Pull your last 90 days of contribution margin (revenue minus COGS, payment fees, shipping, fulfillment, return-handling). Divide 1 by that percentage. That's your floor. If your Meta and Google campaign targets are set below that floor, you are funding growth with margin you don't have. Reset the targets before the next campaign launch.
Audit your Meta budget split. Once you have 50+ conversions per week, push your Advantage+ Shopping allocation to ≥50-60% of Meta budget. Add audience exclusions where they protect retention and brand-search incrementality. Cap branded keyword overlap with Google to keep the attribution honest.
Switch your weekly KPI from platform ROAS to blended ROAS / MER. Platform ROAS will keep drifting with attribution methodology. MER ties to your P&L line by line. Keep platform ROAS as a campaign-level steering signal; report blended weekly to the team. On a 2025 founder call, an operator walked through their numbers as "2.5 ROAS at 40% MER, 2.85 at 35%." That's the right lens. The platform number sets the dial; the blended number tells you whether the dial moved the business.
A note on AOV interaction. Luxury brands run at 2-3x on $300+ AOV. Supplements run at 1.4-1.8x on $40 AOV. Both can be profitable. Neither benchmarks against the other. AOV is the third axis under the breakeven calculation: a brand with high AOV can absorb a lower ROAS because the absolute dollar contribution per transaction is higher. Don't compare your supplement Meta ROAS to a luxury apparel brand's. Don't compare your $40 AOV breakeven math to a $300 AOV operator's.
For more on how to set the right ad-spend target as a percentage of revenue, see our ad-spend % of revenue by stage benchmark and our public DTC ad-spend leaderboard.
Sources and methodology
Triple Whale Facebook Ads Benchmarks 2025. URL: https://www.triplewhale.com/blog/facebook-ads-benchmarks. Period: January 1 to December 31, 2025. Sample: ~35,000 ecommerce brands tracked on Triple Whale's platform. 15 verticals with full ROAS, CPM-trend, and year-over-year change. ROAS reported is platform-attributed revenue divided by spend (Meta Ads Manager). Triple Whale is the primary source for the lead vertical table because the sample is the largest publicly disclosed cohort in the 2026 benchmark landscape.
Triple Whale Google Ads Benchmarks 2025. URL: https://www.triplewhale.com/blog/google-ads-benchmarks. Period: January 1 to December 31, 2025. Sample: ~18,000 brands. Overall Google ROAS reported at 3.68x (down 10% YoY). The public post only names 4 verticals (Pets & Animals 2.84x, Travel Accessories & Luggage 4.30x, Health & Wellness 2.12x, Consumer Electronics 3.02x) and presents them narratively rather than as a clean 15-row by-vertical table. That's why we use Ryze AI as the primary source for the paired Google-vs-Meta comparison, even though Ryze has a smaller cohort.
Ryze AI 2026 ROAS Benchmarks. URL: https://www.get-ryze.ai/blog/roas-benchmarks-by-industry-2026-google-meta. Sample: 15,000+ advertisers managing $2.8B in combined ad spend. Reported as median figures (50% perform above, 50% below). 12 verticals with paired Google and Meta ROAS. Aggregator data, not first-party platform data; treat as directionally accurate with ±10% variance from any single source.
Foundry CRO 2026 Ecommerce Marketing Benchmarks. URL: https://foundrycro.com/blog/ecommerce-marketing-benchmarks-2026/. Multi-source synthesis with 100+ metrics. Used for channel-level ROAS (email, SMS, Pinterest, Google Shopping, Meta Advantage+, Amazon, TikTok, Meta overall), Meta Advantage+ Shopping median 4.52x, and CAC ranges by vertical. Triangulates Triple Whale, Ryze, and WordStream-style aggregator data.
Northbeam January 2026 Benchmarks. URL: https://www.northbeam.io/blog/january-2026-benchmarks-the-gap-between-typical-and-top-performing-businesses. Directional only; specific numbers sit behind a download form. Median January 2026 = spend up, new-customer revenue down, blended MER flat, new-customer MER down, CAC up. Top quartile = spend up aggressively, revenue kept pace, blended MER up, CAC down.
FRED ECOMSA. US ecommerce retail sales, seasonally adjusted, quarterly. URL: https://fred.stlouisfed.org/series/ECOMSA. Pulled Q1 2024 through Q1 2026 (9 observations). Q1 2026 = $326,740M vs Q1 2025 $297,701M = +9.8% YoY. ECOMSA is the official Census ecommerce retail-sales figure republished on FRED. Used for the macro-demand context only, not combined with ROAS axes (the scale differs by ~50,000x).
Limitations. Every reported ROAS in this index uses platform-reported attribution, which over-attributes vs incrementality-tested or MMM-tested ROAS by 20-50% depending on vertical and campaign type. Sample sets vary materially: Triple Whale (~35K brands, broader merchant base, lower absolute ROAS) vs Ryze (15K advertisers, median figures, higher absolute ROAS). Cross-source ROAS for the same vertical can vary 30-50% (Beauty Meta runs 1.57x in Triple Whale vs 3.2x in Ryze). "Vertical" definitions are not standardized across sources. The Northbeam January 2026 detail is directional in the public blog post.
Update cadence. This index is refreshed quarterly. Triple Whale updates the Facebook and Google Ads benchmark posts annually (the 2025 cut publishes January and February of the following year), Ryze publishes on a rolling 12-month basis, and Northbeam updates monthly. Next refresh target: 2026-08-29.
Frequently asked questions
what is the average ecommerce roas in 2026 across all verticals?
Meta median ROAS is 1.93x and Google sits at 3.68x across Triple Whale's ~35,000-brand cohort for full-year 2025. Blended ROAS (across all channels combined) lands at 2.04x median and 2.87x average. Half of ecommerce brands are running below 2x blended, which is mechanical math, not bad operating.
what is a good roas for a shopify store in 2026 by vertical?
There is no universal good. A good ROAS is one that clears your breakeven: 1 divided by your contribution margin %. A 40% margin brand needs 2.5x to break even. A 25% margin brand needs 4.0x. Benchmark against your vertical median (Apparel 2.18x Meta, Beauty 1.57x Meta) and your margin together, not either alone.
why is my meta roas lower than my google roas by 2x and is that normal?
A Google-over-Meta gap is normal. Across Triple Whale's overall medians it lands at roughly 2x (Meta 1.93x vs Google 3.68x). Per-vertical, Ryze AI shows Google wins 8 of 9 paired verticals by ~50% on median (range +23% Sports to +91% Beauty), with Baby Products the only flip. Google captures bottom-of-funnel intent (someone already searching for what you sell). Meta captures discovery (interrupting someone in feed). Search-intent traffic converts more efficiently than paid-social discovery traffic, which is the structural reason for the gap.
how do i calculate breakeven roas for my contribution margin?
Breakeven ROAS = 1 / contribution margin %. Use real contribution margin, not gross margin. That means revenue minus COGS, payment fees, shipping, fulfillment, and return-handling cost. Most operators use gross margin and end up surprised when 3x ROAS doesn't print profit.
what's the difference between roas, blended roas, and mer and which should i optimize?
Platform ROAS = revenue Meta or Google says they drove, divided by spend on that platform. Blended ROAS or MER = total revenue divided by total ad spend across all channels. Platform numbers drift with attribution methodology. Blended ROAS / MER ties to your P&L. Optimize daily on platform ROAS, but report weekly on blended.
is meta advantage+ shopping really 2x better than standard prospecting?
The Foundry CRO 2026 cut puts Meta Advantage+ Shopping at 4.52x average vs 2.2x for standard prospecting, drawn from the same Meta accounts and same vertical mix. The real lift is smaller than 2x because Meta-reported ROAS absorbs branded and retargeting clicks that would have converted anyway. Run a holdout test or geo-experiment if you want the incremental answer. But the directional read is right: Advantage+ deserves a larger share of your Meta budget than most operators give it.
should i be running meta or google ads if i'm a $5m to $20m dtc brand?
Both. Google for the share of demand already searching (it converts efficiently and the ceiling is your category's monthly search volume). Meta for incremental new-customer acquisition past Google's ceiling. The right mix is whichever clears your breakeven on each platform separately. Most $5-20M brands underweight Google because they grew up on Meta; if your Google share is under-allocated relative to category search volume, that's the first place to look.
what roas should i target if my contribution margin is 35%?
Breakeven is 1 / 0.35 = 2.86x. For a profitable target with 2x ad-funded gross profit covering overhead and net margin, aim for 5.71x. Most apparel and beauty brands at 35% margin running campaigns against 4x are funding growth with margin they don't have. Pull the target down to your real math or pull your margin up.
how does ios 14.5 and attribution loss change how i should read these roas numbers?
Every benchmark in this index uses platform-reported attribution (Meta Ads Manager, Google Ads). Post-iOS 14.5 and ongoing cookie deprecation, platform-reported ROAS over-attributes vs incrementality-tested or MMM-tested ROAS by roughly 20-50% depending on vertical and campaign type. Meta Advantage+ Shopping in particular over-states because it absorbs branded and retargeting conversions. Read the headline numbers as the ceiling, not the floor; the incremental number is materially lower. The fix is to compare yourself against the same attribution methodology (platform-reported vs platform-reported) and to run periodic geo-holdouts or MMM to calibrate the gap between platform ROAS and true ROAS for your account.