
Insights
DTC ad-spend index Q2 2026: the FY2025 leaderboard from 10-K filings
Public DTC ad spend hit a 13.2% cohort median of revenue in FY2025, based on 10 brands pulled from SEC 10-K filings. Ad spend percentage is a consequence of your CAC efficiency, LTV ratio, and margin structure, not a lever you set directly. Matching a peer median without knowing the underlying unit economics that produced it is how brands overbid on acquisition and compress margin simultaneously.
Key Takeaways
- Public DTC ad-spend intensity is flat, not declining. Cohort median is 13.2% of revenue in FY2025, essentially unchanged from 13.3% (FY2024) and 13.6% (FY2023). Three years of efficiency talk did not move the public benchmark.
- Ad-spend % is a consequence metric, not a steering metric. Operators steer with NCAC (new-customer CAC), MER (marketing efficiency ratio), and organic-sales share. The year-end % is where those decisions land, not what to do tomorrow.
- Expect to run higher than this index if you're a private brand under $50M. The cohort scales from ~$170M (Grove) to $11B (Lululemon), with most brands at $250M+, carrying brand-pull, retention engines, and channel diversification that take a decade to build. Private $5-50M DTC tiers run 15-35%.
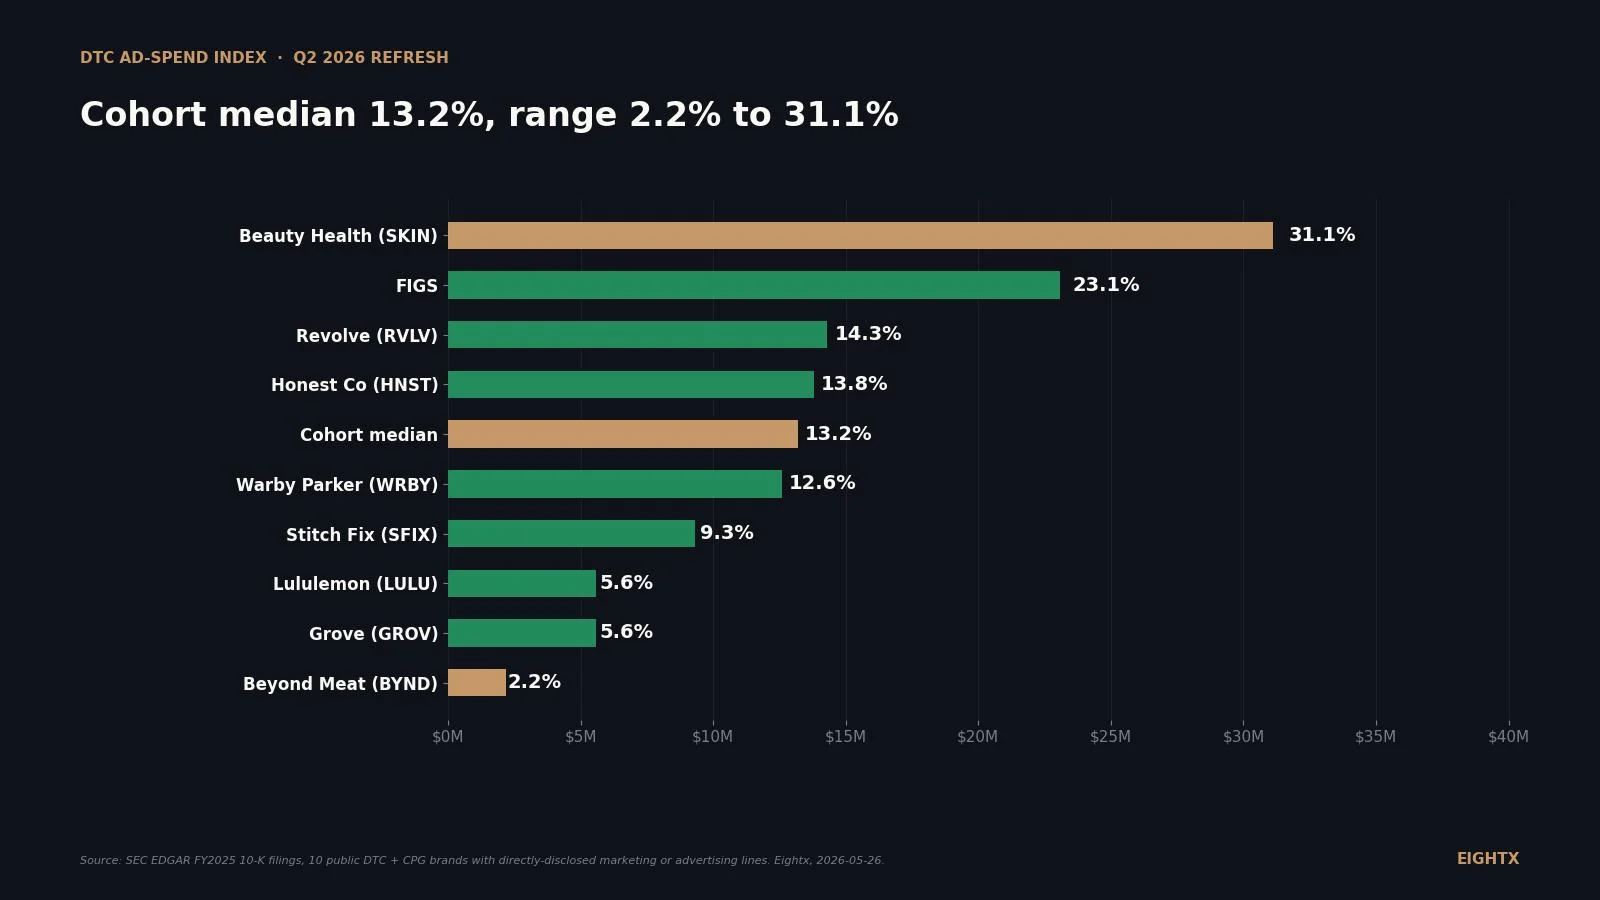
- The spread is bimodal. Beauty Health (SKIN) at 31.1% and FIGS at 23.1% anchor the top quartile; Lululemon (5.6%), Grove (5.6%), and Beyond Meat (2.2%) anchor the bottom. Mature retail-blended brands sit far below pure-DTC scaling brands.
- Reinvestment showed up in FY2025 for some. Honest Co moved from 11.9% to 13.8%, Stitch Fix from 8.3% to 9.3%, Lululemon from 5.1% to 5.6%. Two cut hard: Beauty Health (-4.3pp) and FIGS (-2.4pp).
The Q2 2026 refresh of our public DTC ad-spend benchmark, pulled from FY2025 10-K filings (filed Feb to May 2026) on SEC EDGAR. Across 10 publicly-traded DTC and consumer brands with directly-disclosed marketing or advertising line items, FY2025 marketing as a percent of revenue lands at a 13.2% cohort median, with a 25th percentile of 6.4% and a 75th of 14.3%. Read the leaderboard for who spent what. Then read section 5 for why the % is not the metric you actually run your week on.
For the durable explainer on why this benchmark looks the way it does (gross margin caps, channel mix, stage trajectory), see the public DTC marketing-spend pillar. This index post tracks the what each quarter; the pillar explains the why.
The quarterly read in one paragraph
Public DTC ad-spend intensity has stopped declining. Three years of "we're getting more efficient" narrative on earnings calls has produced a cohort median that moved from 13.6% (FY2023) to 13.3% (FY2024) to 13.2% (FY2025). That is flat. The spread compressed (the 75th percentile dropped from 17.5% to 14.3% as top-quartile outliers like Beauty Health cut hard) but the middle did not move. If you are benchmarking your private brand against "what public DTCs are doing this year," the answer is "the same thing they did last year."
The y-axis is marketing or advertising expense as a percent of revenue. Three lines: cohort median, 25th percentile (the bottom-quartile cutoff), and 75th percentile (the top-quartile cutoff). The FY2020-FY2022 cohort is 8-9 brands (Beauty Health and FIGS IPO'd in 2021 and join from there); the FY2023-FY2025 cohort is the full 10.
FY2025 leaderboard: who spent what
Beauty Health (SKIN) leads at 31.1%, down from 35.4% the prior year but still 2.4 times the cohort median. FIGS sits second at 23.1%, also declining. Then a tight cluster between 12% and 15% (Revolve, Honest Co, Bark, Warby Parker) that anchors the middle of the cohort. Stitch Fix at 9.3%, then Lululemon and Grove tied at 5.6%, with Beyond Meat at 2.2% well below everyone else. Beauty challengers at the top, mature retail-blended brands at the bottom, pure-DTC scaling brands in the middle.
The full data for each ticker, ranked high to low, with the line item each company actually reports.
Ticker Company Sub-segment FY end Marketing line ($M) Revenue ($M) % of revenue SKIN Beauty Health Beauty CPG 2025-12-31 93.6 300.8 31.1% FIGS FIGS Scrubs / apparel DTC 2025-12-31 145.9 631.1 23.1% RVLV Revolve Apparel DTC 2025-12-31 175.4 1,225.7 14.3% HNST Honest Co Personal care DTC 2025-12-31 51.2 371.3 13.8% BARK Bark Inc. Pet DTC 2025-03-31 62.1 484.2 12.8% WRBY Warby Parker Eyewear DTC 2025-12-31 110.2 871.9 12.6% SFIX Stitch Fix Apparel subscription 2025-08-02 117.3 1,267.2 9.3% LULU Lululemon Apparel DTC + retail 2026-02-01 617.5 11,102.6 5.6% GROV Grove Collaborative Personal care DTC 2025-12-31 9.7 173.7 5.6% BYND Beyond Meat Food CPG 2025-12-31 6.1 275.5 2.2%
What changed this quarter
Two brands cut hard: Beauty Health dropped 4.3 percentage points (35.4% to 31.1%), continuing a two-year compression program; FIGS dropped 2.4 points (25.5% to 23.1%). Four brands reinvested: Honest Co moved from 11.9% to 13.8% as profitability stabilized, Stitch Fix from 8.3% to 9.3%, Lululemon from 5.1% to 5.6%, and Grove from 5.0% to 5.6%. The rest sat roughly flat.
Beyond Meat is the standout the other way. At 2.2% of revenue ($6.1M absolute), they are well past "efficient" and into starvation. When gross margin is 2.8%, the ad line cannot fund itself. Founder-call evidence from our own work matches: when private brands cut ad spend to the bone, it is almost always a cash-flow decision, not a marketing-strategy decision. We expect Beyond Meat is in that mode now.
Operators tracking platform-level spend should also note: Tinuiti's Q1 2026 benchmark report shows Google search ad spend up 14% year-over-year and Instagram up 28% among managed advertisers; Triple Whale reports Meta CPMs up 20% in 2025 with Meta still 68% of typical DTC ad mix. The platform tailwinds and headwinds are still moving, but the 10-K bottom-line ratios are not. The public brands are absorbing rising CPMs by reallocating across platforms rather than expanding the overall % line.
Year-over-year changes
Ticker FY2024 % of rev FY2025 % of rev Δ (pp) Direction SKIN 35.4% 31.1% -4.3 Declining (efficiency) FIGS 25.5% 23.1% -2.4 Declining (efficiency) RVLV 14.8% 14.3% -0.5 Roughly flat HNST 11.9% 13.8% +1.9 Reinvesting BARK 13.0% 12.8% -0.2 Roughly flat WRBY 12.4% 12.6% +0.2 Roughly flat SFIX 8.3% 9.3% +1.0 Reinvesting LULU 5.1% 5.6% +0.5 Roughly flat GROV 5.0% 5.6% +0.6 Roughly flat BYND 2.6% 2.2% -0.4 Starvation level
Why the cohort median has stopped declining
There is a floor under the cohort median around 13% that the broader narrative does not explain. Gross margin caps how much of revenue you can spend acquiring it; retention compounds, but slowly; channel-mix shifts (more Meta and less Google, or vice versa) move the platform mix but not the total. The pillar at /blog/marketing-spend-percent-revenue-public-dtc walks through the structural reasons in detail.
The contrast worth noting: the CMO Survey (April 2026) reports total marketing budgets across the broader economy fell to 9.0% of revenue, the lowest since 2021. Yet public DTC ad-intensity held at 13.2%. The public DTC cohort has under-cut the broader market less, not more. Translation: DTC is structurally more marketing-dependent than the economy at large, and the cohort is not going to get below 13% without breaking the model.
How operators should read this index
The single most important thing to understand about this benchmark is what it is not. Ad-spend as a percent of revenue is a consequence metric. It is where your year-end numbers land. It is not a steering metric, the kind of dial you turn on a Monday-morning call.
The steering metrics are different. NCAC (new-customer CAC) is the live cost of acquiring a new buyer this week. MER (marketing efficiency ratio) is total revenue divided by total marketing spend across all channels, including organic. Organic-sales share tells you how dependent you are on paid in the first place. Those three numbers move on a weekly cadence; the year-end ad-spend % is the residue.
Practical: when one of our clients runs at 33% organic-sales share and asks if they should "scale Meta," the answer is rarely "spend more on Meta." Pushing paid cannibalizes already-free demand and the blended MER collapses faster than the new-customer line improves. The org/paid mix sets the ceiling on how much paid you can absorb. That decision shows up in the year-end ad-spend % a year later, but the steering happens at the NCAC and MER level.
For the private-DTC operator benchmarking against this index: expect to run higher. The cross-source picture from Common Thread, Yotpo, and our own client work puts private DTC marketing intensity at 22% to 35% for $1M-$5M brands, 20% to 30% at $5M-$10M, 18% to 28% at $10M-$25M, and 15% to 22% at $25M-$100M. You probably touch the public-cohort 13% only after you cross $100M with a real retention engine. Use the index as a "have I overshot or undershot?" check, then go back to NCAC, MER, and organic-share to decide what to do about it.
Public DTC ad-spend % has held at 13% for three years. Private DTC brands run 15% to 35% depending on stage. Both numbers are consequence metrics. The thing you actually steer with is NCAC, MER, and organic-sales share. The year-end ratio is where those decisions land. Benchmarking your % tells you whether you overshot or undershot; it does not tell you what to do tomorrow.
Sources and methodology
Cohort selection. Started from a broader candidate list of 13 publicly-traded DTC and consumer brands (the pillar 10 plus Olaplex, Brilliant Earth, and Oddity Tech), then filtered to the 10 with cleanly disclosed marketing or advertising line items in XBRL: SKIN, FIGS, RVLV, HNST, BARK, WRBY, SFIX, LULU, GROV, BYND. The pillar post at /blog/marketing-spend-percent-revenue-public-dtc uses a slightly different 10-brand set that includes ELF Beauty, Vital Farms, and YETI based on MD&A text extraction. This index sticks to direct XBRL disclosures for data integrity at the cost of cohort breadth.
Excluded with reason. ELF Beauty rolls marketing into aggregate SG&A and the 21.4% pillar figure traces to MD&A "marketing and digital" text disclosure, not a single XBRL line. Vital Farms is the same. YETI stopped publishing AdvertisingExpense in 10-K XBRL after FY2023 ($75.5M / $1,658.7M = 4.55%) so they cannot be carried forward consistently. Olaplex (OLPX) and Brilliant Earth (BRLT) report SG&A aggregate only. Oddity Tech (ODD) files as a 20-F foreign filer with a taxonomy mismatch.
Marketing-spend definition. For each brand we use the selling-and-marketing line as reported in its annual report; where a company books advertising separately we use that line, and where selling expense is reported distinct from G&A (as with FIGS) we use the cleaner selling-expense disclosure.
Fiscal-year-end variations. Lululemon's FY2025 ended 2026-02-01. Bark's FY2025 ended 2025-03-31 (filed June 2025). Stitch Fix's FY2025 ended 2025-08-02. All others are calendar-year. The chart x-axis label "FY2025 (fiscal years ending Dec 2025 through Feb 2026)" reflects this spread. The cohort median absorbs roughly six months of macro variance across constituent FY ends; for a quarterly index this is acceptable, but worth flagging if you compare against a single-month macro reference like an April 2026 CPI print.
Accession numbers (FY2025 10-Ks). SKIN 0001628280-26-017376 (filed 2026-03-12). FIGS 0001628280-26-012333 (2026-02-26). RVLV 0001193125-26-071307 (2026-02-25). HNST 0001628280-26-011634 (2026-02-25). BARK 0001819574-25-000024 (2025-06-04). WRBY 0001504776-26-000006 (2026-02-26). SFIX 0001628280-25-042782 (2025-09-25). LULU 0001397187-26-000020 (2026-03-17). GROV 0001841761-26-000010 (2026-03-05). BYND 0001655210-26-000022 (2026-04-09).
Cohort percentile method. For each year, marketing-or-advertising / revenue ratio is computed per ticker, then 25th, 50th (median), and 75th percentiles taken across the cohort using the inclusive method. FY2023-FY2025 has all 10 brands reporting consistently. FY2020-FY2022 has 8 or 9 brands because Beauty Health and FIGS IPO'd in 2021 and only join the cohort from then. Pre-FY2023 percentile values should be read as informative-but-thinner. The top-quartile tail is fat: two brands (SKIN at 31.1%, FIGS at 23.1%) sit well above the 14.3% p75 in FY2025, so the cohort spread is wider than the p25-p75 band alone suggests.
Update cadence. This index refreshes quarterly after each earnings-season wave settles. The next refresh lands early August 2026, picking up Q2 2026 10-Q data and any late-filing annual 10-Ks (notably, FY2026 BARK in June and FY2026 SFIX in September will arrive in subsequent waves rather than this one). Each refresh updates the dateModified, recomputes the cohort median, and bumps the variableMeasured block.
What we're watching for the Q3 2026 refresh
Four flags worth tracking. First, does YETI restart AdvertisingExpense disclosure in their next 10-K and re-enter the cohort. Second, does Beauty Health break below 30% for the first time, completing their three-year compression. Third, does any brand re-trace upward in absolute terms (the contra-narrative trigger). Fourth, does ELF Beauty's recent debt-fueled marketing wave finally produce a discrete marketing line item in 10-K XBRL rather than the MD&A-extracted "marketing and digital" reference.
The next refresh lands in early August 2026. Read the Eightx blog for the rest of the public-company benchmark cluster between now and then.
For deeper context on what these numbers mean for stage-by-stage DTC operators, see the companion posts: ad-spend-by-stage benchmarks, the DTC marketing-spend trend 2020-2026, and marketing-spend by DTC vertical.
Frequently asked questions
what did public dtc brands actually spend on marketing in fy2025?
The cohort median was 13.2% of revenue across 10 publicly-traded DTC and consumer brands with directly-disclosed marketing or advertising line items in their FY2025 10-Ks. The 25th percentile sat at 6.4%, the 75th at 14.3%. The range ran from Beyond Meat at 2.2% to Beauty Health at 31.1%.
why is the public median 13% when my private dtc brand runs 25-35%?
Two reasons. Most public brands in this cohort sit at $250M+ revenue (the cohort scales from ~$170M at Grove to $11B at Lululemon) with brand-pull, retention engines, and channel diversification that take a decade to build. They also blend retail-channel revenue (Lululemon's stores, Warby Parker's optical shops) into the denominator, which dilutes the ratio. If you're a private brand under $50M, expect to run higher than this index, not lower.
is ad-spend percent of revenue actually the right metric to steer my business?
No. It is the year-end consequence of what you did, not the dial you turn day-to-day. Operators steer with NCAC (new-customer CAC), MER (marketing efficiency ratio across all channels), and organic-sales share. The % line on a 10-K is the result that drops out of those three. Treat this index as a benchmarking artifact, not a steering wheel.
did public dtc marketing spend actually go down in 2026?
Not really. The cohort median moved from 13.6% (FY2023) to 13.3% (FY2024) to 13.2% (FY2025). That is essentially flat. Two brands cut hard (Beauty Health down 4.3 percentage points, FIGS down 2.4) but four others reinvested (Honest Co, Stitch Fix, Lululemon, Grove all moved up). The net effect was approximately zero.
which public dtc brand spent the most on advertising in fy2025?
Lululemon, at $617.5 million. That is the largest absolute dollar amount in the cohort by a wide margin, but it is only 5.56% of their $11.10 billion in revenue because retail-channel sales dilute the ratio. Lululemon also grew advertising dollars 14% year-over-year while keeping the percent roughly flat.
how often is this index updated?
Quarterly. The next refresh lands in early August 2026 with Q2 2026 10-Q data and any late-filing FY 10-Ks. February brings the year-end-just-ended 10-K wave, May catches the rest, August adds Q2 10-Qs, November adds Q3 10-Qs. Subscribe to The Margin if you want the update in your inbox.
what's the difference between this index and the marketing-spend-percent-revenue-public-dtc article?
The pillar at /blog/marketing-spend-percent-revenue-public-dtc is the durable explainer: it walks through why public DTC marketing intensity looks the way it does, the role of gross margin, channel mix, and stage trajectory. This index is the quarterly leaderboard: who spent what last quarter, who moved, what to watch next. Read the pillar once. Bookmark this index.
why do some companies report 'marketing expense' and others report 'advertising' or 'selling'?
XBRL taxonomy gives companies a few legitimate places to land the line. Beauty Health reports SellingAndMarketingExpense, FIGS reports a clean SellingExpense, Revolve and Warby Parker and Honest Co use MarketingExpense, and Lululemon, Beyond Meat, Bark, Grove, and Stitch Fix all use AdvertisingExpense. We keep the labels distinct in the methodology so you can see exactly what is going into each ratio. ELF Beauty and YETI are excluded from this index because they roll their marketing into aggregate SG&A and you cannot pull a clean number from XBRL alone.