
Insights
Average ecommerce shipping cost as a percent of revenue, by vertical (2026)
Shipping as a percent of revenue ranges from 4.2% in high-AOV furniture to 14.8% in low-AOV pet consumables. If you're above your vertical benchmark, the fix is usually rate negotiation, zone skipping, or a dimensional weight audit, not a price increase.
Key Takeaways
- BLS PPI for couriers, messengers, and US postal services hit 225.7 in April 2026, up 10.5% year-over-year and up 54.2% since December 2019. Carrier rates are not flat; they reaccelerated in early 2026.
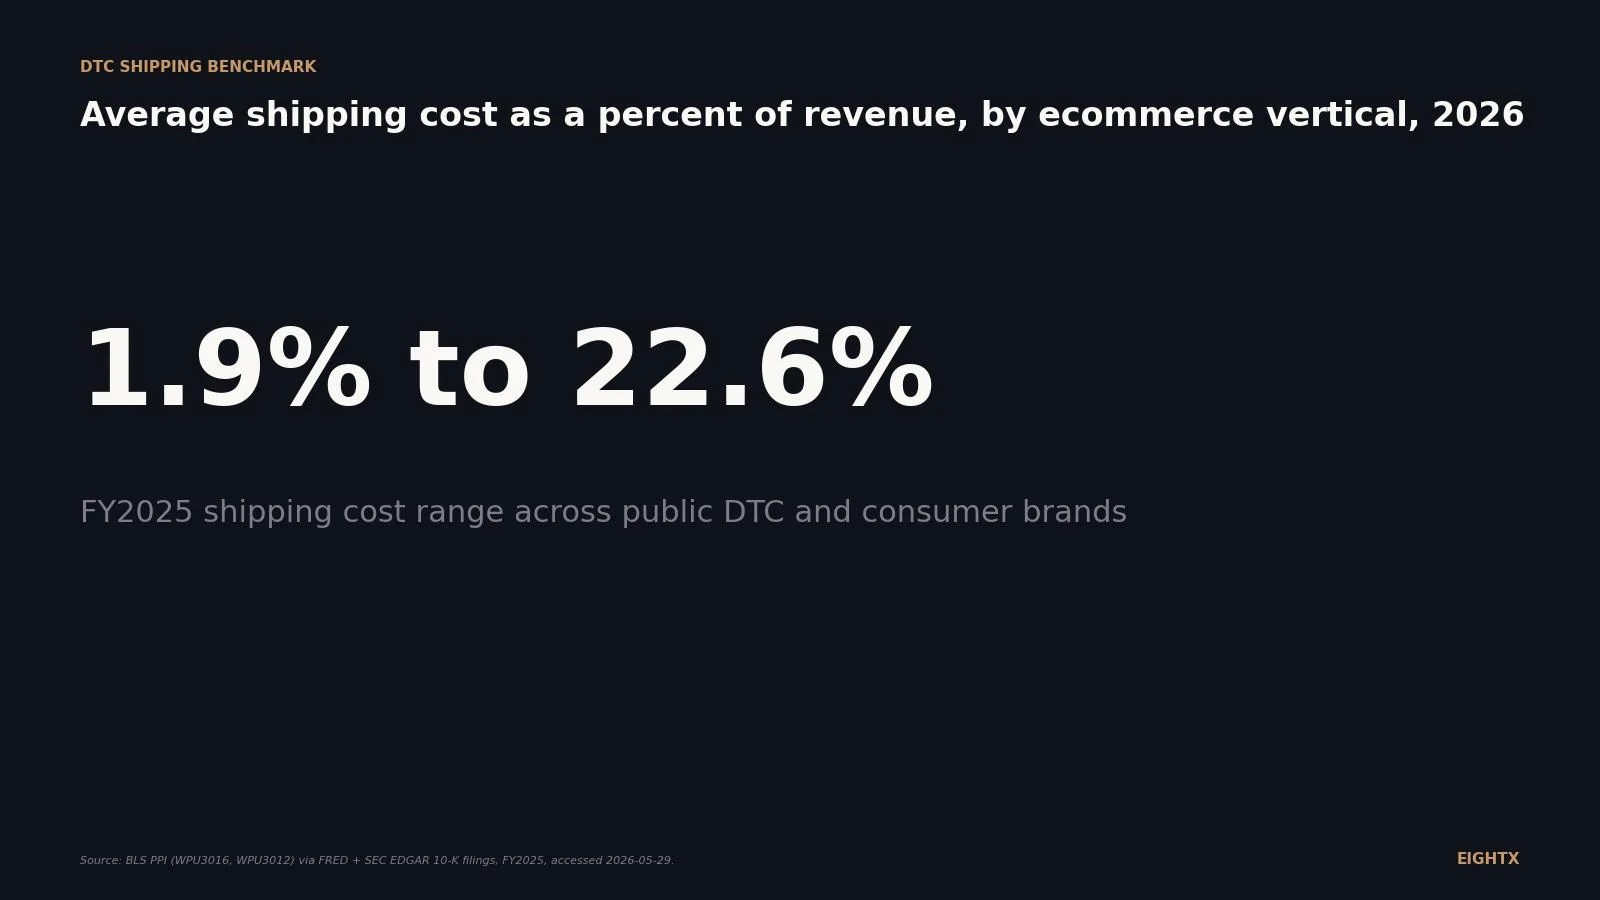
- Public DTC and consumer shipping disclosures for FY2025 span 1.9% to 22.6% of revenue. Grove Collaborative tops the list (household CPG, DTC subscription); Beyond Meat sits at the bottom (mostly wholesale, pallet-shipped).
- Warby Parker shows the channel-mix story in one filing: 2.9% of total revenue, but 10.5% if you allocate the entire shipping line to the e-commerce slice. The number you compare against depends on how you cut your own P&L.
- Truck-freight PPI ran negative for most of 2023 and 2024, then snapped back to +15.2% year-over-year in April 2026. Inbound freight is reflating after a two-year deflation cycle, which matters for your COGS line, not your outbound parcel line.
- There is no single industry-average shipping percentage. Channel mix, average order value, subscription cadence, rate of returns, and what gets bundled into the line each shift the answer by hundreds of basis points. Benchmark to your vertical's range, not the mean.
Operators ask us this question almost every week: "what should my shipping cost be as a percent of revenue?" The honest answer is that there is no clean single number, because most private brands do not disclose it and the few public companies that do disclose it bury the line in fulfillment, SG&A, or COGS in different ways. But we can triangulate. The producer price index for couriers and parcel carriers hit a record in April 2026, and the FY2025 10-Ks from public DTC and consumer brands span 1.9% to 22.6% of revenue. The operator takeaway is a vertical-specific range plus a method to read your own P&L the way 10-Ks do.
This post is the living index. We refresh it quarterly when BLS data and the next batch of 10-K filings land. The job is to give you a defensible benchmark for your 2026 carrier renewal, packaging review, and free-shipping-threshold conversation.
What the BLS data is telling us about parcel rates in 2026
The Bureau of Labor Statistics producer price index for couriers, messengers, and US postal services (FRED series WPU3016) is the closest public proxy for what brands actually pay UPS, FedEx, USPS, and regional last-mile carriers. April 2026 hit 225.7 on an index where June 2009 equals 100. That is up 10.5% year-over-year, the highest single-month year-over-year print since July 2025, and up 54.2% since December 2019.
That 54% number is the one operators miss. Compounded over six years, courier inflation has swamped almost every other COGS line item except wages. If your shipping line as a percent of revenue is flat between 2019 and 2026, you are either eating the increase (margin compression) or you have offset it with AOV growth, dim-weight optimization, or a carrier mix shift. Most $5M to $50M DTC brands have done some of column B and some of column A.
The April 2026 reacceleration matters because it broke the brief 2024 plateau, when courier PPI ran +3.7% year-over-year in January 2024 and gave operators a false sense that the worst was behind them. UPS and FedEx both announced 2026 general rate increases of about 5.9% headline at the end of 2025, but the surcharge components (fuel, residential, peak, dim weight) push effective increases for most shippers into the 7 to 8% range. The index data confirms the all-in pass-through is closer to the higher number.
Why the industry-average question is the wrong question
Three operators with the same headline revenue can have shipping cost percentages that differ by 1,500 basis points, all of them perfectly defensible. Asking "what is the average?" is like asking "what is the average rent?" The variance by category swamps the mean.
Five things move the answer.
Channel mix. A pure-DTC brand pays parcel rates per package. An omni-channel brand with stores fulfills part of its volume in-store. A wholesale-heavy brand ships pallets to distribution centers at truckload rates. Warby Parker discloses 2.89% of total revenue, but the e-commerce slice alone is 10.5% if all shipping is allocated to it. Beyond Meat sits at 1.9% precisely because 95% of its volume is wholesale.
Average order value. Parcel rates have a fixed cost component (the carrier minimum) plus a variable component (weight, dim, zone). A $40 AOV brand spends more of each dollar on shipping than a $200 AOV brand for the same physical package. Beauty brands at $40 to $90 AOV concentrate fixed shipping cost more painfully than apparel brands at $80 to $150.
Subscription cadence. A subscription box ships more frequently per dollar of revenue than a one-off purchase brand. Grove Collaborative's 22.6% fulfillment line is partly the subscription cadence problem: customers receive a box monthly, and each box costs the same to ship regardless of basket size.
Return rate. Apparel typically runs 30 to 50% returns by industry estimates, which doubles the outbound-plus-inbound parcel cost per net sale. Beauty typically runs 5 to 10%. The vertical's return rate is baked into the band ranges in Table 2 below.
What is bundled into the line. Fulfillment usually includes warehouse rent, depreciation, pick-pack labor, and packaging on top of carrier fees. Shipping-and-handling usually means just the carrier charge plus packaging. That is why Grove's 22.6% fulfillment cost looks 20 points higher than Warby Parker's 2.89% shipping-and-handling cost even though both are public DTC consumer companies. Read the 10-K footnote before you compare.
What public 10-Ks actually disclose for FY2025
We pulled the FY2025 10-Ks from six public DTC and consumer brands, classified each company by vertical and channel mix, and noted what each company's shipping line actually includes. The four with the cleanest numbers go in the chart.
Brand Vertical Channel mix Shipping or fulfillment line % of net revenue Where it shows up Grove Collaborative Household CPG DTC subscription (~100%) Fulfillment cost (segment note) 22.6% ($39.3M / $173.7M) 10-K segment note Warby Parker Eyewear E-commerce 28% / Retail 72% Shipping and handling cost 2.89% total; 10.5% if allocated to e-commerce slice Notes to financial statements Beyond Meat Food/CPG ~95% wholesale Outbound shipping and handling 1.91% ($5.3M / $277M) SG&A footnote Lulu's Women's apparel DTC ~100% Bundled into COGS Not separately disclosed; gross margin 43.2% COGS note (MD&A discussion) Duluth Trading Apparel DTC + 65 stores Inbound in COGS, outbound in SG&A Not separately disclosed MD&A discussion Aterian Small appliances Amazon FBA + FBM Logistics + platform commissions + ads combined 47.0% combined Income statement line
The three clean disclosures (Grove, Warby Parker, Beyond Meat) anchor the range. The three messy ones (Lulu's, Duluth, Aterian) show why most operators struggle to benchmark themselves: the disclosures bundle differently across filings.
Aterian's 47% line is the cautionary tale for Amazon FBA-heavy electronics. The single line bundles FBA fulfillment fees, Amazon referral fees of 8 to 15%, and a slice of online advertising. Backing the bundle out, the pure-shipping component is roughly 30 to 35% of revenue (estimated, since Aterian does not split the line in the filing), which is extreme because small-appliance dim weight and storage tier scale FBA fees fast. If you sell low-AOV, large-dim-weight products on Amazon, plan your unit economics around a 30%+ combined fulfillment line.
Inbound truck-freight is reaccelerating, separately from outbound parcel
Operators tend to read the freight headlines and conclude that all shipping is flat, because most general business press tracks truck-freight pricing rather than parcel pricing. The two indices have detached.
Truck-freight PPI (BLS WPU3012) ran deeply negative through 2023 and stayed weak through 2024, while courier PPI never went below +3.7% year-over-year. For two years, your inbound containers and your outbound parcels were moving in opposite directions on inflation. April 2026 changed that: truck-freight snapped to +15.2% year-over-year, the highest print since the 2022 spike, while courier ran +10.5%. Both are now inflating, but for different reasons.
If your P&L has shipping bundled into one line ("freight and fulfillment"), the 2023-2024 deflation in trucking quietly subsidized your rising parcel bill, which is why the line looked flatter than it actually was. If April's +15.2% YoY print holds in May (the next BLS release lands in mid-June), that subsidy is ending. Inbound freight from China, Vietnam, or domestic suppliers would then print higher into Q3 2026 while outbound parcel is still rising. Both inflating at once for the first time since 2022. One month is one print, not a confirmed reacceleration, so plan the contingency now and confirm with the May data.
The practical read: separate inbound from outbound on your P&L this quarter. They have different cost drivers, different negotiation levers, and different vendor relationships. Treating them as one line for two years cost a $50M home brand on a recent call "a full point of contribution margin per box."
How to benchmark your own shipping cost as a percent of revenue
This is the operator section. Five steps.
Step 1: Isolate outbound parcel from inbound freight. Pull your last 12 months of UPS, FedEx, USPS, and regional carrier invoices for outbound. Separately, pull your container and truckload invoices for inbound. They are different cost-driver families and should not be in the same percentage.
Step 2: Net shipping subsidy against customer-collected shipping revenue. If you charge customers $7.95 for shipping but spend $11 to ship, your shipping cost is $3.05 net per order, not $11 gross. Most brands report the wrong number to themselves because they look at the carrier bill in isolation. Lulu's 10-K explicitly discusses this trap.
Step 3: Separate platform fees from carrier fees. If you sell on Amazon, your FBA fulfillment fee bundles ship plus storage plus pick-pack. If you sell on Shopify Markets, your fee bundles ship plus duty plus customs. Strip the platform fee out so you can compare your "true" carrier cost to the benchmarks. Then track platform fees as their own line.
Step 4: Calculate against net revenue, not gross. Refunds, returns credits, and discounts come off the top. A 15% shipping cost against gross revenue is meaningfully different from 15% against net revenue if your return rate is 35%.
Step 5: Compare against your vertical band. Use Table 2 below. Each band is a range, not a single number. Use the narrow end if your AOV is at the high end of your vertical; use the wide end if you have a high return rate or heavy products.
Vertical Channel Typical AOV Shipping or fulfillment range (% of net revenue) Why this range Apparel (DTC) Pure DTC, 30-50% returns $80-150 12-18% High return rate doubles outbound plus inbound parcel cost Apparel (omni-channel) DTC + stores $80-150 6-10% Store-fulfilled volume dilutes parcel burden Beauty (DTC) Pure DTC, low returns $40-90 9-14% Lower AOV concentrates fixed parcel cost per order Household CPG (DTC subscription) Pure DTC $30-60 18-25% Heavy or bulky boxes plus low AOV plus high cadence Food/CPG (DTC, refrigerated) Pure DTC $50-90 15-22% Cold chain and insulated packaging is the swing factor Food/CPG (wholesale) DSD or distributor n/a (B2B) 1-3% Pallet to RDC, not parcel to door Electronics or appliances (FBA-heavy) Marketplace $30-120 25-40% combined with FBA fees FBA bundles ship plus storage plus ad attribution Electronics or appliances (DTC own site) Pure DTC $80-300 6-12% Dim weight is the swing factor for large units Supplements (DTC subscription) Pure DTC $40-80 10-15% Lightweight and low dim weight, but high subscription frequency Furniture and home (DTC) Mixed $400-2000+ 10-18% LTL freight pricing, oversize surcharges
A founder of an $8M beauty brand on a recent call put the read this way: "I keep getting asked what the average shipping cost is by my board. There is no average. There is our AOV, our package weight, our zone mix, and our carrier tier. If any of those four change, the answer changes." Use the band; do not chase the mean.
Four levers if you are above your vertical's band
If your benchmarked shipping cost is above the wide end of your vertical's range, four levers move the number, ordered roughly by effort.
Raise the free-shipping threshold. Operators on recent calls describe a consistent pattern: every $10 they lift the threshold tends to raise AOV 4 to 8% and cut conversion 1 to 3%. In our client work and on the calls in our corpus, that math holds above $75 AOV; below it, the conversion hit eats the AOV gain. This is an operator-corpus pattern, not a published benchmark, so test it on your own traffic for a full month before deciding.
Diversify to regional carriers. UPS, FedEx, and USPS still dominate, but regional carriers (OnTrac, LSO, GLS US, Spee-Dee in the Midwest) have closed the service gap and run 10 to 20% cheaper for in-region zones. If you have meaningful zone concentration (a single region taking a large share of your volume), a regional carrier on that lane is usually the highest-ROI carrier change you can make.
Optimize for dim weight. Carriers charge by the greater of actual weight or dim weight (length times width times height divided by a divisor). A right-sized box can drop dim weight by 30%, which compounds over hundreds of thousands of packages. If you ship under-utilized boxes, packaging review pays for itself in one quarter.
Pass surcharges through. UPS and FedEx run 50+ surcharges (residential, address correction, additional handling, peak, fuel). Most brands eat them silently. A surcharge audit ($2K to $5K from a third party) typically recovers 4 to 8% of annual spend. The pure-cost lever, not a customer-facing change.
Shipping is the silent margin killer. Most brands are right that they cannot benchmark to "the industry average," because no clean industry average exists for a private $5M to $50M DTC operator. But every brand can benchmark to its vertical's band, isolate inbound from outbound, and read its 10-K-equivalent the way public companies report theirs. Do that quarterly and the line stops eating margin in the dark.
For more on the cost side of your 3PL relationship, see our DTC 3PL cost index covering warehouse wages, diesel, headcount, and parcel PPI together, and the DTC layoff and hiring tracker for the labor market context behind the 3PL squeeze. Renewal negotiations interact directly with the broader interim CFO services work because shipping is usually the second-largest variable cost on a DTC P&L after paid media.
What we are watching next
The next BLS PPI release covering May 2026 lands in mid-June. We will be watching whether courier PPI prints another +10%+ year-over-year (confirming the reacceleration) or steps back to the +5 to +7% range it ran in 2024-2025. We will also be watching truck-freight PPI: if it stays at +15% YoY in May, the inbound freight reflation is real and your Q3 budget needs to absorb it.
On the 10-K side, Stitch Fix and Revolve both have FY2026 reporting calendars that put their next filings in the late summer window. Adding two more apparel-DTC disclosures sharpens the apparel-vertical band considerably and is the highest-priority addition to this index.
Sources and methodology
BLS Producer Price Index, courier and parcel series. Monthly series WPU3016 (couriers, messengers, US postal services), Index Jun 2009 = 100, not seasonally adjusted. Pulled via FRED on 2026-05-29. Range pulled: 2019-01 through 2026-04 (latest available). Year-over-year transforms were calculated from the same series using FRED's units=pc1 parameter to ensure consistency.
BLS Producer Price Index, truck transportation of freight. Monthly series WPU3012, Index Jun 2009 = 100, not seasonally adjusted. Pulled via FRED on 2026-05-29 for the 2019-01 through 2026-04 window. This series is the closest public proxy for inbound truckload pricing, which differs structurally from outbound parcel.
SEC EDGAR full-text search. We queried EDGAR for 10-K filings containing "shipping and handling" and "percentage of" and "net revenue" with forms=10-K between 2024-01-01 and 2026-05-29. The query returned 1,002 results; the top consumer and DTC hits were manually reviewed. Filings pulled and read: Grove Collaborative (accession 0001841761-26-000010), Lulu's Fashion Lounge (0001104659-26-036884), Duluth Holdings (0001193125-26-117508), Warby Parker (0001504776-26-000006), Beyond Meat (0001655210-26-000022), Aterian (0001437749-26-009285).
Disclosure classification framework. For each 10-K we noted four things to normalize across filings. First, where shipping is booked: COGS, SG&A, or a third "fulfillment" category. Second, whether inbound freight is included. Third, whether fulfillment is the same as shipping (it usually is not; fulfillment includes warehouse rent, depreciation, and pick-pack labor on top of carrier fees). Fourth, whether customer-collected shipping revenue is netted against expense or reported gross. This is the framework that makes the bar chart comparable across the four cleanly-disclosed brands.
Limitations. Most private DTC brands at $5M to $50M revenue, which is our target reader, do not disclose this number at all. The 10-K cohort skews larger ($150M+ revenue) and overrepresents omni-channel operators. Private operators should expect to be at the high end of these bands or above, particularly for pure-DTC subscription models. The BLS WPU3016 measures wholesale prices charged by carriers; the rate any individual shipper pays depends on contract tier, zone mix, dim-weight profile, and surcharge exposure. The index is the trend, not the level.
Update cadence. This index is refreshed quarterly when BLS PPI data and the next batch of 10-K filings land. The next refresh targets late August 2026 to capture May and June BLS prints plus any Q2-reporting calendar 10-Ks.
Frequently asked questions
what is the average shipping cost as a percent of revenue for an ecommerce brand in 2026?
There is no clean single number, which is why we publish a range instead. Public DTC and consumer 10-K disclosures for FY2025 land between 1.9% (Beyond Meat, mostly wholesale) and 22.6% (Grove Collaborative, DTC subscription with fulfillment bundled in). For a private $5M to $50M pure-DTC brand the right band depends on your vertical: apparel pure-DTC sits 12 to 18%, household CPG subscription 18 to 25%, electronics on Amazon FBA 25 to 40% combined. Pick your vertical row in the table above.
why does grove collaborative spend 22% on fulfillment while beyond meat spends 2%?
Two different businesses with two different ship profiles. Grove Collaborative ships heavy household CPG (laundry, cleaners) in subscription boxes direct to homes, parcel rates apply, AOV is low and dim weight is high. Beyond Meat ships pallets of frozen patties to grocery distribution centers; that is truckload pricing per pound, not parcel pricing per package. The 20-point gap is the gap between parcel-to-door and pallet-to-DC.
how do i benchmark my shipping cost as a percent of revenue against my vertical?
Five steps. One, isolate outbound parcel from inbound freight (different cost drivers). Two, isolate shipping subsidy from customer-collected shipping revenue (net the second against the first). Three, separate platform fees (Amazon FBA, Shopify Markets) from carrier fees if you are marketplace-heavy. Four, calculate against net revenue, not gross. Five, compare against the vertical band in Table 2 above. If you are at the high end of your band, the levers in section 6 apply.
is shipping cost in cogs or sga and does it matter?
It matters because it changes your gross margin. Lulu's books shipping and handling inside cost of goods sold, so a rising shipping bill shows up as gross margin compression on their P&L. Beyond Meat books outbound shipping in SG&A, so a rising shipping bill shows up as operating margin compression. Same dollars, different line. When you benchmark, normalize: total shipping spend divided by total revenue, regardless of where it sits in the P&L.
how much have parcel rates actually gone up since 2019?
Up 54.2% from December 2019 (index 146.4) to April 2026 (225.7) on the BLS WPU3016 series, which is the closest public proxy for what brands pay UPS, FedEx, USPS, and regional carriers. Year-over-year inflation is back in double digits in April 2026 (+10.5%), the highest single-month year-over-year print since July 2025. Plan your 2026 budget on continued pass-through, not on the brief 2024 plateau.
should i charge customers for shipping or eat it and bake it into product price?
Depends on your AOV. Operators on recent calls describe a free-shipping threshold pattern that only works above $75 AOV: in their tests, every $10 they raise the threshold tends to lift AOV by 4 to 8% but cut conversion by 1 to 3%. Below $75 AOV the conversion hit outpaces the AOV lift and you are better off charging shipping or baking a smaller percentage into product price. Above $150 AOV most operators we talk to can absorb the full carrier bill if contribution margin is 40%+. Test it on your own traffic before deciding.
what's the difference between fulfillment cost and shipping cost in a 10-k?
Fulfillment cost in a 10-K usually bundles outbound carrier charges, warehouse rent and depreciation, pick-pack labor, and packaging. Shipping cost in a 10-K usually means just the carrier charge plus packaging. That is why Grove Collaborative's 22.6% fulfillment number is so much higher than Warby Parker's 2.9% shipping-and-handling number even though both are public DTC consumer brands. Read the footnote carefully before comparing across filings.
why is amazon fba so expensive when it shows up as 47% of revenue for aterian?
Aterian's 47% line bundles three things: shipping (FBA fulfillment fees), platform commissions (Amazon referral fees of 8 to 15%), and a slice of online advertising. The pure-shipping component is roughly 30 to 35% of revenue for a small-appliance brand on FBA (estimated, since the disclosure is bundled), which is extreme because FBA fees scale with dim weight and storage tier. If you sell low-AOV, large-dim-weight products on Amazon, expect a 30%+ combined fulfillment line.