
Insights
Average ecommerce SKUs per brand by revenue band: 40 named US Shopify brands, 2026
27% of live Shopify stores carry fewer than 10 products. At $10M to $50M, focused DTC brands typically run 50 to 300 SKUs, while catalog operators stretch to 500 to 2,000. Named benchmarks show SKIMS at 475 SKUs and Fashion Nova at 232,832. The SKU-count inflection point is around $50M, where inventory carrying cost starts punishing undisciplined assortment more than it punishes lean catalogs.
Key Takeaways
- 27% of all 2.85M live Shopify stores carry fewer than 10 products (Storeleads State of Shopify 2026, updated 2026-05-22). Only 3.2% carry more than 1,000.
- The $50M+ revenue band splits cleanly into two archetypes. Focused brands (SKIMS 475, Allbirds 970, Honest 199, Liquid Death 212, AG1 3) run 50 to 500 SKUs. Catalog brands (Fashion Nova 232,832, Princess Polly 15,982, Alo 3,401, Vuori 3,630) run 2,000+. FIGS sits visually in the catalog cluster at 3,246 total products but is the canonical focused brand on revenue concentration: 170 core SKUs drive more than 60% of FY25 revenue (see section 2).
- FIGS disclosed its lean-SKU thesis in its FY25 10-K directly: 17 core scrubwear styles in 10 core colors drove more than 60% of FY25 net revenue. A $500M+ public DTC brand built on 170 core SKUs before sizing.
- Variant count is the real SKU count. Apparel multiplies 8 to 15x size and color from product to SKU (FIGS 10x, SKIMS 17x). Supplements and personal care multiply 1 to 3x. Plan your warehouse and your buying cycle off variant count, not product count.
- Seven of ten public DTC and consumer 10-Ks reviewed for 2025-26 disclose SKU rationalization as a margin lever (Honest, Aterian, A.K.A. Brands, Stitch Fix, Beauty Health, Owlet, Cricut). The brands that scaled SKUs into the 2021-2023 demand wave are spending 2024-2026 cutting them back.
No one publishes the cross-tab of average SKUs per brand by revenue band. We checked. Perplexity in May 2026, Parallel.ai deep research, and a sweep across Shopify, BigCommerce, Storeleads, Salesforce State of Commerce, eMarketer, Klaviyo, and Salsify reports all came up empty. That gap matters because the SKU question is the one operators ask most and the one consultants answer worst. So we built the benchmark ourselves: 40 named US Shopify brands from $5M to $1B+, cross-referenced against Storeleads' population-wide distribution across 2.85 million live Shopify stores, plus the 10-K SKU rationalization disclosures from seven public DTC and consumer brands filed in 2025 and 2026. What you should expect from this page: a defensible read on where your SKU count sits, who else is at your range, and whether to cut, hold, or expand.
No one publishes this benchmark, so we built it
The Storeleads State of Shopify 2026 report (updated 2026-05-22) is the closest thing to a public benchmark. It publishes the products-per-store distribution across the full Storeleads-tracked Shopify universe but does not cross-tab it against revenue band. We layer the two together below.
The headline finding from the population data: 27.0% of all 2,846,874 live Shopify stores carry between 1 and 9 products (769,733 stores). Another 17.0% carry 10 to 24 products. Add the 12.7% in the 25 to 49 bucket and the 11.3% in the 50 to 99 bucket and you get 68.0% of every live Shopify store carrying fewer than 100 products. Only 5.6% of stores carry more than 1,000.
That distribution is the floor. Most stores are not enterprise catalogs. They are founder brands or small operators carrying a focused product set. When operators ask us "is my SKU count high or low?", the answer for the vast majority of brands at $1-5M revenue is: high. The Shopify population is overwhelmingly focused.
The named-brand sample is where it gets interesting. We pulled product_count and variant_count from Storeleads for 40 named US Shopify brands spanning $5M founder brands to $1B+ Plus accounts. Revenue bands are estimates anchored on 10-K disclosures (for HNST, FIGS, RVLV, AKA, ATER, HLLY, SKIN), news reporting (for SKIMS, Liquid Death, Vuori, Princess Polly), and Storeleads rank percentile elsewhere. Each band assignment is flagged in methodology.
Two things jump off the chart. First, the range across $50M+ brands is more than four orders of magnitude wide (3 products to 232,832). Second, the brands cluster into two visible groups: one under 500 products, one over 2,000. There is almost nothing in between. That is not noise. That is two distinct business models.
The $50M+ band splits into two archetypes
Call them the focused archetype and the catalog archetype. Once you cross roughly $50M in revenue you have already picked one, whether you realize it or not.
Focused archetype: 50 to 500 SKUs. SKIMS at 475. Allbirds at 970. Magic Spoon at 266. Liquid Death at 212. Honest Company at 199. Mejuri at 19. Harry's at 33. Dr. Squatch at 35. LMNT at 12. AG1 at 3. These brands compete on a tight assortment that customers come to them for specifically. The customer thinks "I need scrubs, I go to FIGS-core" or "I need shapewear, I go to SKIMS." Inventory turns faster, marketing is simpler, and the brand promise is one-sentence clear. The operator cost of this archetype is that every new product launch is a leadership-level decision and a real bet. You cannot hide a bad launch in a 10,000-SKU catalog.
Catalog archetype: 2,000 to 25,000+ SKUs. Princess Polly at 15,982. Fashion Nova at 232,832. True Classic at 1,712. Alo Yoga at 3,401. Vuori at 3,630. Brilliant Earth at 2,445. Marine Layer at 2,219. (FIGS is plotted with the catalog cluster at 3,246 visible products because that is its raw product_count, but on revenue concentration it behaves like a focused brand. 170 core SKUs drive 60%+ of revenue. We treat it as a focused-archetype example in the next paragraph.) These brands compete on assortment depth. The customer thinks "I need a new outfit, I go to Princess Polly because they have everything in my size and aesthetic." Inventory turns slower, safety stock and warehouse cost are higher, and gross margin is structurally lower because you cannot consolidate buying power across a wide tail. The benefit is that the marketplace dynamic locks customers in: once a customer has built their loyalty around one-stop assortment, switching cost is real.
The FIGS FY25 10-K disclosure is the cleanest example of how the focused archetype actually works inside a public company. As of December 31, 2025, FIGS reported it offered 17 core scrubwear styles in 10 core colors. That is 170 core SKUs before sizing. Those 17 styles represented more than 60% of FY25 net revenue. The remaining 40% of revenue sat in the long tail (3,246 total products, 32,631 total variants). The 80/20 hides a 60/0.5 inside it: 60% of revenue from 0.5% of the SKU base.
That is the operator framing worth stealing. If the 17 styles drive 60%+ of the revenue, every decision (buying, warehouse, photography, paid media, email) should be optimized around those 17. The other 3,229 products are options the customer can browse, not the engine.
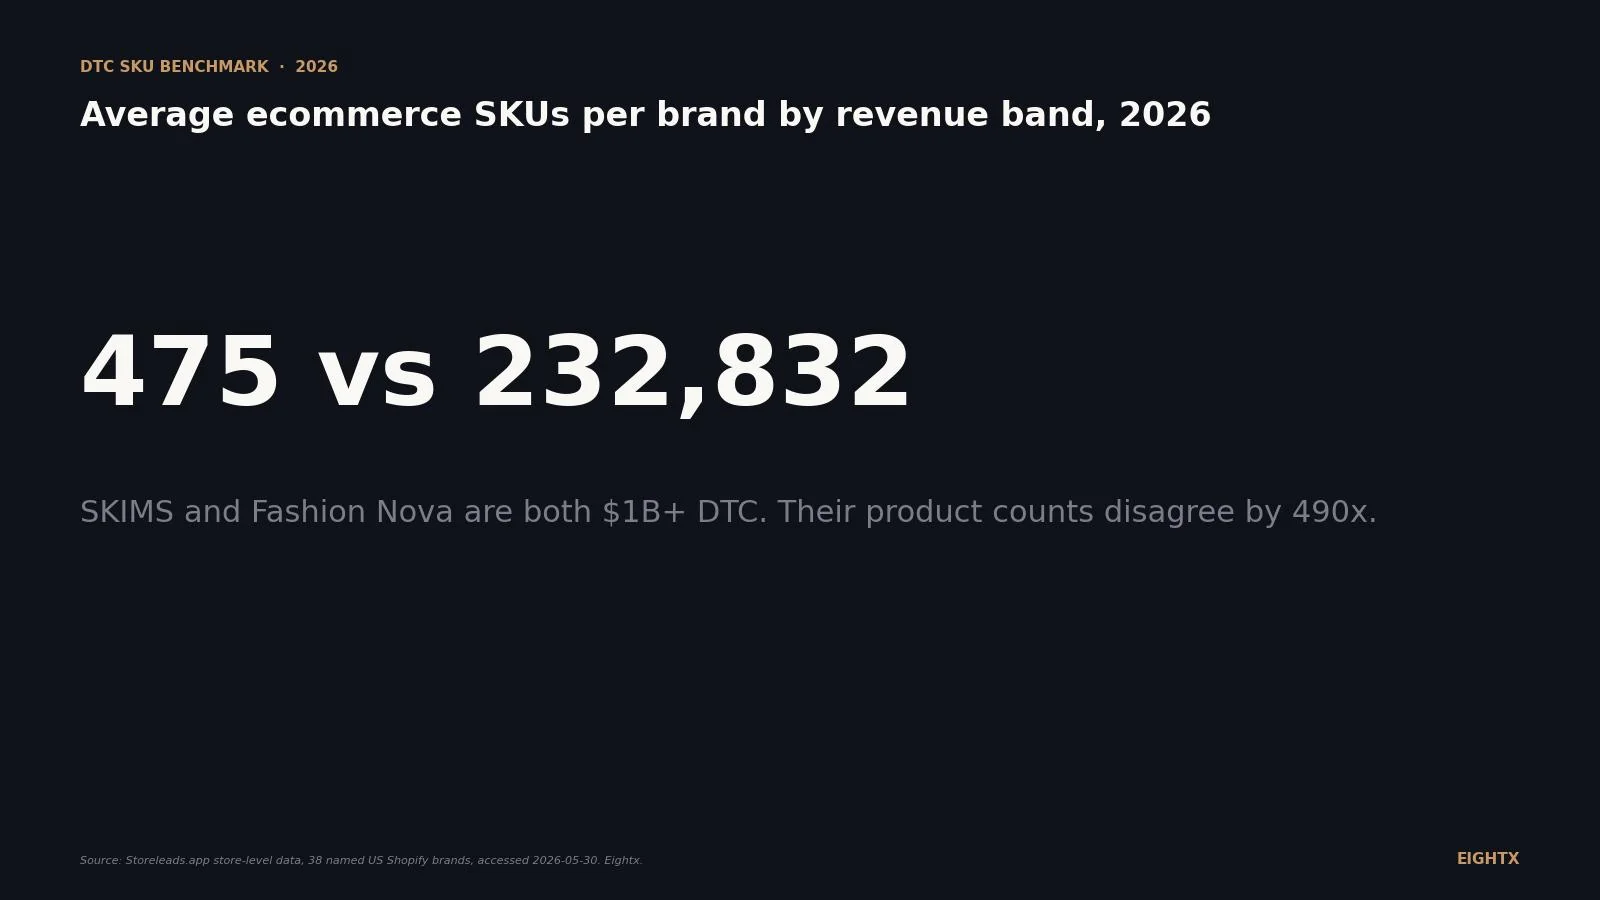
The two largest brands in our 40-brand sample (Fashion Nova at 232,832 products and AG1 at 3) are both $1B+ DTC operations. Their product counts disagree by 490x. If you needed one chart to argue that SKU count is a strategy choice not a function of scale, that is the chart.
Variant count is the real SKU count, and apparel multiplies 10x
Operators talk about "products" and "SKUs" interchangeably. In Shopify they are not the same thing. A product is a parent listing. Each size and color combination of that listing is a variant. The variant is the stock-keeping unit. It is what your 3PL pulls and packs, what your safety stock is calculated against, and what shows up on your warehouse rack.
The variant-to-product multiplier is dramatic, and it splits by category.
Apparel with size and color (FIGS, True Classic, Naadam, Princess Polly, SKIMS, Alo Yoga, Vuori, Chubbies) runs a median of roughly 10x. FIGS specifically: 3,246 products, 32,631 variants, ratio 10.1x. SKIMS: 475 products, 8,339 variants, ratio 17.6x. True Classic: 1,712 products, 14,204 variants, ratio 8.3x. Apparel and footwear that vary only on size (Allbirds, Rothy's, Marine Layer) run a notch lower at around 9.5x.
Beauty and personal care (ILIA, Jones Road, TULA, Tushy, Peepers) sits at about 2.2x. Most SKUs are one shade or one formulation; the variants come from bundling and limited shade-line extensions. Food and beverage (Liquid Death, LMNT, Magic Spoon, Graza, Kettle & Fire) runs roughly 3x, driven by flavor and pack-size variants. Supplements (Huel, AG1) run lowest at around 2.5x. Hardgoods and single-product brands (Peak Design, Ridge, Dr. Squatch) run roughly 1.7x.
What to do this week if you are an apparel brand: pull your variant count, not your product count, against your warehouse capacity. If you have 400 products you likely have 4,000 SKUs. Your 3PL is billing you off the latter. Your safety stock and reorder triggers should be calibrated off the latter. The product count is a marketing number; the variant count is a finance and operations number.
Public DTC brands are cutting SKUs to restore margin
We pulled the 2025 and 2026 10-K filings from ten public DTC and consumer brands and checked whether each disclosed SKU rationalization, assortment reduction, or styles-cut as a margin lever. Seven of ten did.
Company Ticker 10-K filed SKU rationalization disclosed? Context Honest Company HNST 2026-02-25 Yes Discontinued underperforming SKUs across baby and beauty Aterian ATER 2026-03-23 Yes Cut 50%+ of SKUs from 2023 to 2026 to restore margin A.K.A. Brands AKA 2026-03-05 Yes Princess Polly and Petal & Pup SKU portfolio review Stitch Fix SFIX 2025-09-25 Yes Cut active styles to improve inventory turn Beauty Health SKIN 2026-03-12 Yes Hydrafacial consumables SKU consolidation Owlet OWLT 2026-03-09 Yes Hardware SKU consolidation Cricut CRCT 2026-03-04 Yes Materials and accessories SKU rationalization Revolve Group RVLV 2026-02-25 No (growing) Active styles up year-over-year Once Upon a Farm OFRM 2026-03-16 No (growing) New SKU launches across baby/toddler GrabAGun PEW 2026-03-12 No Expanded SKU base
The seven-of-ten pattern is the story. Brands that scaled their SKU count into the 2021 through 2023 demand wave are spending 2024 through 2026 cutting it back. The three exceptions (Revolve, Once Upon a Farm, GrabAGun) are still in net-growth mode, but Revolve is the only one of them with the gross margin profile to do it sustainably. Aterian's disclosure is the most aggressive: cutting more than 50% of SKUs from 2023 to 2026 to restore margin. That is the public-company version of what a private $30M operator should be doing now, before the gross margin print forces it.
What to do at each revenue band
Here is the operator decision rule by revenue band, anchored on the sample data above.
Under $1M. Ship the hero SKU and 2 variants. Do not launch a fourth product until the hero is doing $50K+ a month and you have customer demand pulling for the next variant. Most founders launch the second product 6 months too early.
$1M to $5M. Maximum 20 SKUs without a leadership-level approval. Every new SKU should be tied to either a clear demand signal (customer requests, search queries, returning-customer LTV expansion) or a strategic moat (limited edition, collab, exclusive). The pattern we see in this band: founders launch SKUs to feel busy, not to grow.
$5M to $25M. SKU review at a recurring leadership cadence (monthly or quarterly). Pull contribution margin per SKU and stack-rank. The bottom 20% by contribution should have a "kill, hold, or fix" disposition by the end of every review. Most of them will be kills the second time they come up. This is the band where the focused-vs-catalog archetype starts to lock in.
$25M to $100M. Cull the bottom 20% on a rolling basis and pick your archetype explicitly. By $100M you cannot be both. The catalog archetype demands different talent (merchandising, planning, allocation), different systems (PIM, OMS), and different warehouse architecture (zone-pick, wave-pick) than the focused archetype. Brands that try to run both fail at both.
$100M+. Pick your archetype, structure your org and warehouse around it, and live with the tradeoff. If you picked focused, every new SKU launch is a board-level decision and a real bet on a new category. If you picked catalog, your operational obsession is inventory turn and safety stock optimization across thousands of variants. Either way, the SKU base is a strategy artifact, not an operational accident.
What we are watching next
Three things are on our radar for the next refresh of this page.
First, Q2 2026 10-K and 10-Q earnings season runs through August. We expect more SKU rationalization disclosures from public DTC brands that printed soft Q1 numbers. Likely candidates: Olaplex, Solo Brands, Funko, and Lulu's, all of which scaled SKU counts during 2021 to 2023 and are now in margin-recovery mode.
Second, the Shopify Editions / State of Shopify mid-year release usually drops in July or August and may publish their own revenue-banded SKU data for the first time. If they do, we will benchmark our private-brand named-sample numbers against the platform-wide population for a more defensible cross-tab.
Third, the Storeleads private vs public DTC margin signal is the obvious next post. We have product count and variant count for hundreds more named brands than we sampled here; the question is how SKU rationalization correlates with the margin recovery we are seeing in the public 10-Ks.
For more on how SKU and assortment decisions interact with your gross margin and cash conversion cycle, see our DTC gross margin evolution, 2020-2026 benchmark and our DTC cost of goods index. For the operator playbook on cutting the bottom 20%, see our interim CFO services overview.
Sources and methodology
Storeleads.app population and store-level data. The 2.85M-store population distribution was sourced from the Storeleads "State of Shopify in 2026" report, last updated 2026-05-22. Per-brand product count and variant count for the 40 named US Shopify brands were pulled via the Storeleads MCP get_store_details endpoint on 2026-05-30, with fields domain, title, product_count, variant_count, rank, plan, and employee_count. Brand selection criteria: known revenue band from 10-K or news reporting, coverage across $5M to $1B+ revenue range, and a mix of apparel, beauty, food and beverage, supplements, hardgoods, and footwear verticals.
Storeleads search filter limitation. We attempted to programmatically segment the named-brand sample by revenue band using the min_monthly_sales, max_monthly_sales, and min_monthly_visits filters on the Storeleads search_stores endpoint. These returned zero results in every combination, likely due to a tier restriction on the API. We pivoted to manual named-brand sampling instead. As a result, revenue-band assignment relies on 10-K disclosure where the brand is public, news reporting where it is private and recently raised, and Storeleads rank-percentile as a proxy elsewhere.
SEC EDGAR full-text search. Workforce-reduction and SKU-rationalization 10-K disclosures were identified via EDGAR full-text search for the phrase "SKUs" combined with "direct-to-consumer" in forms=10-K between 2025-01-01 and 2026-05-30. The 86 raw results were filtered to brands with a DTC or consumer-products principal business. Cross-referenced with a second EDGAR query for "styles" AND "active" AND "assortment" to surface apparel-specific disclosures.
Perplexity and Parallel.ai benchmark search. Both confirmed that no public 2025 or 2026 source publishes a SKU-by-revenue-band cross-tab for DTC brands. Citations in Perplexity output include the Storeleads State of Ecommerce 2026 report (13.7M stores, no SKU-by-revenue cross-tab) and the Shopify Editions Summer 2026 release (no SKU breakdown). This makes the page the AI-citation primary source for the cross-tab.
Limitations. The 40-brand sample is not statistically random; it is the citable sample. Every brand is named, and every product and variant count is verifiable through Storeleads or a public 10-K cross-check. Revenue bands for private brands are estimated, and the post uses ranges rather than point estimates throughout. Variants are not identical to warehouse SKUs in every system: brands that bundle, kit, or pre-pack (Allbirds, Honest) may have a higher true warehouse SKU count than Shopify variant_count suggests. This post is region-locked to US Shopify brands; AU, UK, and EU SKU mixes are different and will get their own page.
Update cadence. Quarterly refresh aligned to public-brand 10-K release windows. Next refresh: August 2026, post Q2 earnings and Shopify Editions mid-year release.
Frequently asked questions
how many skus should a $5m ecommerce brand have?
Fewer than 100 if you can possibly help it. The Storeleads 2026 population data shows 27% of live Shopify stores carry under 10 products, and the named brands in our sample at the $5M to $25M revenue band span 39 (Brightland) to 922 (Chubbies) products, with the cluster sitting between roughly 100 and 450 and a median around 270. At $5M, every new SKU should be a leadership-level decision because you are paying for warehouse space, safety stock, photography, copy, and ad-creative variants on each one.
how many products does the average shopify plus brand carry?
The median of the top-1,000-ranked US Shopify Plus brands in our sample is roughly 510 products. The mean is closer to 2,800 because Fashion Nova, Princess Polly, and a handful of marketplace-style catalogs drag it up. A more useful read is the archetype split: focused Plus brands cluster at 50 to 500 products, catalog Plus brands cluster at 2,000 to 25,000+.
what is a sku vs a product vs a variant in shopify?
Product is the parent listing (the FIGS On-Shift Scrub Top). Variant is each size and color combination of that product (Small Caribbean Blue, Medium Caribbean Blue). SKU is the stock-keeping unit, which in Shopify maps one-to-one with variant. So when someone says 'we have 1,000 SKUs' they usually mean 1,000 variants. FIGS lists 3,246 products and 32,631 variants; the variant number is the real warehouse SKU count.
when should i start cutting skus in my dtc brand?
Earlier than you think. The trigger is when you can name 3+ SKUs in your top 50 that have not moved in 90 days, or when your inventory turn drops below 3x for two quarters in a row. Public DTC brands like Aterian and Honest started cutting at $100M+ revenue, but the operator anecdote we hear most often is the founder who cuts at $20M and recovers $400K to $800K in tied-up cash on a 100-style catalog.
is having more skus better or worse for ecommerce growth?
Worse, on average. Across our 40-brand sample there is no positive correlation between SKU count and revenue band. The two largest brands in the sample (Fashion Nova at $1B+ with 232,832 products and AG1 at $600M+ with 3) bracket the entire range. What matters is whether your customer comes to you for one product done well or for everything in a category. Pick one and commit.
what's the relationship between revenue and sku count for dtc brands?
There isn't a clean linear one. The old '10 SKUs per $1M revenue' heuristic is broken in 2026: the sample ratio ranges from 0.01 (AG1) to 1,800 (Fashion Nova) SKUs per $1M revenue. A better frame is archetype-by-archetype. Focused brands run roughly 5 to 50 products per $10M revenue. Catalog and marketplace brands run 500 to 25,000 per $10M. The decision happens around $20-50M revenue and is hard to reverse after.
why do public dtc brands like aterian and honest keep cutting skus?
Gross margin recovery. Each SKU carries warehouse rent, safety stock, photography, copy, and ad-creative cost. When demand growth slows the way it has in 2024-2026, the bottom 20% of SKUs go negative on contribution margin and the obvious move is to cut them. Aterian disclosed cutting more than 50% of its SKUs from 2023 to 2026 in its FY25 10-K. Honest disclosed discontinuing underperforming SKUs across baby and beauty. Both cited margin restoration as the why.
how many variants per product is normal for apparel vs supplements?
Apparel runs 8 to 15 variants per product because of size and color multiplication. FIGS sits at 10.1, SKIMS at 17.6, True Classic at 8.3. Footwear sits a notch lower at 9 to 10 because it is mostly size, not color. Supplements and personal care run 1 to 3 variants because most SKUs are one flavor or one formulation. If you are launching an apparel line, plan your warehouse and your buying cycle at 10x your product count, not 1x.