
eCommerce
Subscription pause rate by vertical (2026): the leaky-bucket signal most DTC brands ignore
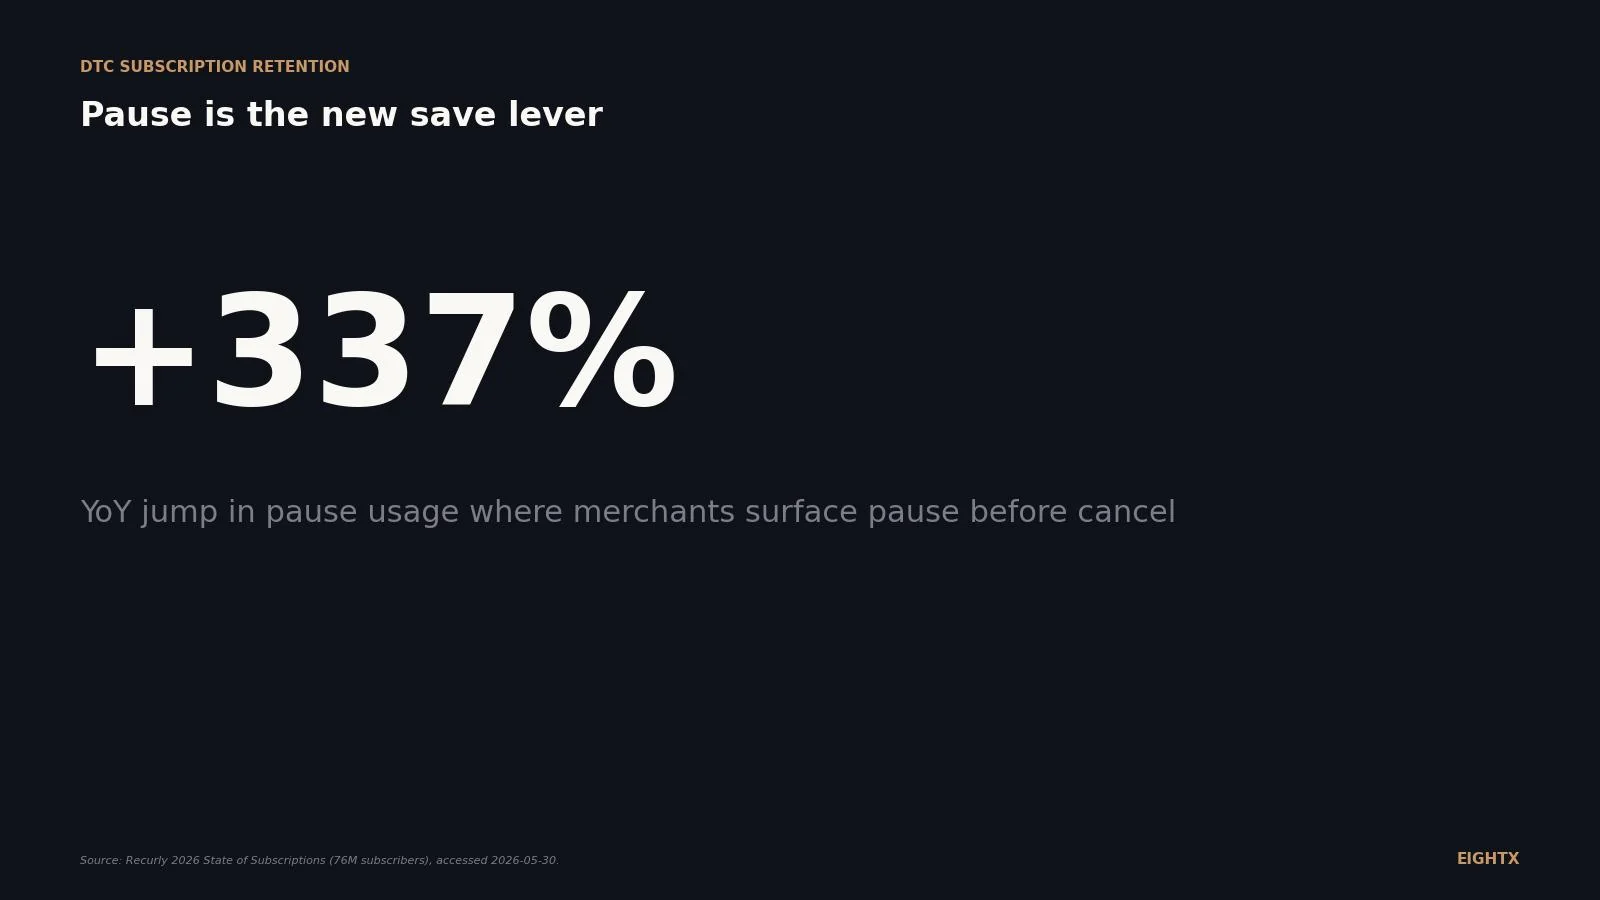
Pause usage on subscription platforms that offer pause-before-cancel is up 337% year on year (Recurly, 76M subscribers). Working monthly pause-rate benchmarks for DTC verticals range from 1 to 3% for replenishment categories to 4 to 8% for curation boxes. A pause is not a save. Brands that track pause-to-churn conversion rather than raw save rate catch the leak before it shows up in monthly recurring revenue.
Key Takeaways
- Pause usage is up 337% year-over-year across the 76M subscribers Recurly tracks, on merchants that surface pause before cancel (Recurly 2026 State of Subscriptions).
- 3 of 4 paused subscribers eventually reactivate, versus 5 to 15% of cancelled ones. The recovered cohort is 4 to 8 times more valuable than win-back.
- 27% of consumers say they would cancel outright if pause were not offered. That is your ceiling on convertible churn.
- Working monthly pause-rate ranges for 2026: food and beverage boxes 18 to 30%, coffee 15 to 25%, pet 12 to 22%, supplements 10 to 20%, beauty 8 to 15%, blended DTC 10 to 20%.
- Diagnostic rule of thumb: a healthy pause rate is roughly 1.5 to 3 times your monthly churn rate. Below 1.5x means pause is buried. Above 3x for two cohorts means your cadence is wrong.
Pause is the new save lever, and most DTC subscription brands are leaving it underexposed. Recurly's 2026 State of Subscriptions, drawn from 76 million subscribers across digital and physical programs, reports that merchants surfacing "pause before cancel" saw pause usage jump 337% year-over-year, with 3 of 4 paused subscribers eventually returning. This post is the operator's read on what those numbers mean for a $5M to $50M DTC subscription brand, what your pause rate should look like by vertical, and what to do next quarter if your ratio is off. We will also flag what we are watching for the next refresh.
The headline number: pause usage is up 337% year-over-year
Recurly's 2026 State of Subscriptions Report is the largest cross-platform pause dataset we have access to. Among merchants that surface pause as a step in the cancel flow, pause usage jumped 337% versus 2025. The same dataset says 38% of consumers would rather pause than cancel and 27% would cancel outright if pause were not offered. That 27% is the ceiling on convertible churn for any brand that has not yet wired pause into its cancel funnel.
Recharge's 2026 Industry Report (via Swell's summary, because Recharge's primary PDF is gated) reinforces the direction. 35% of subscribers made at least one order adjustment in 2026, and 39% of those adjustments were a skip rather than a swap, frequency change, or cancel. That works out to roughly 14% of active subscribers skipping at least one upcoming order in a typical period, cross-platform and cross-vertical.
The behavior shift is real and it is structural. Two vendors with different merchant bases and different reporting methodologies converge on the same story: subscribers want a pause button, they use it when they see it, and a clear majority of them come back.
Why no vendor publishes pause rate by vertical (and what we do instead)
This is where the post has to be honest. Recharge, Loop Subscriptions, Ordergroove, Smartrr, and Subbly all publish churn benchmarks by vertical. None of them publish pause-rate benchmarks by vertical for 2025 or 2026. Loop confirms in its cancellation-analytics docs that it does not publish a platform-wide deflection rate; individual brand case studies range from 3% to 36% save rates with no methodology to extrapolate from.
So we back-solve. The construction is straightforward: take the published monthly churn range for each vertical (2026 vendor churn compilations, cross-referenced with our own churn-by-category benchmarks), apply the cross-platform pause-vs-cancel ratio implied by Recharge's 35% adjustment times 39% skip stat (roughly 14% of subscribers skipping per month at the cross-vertical level), then adjust for vertical-specific consumption patterns. Consumable and clock-driven categories (coffee, household consumables, food-and-beverage boxes) run higher pause rates because over-supply triggers a skip. Novelty and curation categories (beauty, skincare) run lower because the value proposition resets each shipment.
We label these clearly as "Eightx working ranges" because they are not vendor-verified and should not appear in a board report. They are diagnostic ranges, useful for spotting whether your own pause rate is in the wrong ballpark.
Working pause-rate ranges by vertical for 2026
The table below is the operator benchmark. Read it next to your own pause rate from the last 30 days. If you sit two-thirds or more outside the range for your vertical, that is a flag.
Vertical Working monthly pause rate Monthly churn benchmark Operator note Coffee 15 to 25% 5 to 10% Over-supply and travel drive frequent skips. Mature programs see 2 to 3 times more pauses than cancels. Pet food 12 to 22% 6 to 10% Skip used when buying locally or adjusting portion sizes. High save impact when offered as a cancel alternative. Household consumables 12 to 20% 5 to 8% Bulk-buying leads to periodic over-supply. "Delay" usage often outpaces "pause." Food and beverage (boxes, snacks) 18 to 30% 12 to 18% Highest volatility. Seasonality and taste fatigue drive most skips. Brands that send "skip this month" emails see the highest rates. Supplements and vitamins 10 to 20% 5 to 8% (much lower on annual plans) Habitual use lowers pause. Spikes when subscribers stockpile or change regimen. Skincare and beauty 8 to 15% 8 to 14% Variable usage. Swaps often substitute for pauses. Lowest pause rate in the table. Blended DTC subscription 10 to 20% 6 to 10% Rule of thumb: healthy pause rate is roughly 1.5 to 3 times monthly churn.
A practical note on the vertical splits. Coffee and food-and-beverage subscriptions run highest because the buying decision resets every shipment: subscribers know within a week whether they need the next box. Supplements and skincare run lowest because the consumption clock is longer and the inventory math is less obvious to the subscriber. Pet food sits in the middle because portion size and local-store competition create the same skip pressure as coffee but at a slower cadence.
If you want a tighter benchmark for your specific category, our average subscription churn rate by category post anchors the churn side of this calculation.
How to diagnose your pause-rate-to-churn-rate ratio
The single most useful diagnostic from this dataset is the pause-to-churn ratio. Pull your last 30 days of pause events divided by active subscribers, then your last 30 days of cancels divided by active subscribers. Divide pause by churn.
Pause-to-churn ratio What it means What to do Under 1.0x Pause is buried in your cancel flow or not offered at all Surface pause as the first option in the cancel flow this week. Expect a 17 to 24% save lift. 1.0x to 1.5x Pause is offered but de-prioritized behind a save offer Move pause above the save offer. Test pause-default copy ("pause for 2 weeks" vs "cancel"). 1.5x to 3.0x Healthy zone for most verticals Hold the flow. Focus instead on pause-return cadence: when do paused subscribers come back? Over 3.0x for two consecutive cohorts Your default cadence is wrong Shift the default frequency to bimonthly or quarterly. Cadence beats save copy.
This last row matches what we see on operator calls. On a recent Eightx call with a supplements brand, the operator was running a pause rate well above 3x churn, and the diagnosis was not about save copy. It was about the monthly default. The operator note from that conversation, paraphrased and anonymized: bimonthly retention beats monthly, quarterly retention beats bimonthly, and annual rarely works at all. If your pause rate keeps climbing as you optimize the cancel flow, your cadence default is the lever, not your copy.
What to do this quarter if your pause rate is off
Three moves, ordered by impact.
Surface pause first in the cancel flow. Recurly's 27% "would cancel if no pause" ceiling and Ordergroove's 17 to 24% save range are the upside band. If pause is currently behind a save offer or a customer-service step, move it to the first screen. This is a one-week change and the highest-impact item on the list.
Switch from "pause" to "delay 2 weeks" defaults where the vertical supports it. For coffee, household consumables, and pet food, the subscriber decision is rarely "pause indefinitely" but rather "delay this shipment." A "delay" default with clear next-charge date converts higher than an open-ended pause and brings subscribers back automatically. Test it on a single cohort first.
Trigger pre-charge emails with 1-click skip. Recharge's 35% adjustment rate and 39% skip share imply that subscribers who get a clear, friction-free pre-charge nudge will manage their own subscription, and that engagement correlates with lower involuntary churn. The skip button is not the cancel risk you might think; it is the early-warning signal.
Pause is not a deferred cancel. It is the highest-impact save mechanic on the page, and the recovered cohort is 4 to 8 times more valuable than the cancel-and-win-back cohort.
What we are watching next
This is a Group A "living index" post and we will refresh it quarterly when new vendor data lands. The next data drops to watch:
- Recharge mid-year 2026 State of Subscription Commerce update, typically published in late July or August. We expect tighter vertical splits on the 35% adjustment rate.
- Recurly 2027 State of Subscriptions preview, typically late October or November. The 337% YoY pause-usage stat is the one we will be watching for confirmation as merchants who turned pause on in 2025 cycle through a full year of data.
- Loop Subscriptions deflection-rate publication, if Loop ever releases a platform-wide benchmark. Currently only individual case studies.
- Our own Eightx-aggregated pause rates, once we hit the 5-brand minimum per vertical for anonymization. Target: Q3 2026 refresh.
If you want the cross-check on the churn side of this, see our average subscription churn rate by category breakdown and the average ecommerce repeat purchase rate by vertical post for the wider retention picture.
Sources and methodology
Recurly 2026 State of Subscriptions Report. Cross-platform dataset of 76 million subscribers covering digital and physical subscriptions. Headline pause stats pulled from Recurly's report landing page and partner summaries (Klaviyo, Sticky.io via Swell). Primary URL: https://recurly.com/content/state-of-subscriptions-report/. Caveat: the dataset is not DTC-ecommerce-only, so the 38% pause-preference and 337% YoY pause-usage figures should be applied as directional ceilings, not floors, for a typical DTC subscription brand.
Recharge 2026 Industry Report. Vendor benchmark dataset pulled via Swell's third-party summary because Recharge's primary report PDF is gated behind an email-capture form. Stats used: 35% of subscribers made an order adjustment in 2026 and 39% of those adjustments were a skip. Summary URL: https://www.swell.is/content/subscription-commerce-statistics. Recharge's primary blog: https://getrecharge.com/blog/state-of-subscription-commerce/. Limitation: Recharge does not publish pause rate broken out by vertical in any year through 2026, confirmed via direct vendor-page review and Perplexity search.
Ordergroove "From cancel to keep." Cancel Flows save rate of 17 to 24% (early adopters). Used as the cleanest single vendor save-rate number because Ordergroove states it as a save rate, not a relative churn reduction, which makes it directly comparable across programs. URL: https://www.ordergroove.com/blog/from-cancel-to-keep-best-practices-that-retain-subscribers/.
Compiled 2026 ecommerce churn benchmarks. Published March 2026. Provides monthly churn ranges by vertical (Health and Wellness 8 to 12%, Beauty and Personal Care 8 to 14%, Food and Beverage 12 to 18%, General Subscription Boxes 10 to 15%, blended DTC 6 to 10%), plus the "subscriptions offering skip, pause, swap, and frequency adjustments churn 15 to 30% less" stat and the 40 to 60% pause-return versus 5 to 15% cancel-return rate. URL: https://finsi.ai/blog/ecommerce-churn-rate-benchmarks-2026/. Caveat: described as aggregate industry data without a stated sample size.
Methodology for "working pause-rate ranges by vertical." No vendor publishes this. We construct it as: (a) take the published monthly churn range for each vertical from 2026 vendor churn compilations plus our own churn-by-category benchmarks, (b) apply the cross-platform pause-vs-cancel ratio implied by Recharge's 35% adjustment times 39% skip stat, (c) adjust for vertical-specific consumption patterns (consumable plus clock-driven categories run higher pause rates; novelty plus curation categories run lower). Label clearly in the post as "Eightx working ranges, not vendor-verified."
Limitations. No vendor publishes pause rate by vertical for 2025 to 2026 (confirmed across Recharge, Loop, Ordergroove, Smartrr, Subbly). Recurly's 337% YoY pause-usage stat is cross-platform (digital plus physical), not DTC-only. Recharge's 35% and 39% adjustment-and-skip numbers are aggregated, not vertical-segmented. Working ranges are directional, not statistical: operators should treat them as sanity checks, not benchmarks for board reporting.
Update cadence. This is a Group A living-index post. Next refresh target: August 2026, after Recharge's mid-year SoSC update typically lands. We will re-baseline the working pause-rate ranges if vendor data improves.
Frequently asked questions
what's the average subscription pause rate for a dtc brand in 2026?
There is no public vendor-published average. Our working blended DTC range for 2026 is 10 to 20% of active subscribers pausing in any given month, back-solved from the Recurly pause-vs-cancel ratios and compiled monthly churn benchmarks. Coffee and food-and-beverage boxes run higher (15 to 30%). Beauty and supplements run lower (8 to 20%).
is pause rate or churn rate the better leaky-bucket signal for my subscription brand?
Both, but pause rate moves first. A pause-rate spike with stable churn means subscribers are voting with the skip button before they hit cancel. That gives you 30 to 60 days to fix the underlying problem (cadence, price, value perception) before the cancellation cohort lands. Watch both, but treat pause as the leading indicator.
why is my pause rate so low if my churn rate is so high, what does that mean?
Pause is buried in your cancel flow. If churn runs 8% monthly and pause runs under 5%, subscribers are not being offered pause as an alternative. Recurly's data says 27% of cancellers would have paused if asked. Fix the flow before you fix anything else.
is a 20% monthly pause rate good or bad for a $10m dtc subscription brand?
Depends on your vertical and your churn rate. For coffee or food-and-beverage boxes, 20% pause with 5 to 10% churn is healthy (pause is roughly 2 to 4 times churn). For supplements or beauty, 20% is high and signals your cadence default is wrong: subscribers want a longer interval but are using pause as the workaround.
do paused subscribers actually come back or is it a deferred cancel?
They come back. Recurly's 2026 dataset (76M subscribers) shows 3 of 4 paused subscribers eventually reactivate. Compiled benchmarks put the return rate at 40 to 60%, versus 5 to 15% for cancelled subscribers. Pause is a high-retention rescue path, not a stalling tactic.
should i offer pause as the default option in my cancel flow or hide it behind a save offer?
Offer it first. Recurly's data shows 38% of consumers would rather pause than cancel and 27% would cancel outright if pause were not surfaced. Hiding pause behind a save offer (discount, free gift) costs you that 27% in convertible churn. Lead with pause, fall back to save offers if pause is declined.
how much can i reduce churn by surfacing pause more aggressively in my cancel flow?
Ordergroove's Cancel Flows save 17 to 24% of cancel attempts in early-adopter data. Recharge reports 44% churn reduction with cancellation-prevention flows on; Stay AI claims 28%. Use Ordergroove's 17 to 24% as the credible planning number: it is stated as a save rate, not a relative churn reduction, and it triangulates with Recurly's 27% pause-or-cancel ceiling.
why don't recharge or loop publish pause rate benchmarks by vertical?
Two reasons. First, pause rate is a recent enough metric that vendor reporting still anchors on churn. Second, vertical splits dilute the headline number vendors want to lead with (overall save lift). Both Recharge and Loop share vertical pause data privately under NDA, which is why this post back-solves the ranges from published churn benchmarks instead.