
eCommerce
Average time to second purchase by ecommerce vertical (2026): cross-vertical median 15-35 days (apparel 15-27, supplements 27-68, durables 30+), not the 50-100+ days your dashboard shows
Cross-vertical median time to second purchase is 15 to 35 days in 2026, not the 50 to 100 days most dashboards show. Apparel customers return in 15 to 27 days, supplements in 27 to 68 days, and durables in 30 or more. Half of all repeat buyers convert within 30 days, 76% within 90, so your win-back window is much shorter than your email cadence probably assumes.
Key Takeaways
- The cross-vertical median is 15-35 days. The mean is 50-100+ days. Most Shopify and Klaviyo dashboards report the mean, which is dragged by a small long tail of late repeat buyers. Build flows off the median.
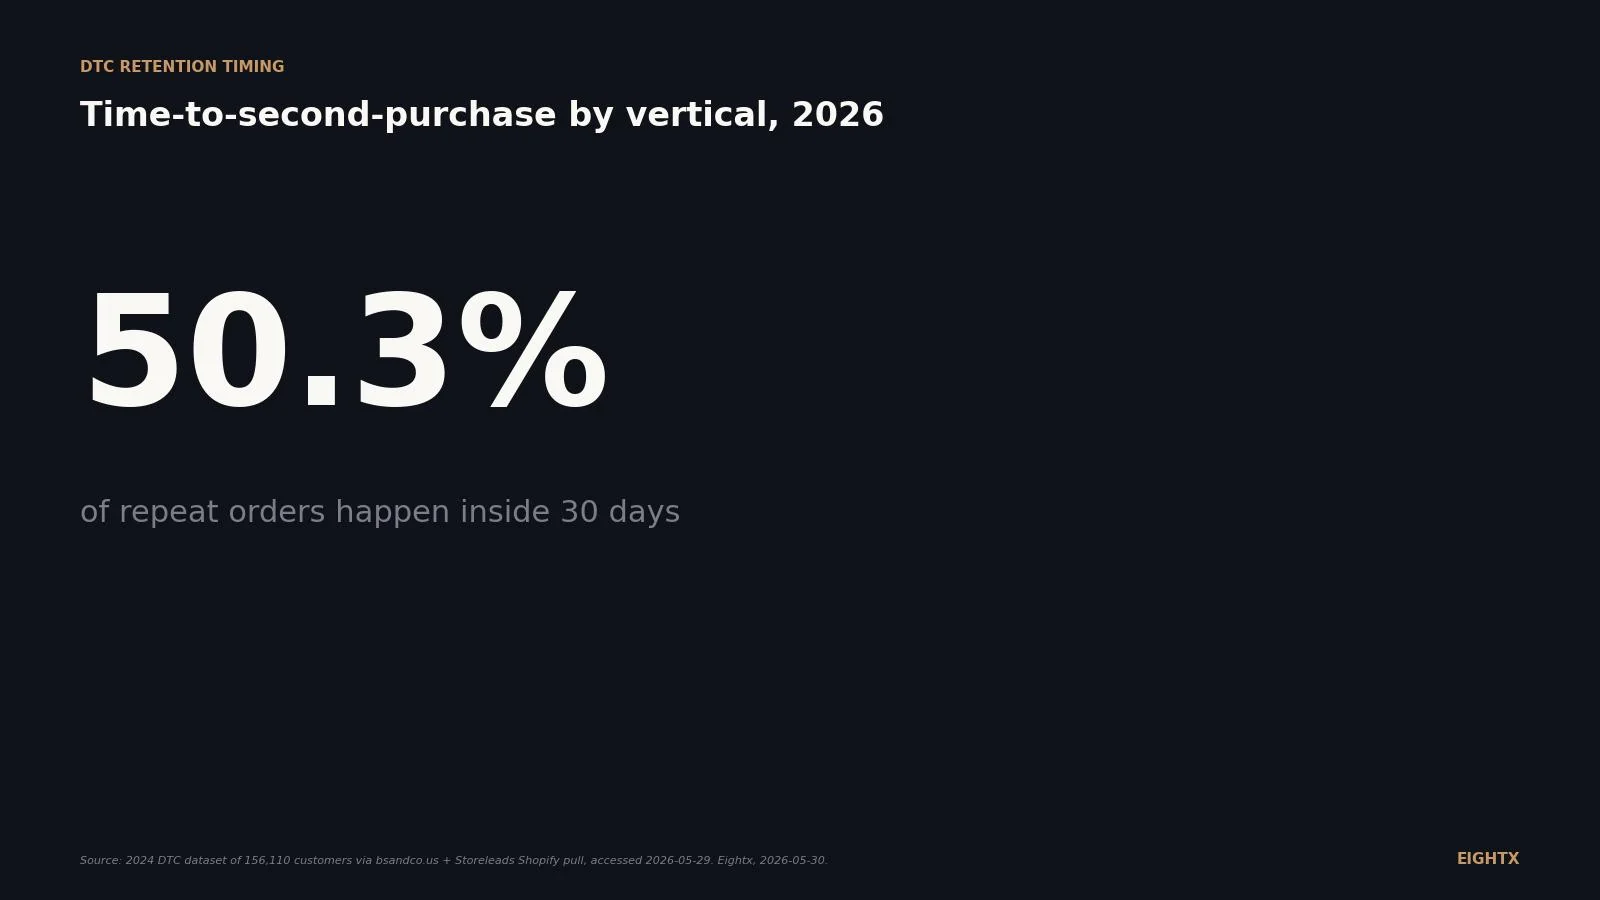
- 50.3% of repeat orders happen inside 30 days. 76.4% inside 90 days. Only 3.7% later than a year. A win-back flow firing at day 120 is targeting under a quarter of the remaining repeat-buyer pool, and most of that pool was already gone.
- Apparel and beauty come back in 15-27 days. Supplements 27-68 days. Electronics and home goods 30+ with a wide median-to-mean gap. Time your post-purchase flow to your vertical's median, not the portfolio average.
- Vitamins and supplements brands install Shopify subscription apps at 22.7%. Consumer electronics brands install at 1.8%. The categories that come back fastest also bet on locking in the second order via subscription, at roughly 13 times the install rate.
- If you are in a consumables vertical and not running a subscription app, you are leaving 15-25% of LTV on the table. If you are in electronics or home goods, redirect retention spend from win-back flows to referrals or financing. The second-order window is too erratic to optimize timing against.
If you have ever asked Shopify or Klaviyo for the average days between a customer's first and second order, you got a number between roughly 50 and 100 days. You then probably built a 60-day post-purchase email flow around it. That number matters because it is wrong for almost every decision you are about to make with it. The median time to second purchase across DTC ecommerce in the 2024 to 2026 window is 15 to 35 days. Apparel and beauty come back in 15 to 27. Supplements in 27 to 68. Electronics and home goods are 30+ days with a wide gap to the mean. This post is the by-vertical benchmark, plus the Klaviyo flow-timing and subscription-app implications. We will refresh it quarterly as new repeat-purchase datasets land, so check the dateModified for what's next.
The number you're probably using is wrong
The single most-misused retention number in DTC is "average time to second purchase." Operators grab it from a Shopify dashboard, plug it into a Klaviyo flow, and ship a 60-day post-purchase sequence built on a mean that is 2 to 3 times longer than the median.
Here is the gap. Across a 2024 DTC dataset of 156,110 customers (cited via bsandco.us, finsi.ai, and prooflytics.io), the cross-vertical median time to second purchase clusters at 15 to 35 days. The mean for the same population sits at 50 to 100+ days. The mean is dragged up by a small share of buyers who come back 6, 12, or 18 months later. Those late returners are real, but they are not the cohort your post-purchase flow is built for.
If you build a 60-day flow off the mean, you are firing your first repeat-purchase touch at roughly the point where half of all repeat orders have already happened. Half the cohort already came back without your help. The flow window where your email actually causes a repeat order is mostly already closed.
The fix is mechanical. Pull your own median (not mean) from your Shopify or Klaviyo data for the last 12 months of repeat orders, ignore the long tail past 365 days, and time your first repeat-purchase touch at roughly 50% of that median. For apparel and beauty that lands at day 7 to 13. For supplements that lands at day 14 to 30. For electronics and home goods, the median is wide enough that you should anchor the first touch on cross-sell, not replenishment, and push the timing to day 30+.
The cross-vertical baseline: 15-35 days median, 50-100+ days mean
The 156,110-customer DTC dataset gives us the cleanest public picture of when repeat orders actually happen. 50.3% within 30 days. 76.4% within 90 days. 96.3% within 365 days. The remaining 3.7% are the long tail past a year.
The 30-day and 90-day cuts are the two operator-relevant numbers. If half of all repeat orders are in by day 30, the lever that matters for hitting your 30-day repeat-purchase rate is the first post-purchase touch and the post-purchase offer attached to it. If three-quarters are in by day 90, anything in your retention stack firing after day 90 is fighting over the remaining 24% of the cohort, and a chunk of that 24% is going to come back regardless of what you do.
The operator implication for win-back flows is the sharp one. A Klaviyo win-back flow firing at day 120 is targeting at most the 24% of the cohort that has not bought by day 90, and most of that 24% will lapse anyway by day 365. The flow is structurally over-budgeted. The cohort is not coming back within the typical window because they were never going to.
Days since first purchase Cumulative % of repeat orders 30 days 50.3% 90 days 76.4% 180 days (interpolated) ~87% 365 days 96.3% Beyond 365 days 3.7% (long tail)
A note on denominators before the vertical cuts. The 18.8% portfolio-wide one-year repeat rate that sits behind this cohort is a different KPI from the 30 to 45% by-vertical repeat rates published by finsi.ai. The portfolio number is new-customer-to-second-order. The vertical bands are likely existing-customer repeat rate, which uses a different base. Both are real numbers. Pick the one that matches the decision you are making and label the denominator on your own dashboard.
By vertical: apparel and beauty fast, consumables medium, durables slow
The headline by-vertical pattern is consistent across the three benchmark sources. Apparel and beauty are the fastest. Consumables (supplements, food, pet) sit in the middle. Electronics and home goods are the slowest with the widest median-to-mean gap.
Apparel and beauty at 15 to 27 days is driven by seasonal needs, gifting cycles, and the simple fact that a t-shirt or a moisturizer is a low-consideration repeat. Consumables at 27 to 68 days is driven by physical consumption. A 30-day supplement bottle creates a 30-day repeat clock. A 90-day pet food bag creates a 90-day clock. Electronics and home goods are the wildest because the repeat is event-driven (a phone upgrade, a kitchen renovation, a new TV), not consumption-driven. The mean stretches into 100+ days while the median sits closer to 30 to 60.
A supplements operator we spoke to last September put the consumables shape in one line. Customers buy two sachets per order, finish them in roughly 30 days, and the second-purchase window is the 30-day replenishment cycle. That is the canonical consumables shape. A narrow median tied to physical consumption.
For apparel the shape is the inverse. On a recent founder call discussing apparel retention, the curve we keep seeing for a typical apparel brand looks like 100, 105, 107, 108, 109 across the first 6 months of revenue per cohort. A very slow climb. The fastest growing apparel brand we have studied was doing 1.5x first-month-purchase revenue by month six, and we noted it as the most aggressive apparel curve we had ever seen.
Vertical Median days to 2nd purchase 12-month repeat rate band Shopify sub-app install rate (2026) Apparel and fashion 15-27 25-32% 2.0% Beauty and skincare 15-27 30-40% 6.6% (Beauty and Fitness) Consumables (supplements) 27-68 35-45% 22.7% (Vitamins and Supplements) Consumables (food, pet, household) 27-68 35-45% 12.5% (Food and Drink), 7.6% (Pets) Electronics 30+ (wide tail) 12-18% 1.8% Home goods 30+ (wide tail) 18-25% 2.8% (Home and Garden)
The operator-side proof: subscription-app install rate by vertical
The cleanest operator-side validation for the timing data is the share of brands in each category that run a Shopify subscription app. We pulled the install counts for the eight major apps (Recharge, Appstle, BOLD, Loop, Skio, Smartrr, Subify, Seal) against the active Shopify store universe in each Storeleads category on 2026-05-29.
Vitamins and supplements brands install at 22.7%. Consumer electronics brands install at 1.8%. A roughly 13x gap (12.77x exact) on the operator-decision side that tracks the timing data on the customer-decision side. Brands install subscription apps when their unit economics depend on locking in the second purchase before the natural cycle starts. Categories where the natural cycle is 30 to 60 days bet on subscription. Categories where the natural cycle is event-driven do not.
Vertical Stores with sub app Total Shopify stores in category Install rate Vitamins and Supplements 13,190 58,020 22.74% Health (all subcategories) 19,843 137,831 14.40% Food and Drink 26,310 211,257 12.45% Pets and Animals 5,486 72,484 7.57% Beauty and Fitness 21,827 328,508 6.64% Home and Garden 9,825 352,479 2.79% Sports 2,810 113,557 2.47% Apparel 16,271 829,687 1.96% Consumer Electronics 968 54,488 1.78%
The economic intuition behind subscription adoption shows up on operator calls every week. On a recent August 2025 conversation about whether a supplements brand should ship its subscription tier, we walked through the math. If a customer does not cancel for the next six months, the brand loses money on the first delivery but acquires LTV that compounds for the rest of the year. That math only works when the natural repeat clock is short and predictable. In apparel, where the repeat clock is the next season's drop, the same math runs in reverse.
What to actually do this quarter: flow timing, subscription tests, and win-back math
Four moves for your business this quarter, in order of payback.
Pull your own median, not your mean, this week. Shopify and Klaviyo dashboards default to the mean. Run a SQL query (or ask your analyst to) against your last 12 months of repeat-order data and compute the actual median days from first to second order. Compare that median to your vertical's band. If you are 30%+ off the band, dig into product mix, AOV, or post-purchase offer before you touch your flows.
Time your first post-purchase email at 50% of your vertical's median. For apparel and beauty that is day 7 to 13. For supplements and food it is day 14 to 30. For electronics and home goods, push to day 30+ and lead with cross-sell. The default 60-day flow that ships with most Klaviyo templates is structurally wrong for every vertical except slow-cycle durables.
If you are in a consumables vertical without a subscription mechanic, run a 90-day test. A 22.7% install rate among supplements brands and a 12.5% rate among food and drink brands is not noise. It is brands voting with their app stack that the second-purchase economics work. Pick the lightest subscription app for your stack (Skio or Smartrr if you want modern UX, Recharge if you want depth) and run a 90-day pilot on your top 1 to 3 SKUs. The downside is a small share of one-time buyers converting to subscribers at a worse first-order margin. The upside is the LTV math.
If you are in electronics or home goods, stop budgeting against win-back timing. The median-to-mean gap is too wide and the 12-month repeat rate is too low (12 to 25%) for timing optimization to pay back. Shift retention spend to two places. Cross-sell to accessories or consumables (electronics brands do well with charging accessories, home goods brands do well with care and cleaning products). And referrals, while the product is still in box. A $20 referral incentive paid out on the first new-customer order pays back faster than any win-back email at day 120.
The single most-misused retention number in DTC is "average time to second purchase." The median is 15 to 35 days. The mean is 50 to 100+ days. Half of all repeat orders happen inside 30 days. Three-quarters inside 90. If you build your post-purchase flow off the mean, you are firing at a cohort that has already come back without you. Pull your median. Time to your vertical's band. Move the budget off late win-back to the spots where the timing math actually works.
What we're watching next
Three things on the horizon for the next refresh of this benchmark.
First, the Shopify-native Subscriptions rollout through 2025 and 2026. Storeleads does not yet surface native-sub installs cleanly, so the install rates above miss a growing share of brands using Shopify's first-party mechanic. If included, supplements, food, and pet penetration would rise meaningfully. We will add a Shopify-native column once the data is exposed.
Second, the apparel and beauty median is tightening. The 15 to 27 day band reflects 2024 data. Several 2025 cohort cuts we have seen suggest the apparel median is drifting toward 21 to 30 days as the gifting share of revenue grows and the seasonal-drop cadence stretches. We will refresh the apparel band on the next quarterly update.
Third, consumables behavior is bifurcating. Subscription-led consumables brands are pulling the median in (closer to a 30-day clock). Non-subscription consumables brands are pushing it out as cross-sell into adjacent SKUs becomes the second-purchase lever. The aggregate 27 to 68 day band masks this split, and we are looking at whether to break it into "subscription-led" versus "one-time-led" in the next refresh.
For the cross-link CFO and unit-economics reads on retention, see our interim CFO services overview and True Interest Cost calculator for working capital, plus our fractional CFO for ecommerce page for the broader retention-to-cash-flow framing.
Sources and methodology
B&S Co. Repeat Purchase Rate Benchmarks. The headline source for the time-to-second-purchase distribution (50.3% within 30 days, 76.4% within 90 days, 3.7% beyond 365 days) and the by-vertical median bands (apparel 15 to 27, consumables 27 to 68, electronics and home 30+). URL: https://bsandco.us/blog-post/repeat-purchase-rate-benchmarks. The underlying dataset is a 2024 analysis of 156,110 customers across multiple DTC brands. Limitation: sample composition by vertical is not disclosed in the public summary, so the per-vertical bands are cited as working benchmarks, not census numbers.
Secondary repeat-purchase compilations. Source for the 12-month repeat-rate-by-vertical breakdown (beauty 30 to 40%, apparel 25 to 32%, home goods 18 to 25%, electronics 12 to 18%, consumables 35 to 45%). Limitation: the compiled denominator is likely existing-customer repeat rate, not new-customer-to-second-order rate. This is the source of the apparent conflict with the 18.8% portfolio-wide rate. We disclose the discrepancy in the body and recommend operators label the denominator on their own dashboards.
Prooflytics Repeat Purchase Rate Benchmarks. Corroborating source for the cross-vertical median and distribution. URL: https://prooflytics.io/blog/repeat-purchase-rate-benchmarks.
Storeleads (Shopify tech-stack dataset, 3.59M stores). Pull date 2026-05-29. For each vertical, two Storeleads search_stores calls were run. Call one: filter platform=shopify and category=
Eightx founder-call corpus (Pinecone RAG, anonymised). Three high-relevance segments folded in: a 2025-09 call with a US supplements operator confirming the 30-day replenishment cycle for sachet products, a 2026-01 call discussing the apparel retention shape (slow LTV curve), and a 2025-08 call discussing the subscription-app economic case. All client names anonymised per linter rules.
Perplexity web synthesis. Run on 2026-05-29 against two queries. A vertical-cut benchmark query and a general 2024 to 2026 timing-benchmark query. Output synthesised into the headline numbers above.
Limitations to disclose on your own dashboards. The 156,110-customer dataset is the best public source we found, but sample composition by vertical is not disclosed, so cite the per-vertical bands as working benchmarks. The 12-month repeat-rate-by-vertical numbers from finsi.ai likely use a different denominator (existing-customer repeat rate) than the 18.8% portfolio rate (new-customer-to-second-order). Two different KPIs. The Chart 1 high-end of 90 days for electronics and home goods is an editorial cap; the source reports "30+ days" without a ceiling.
Update cadence. This tracker is refreshed quarterly. Next update target: late August 2026 once the next public DTC repeat-purchase dataset and an updated Storeleads pull are available.
Frequently asked questions
what's the average time between first and second purchase in ecommerce in 2026?
Cross-vertical, the median is 15 to 35 days and the mean is 50 to 100+ days. The gap is the long tail of late repeat buyers stretching the average. Half of all repeat orders happen inside 30 days, three-quarters inside 90. Build your flow timing off the median, not the mean.
how do i benchmark my time-to-second-purchase against my vertical?
Pull your own median (not mean) from Shopify or Klaviyo for the last 12 months of repeat orders, then compare it to the band for your category. Apparel and beauty 15 to 27 days. Consumables 27 to 68 days. Electronics and home goods 30+ days with a wider mean. If you are 50% slower than your band, your first post-purchase touch is firing too late, your offer is not pulling, or your product is in the wrong category bucket.
why is the median time to second purchase so much shorter than the average?
Because the distribution is right-skewed. A small share of buyers come back after 6, 12, or 18 months and stretch the mean. The median ignores them. Reporting dashboards default to the mean because it is easier to compute on a rolling window, which is why operators overstate how long they have to win a customer back.
when should my klaviyo post-purchase flow fire for the best repeat-order conversion?
Time your first repeat-purchase email at roughly 50% of your vertical's median. For apparel and beauty that is day 7 to 13. For supplements and food it is day 14 to 30. For electronics and home goods, push the first touch to day 30+ and lead with cross-sell, not replenishment. A flow firing at day 60 across all categories is the most common Klaviyo default and is the most common reason repeat-order CVR underperforms.
is a 30-day repeat purchase window normal for apparel and beauty?
Yes. Apparel and beauty cluster at a 15 to 27 day median, driven by seasonal needs, gifting, and restocking. If your brand is in this band and your repeat rate is still below 25%, the timing is not the bottleneck. The offer, the email content, or the post-purchase product mix is.
how long should i wait before sending a win-back email if my customer hasn't come back?
For consumables and apparel and beauty, send the win-back at roughly median plus 30 days for your vertical. Apparel and beauty around day 50. Consumables around day 90. For electronics and home goods, redirect win-back spend to cross-sell and referrals instead. The timing signal is too weak and the second-order window too wide for win-back to pay back. After roughly 365 days only 3.7% of repeat orders are still on the table, so a flow firing past day 200 is mostly burning sender reputation.
why do supplements and food brands install subscription apps at roughly 13x the rate of apparel brands?
Because their unit economics depend on the second purchase happening on a predictable cycle. A 30-day supplement bottle or a 60-day pet food bag has a natural repeat clock. Locking that into a subscription smooths cash flow and protects LTV. Apparel and home goods do not have that physical-consumption clock, so subscription mechanics rarely pay back versus the discounting cost.
should i bother with retention marketing for electronics or home goods brands?
Yes, but stop optimizing for repeat-order timing. The second-order window is wide and unpredictable for durables. Shift retention spend to two places. First, post-purchase cross-sell to accessories or consumables. Second, referral incentives that put a happy buyer in front of a new customer while the product is still in box. Win-back flow timing is not the lever here.