
eCommerce
Beauty Brand Financial Benchmarks 2026
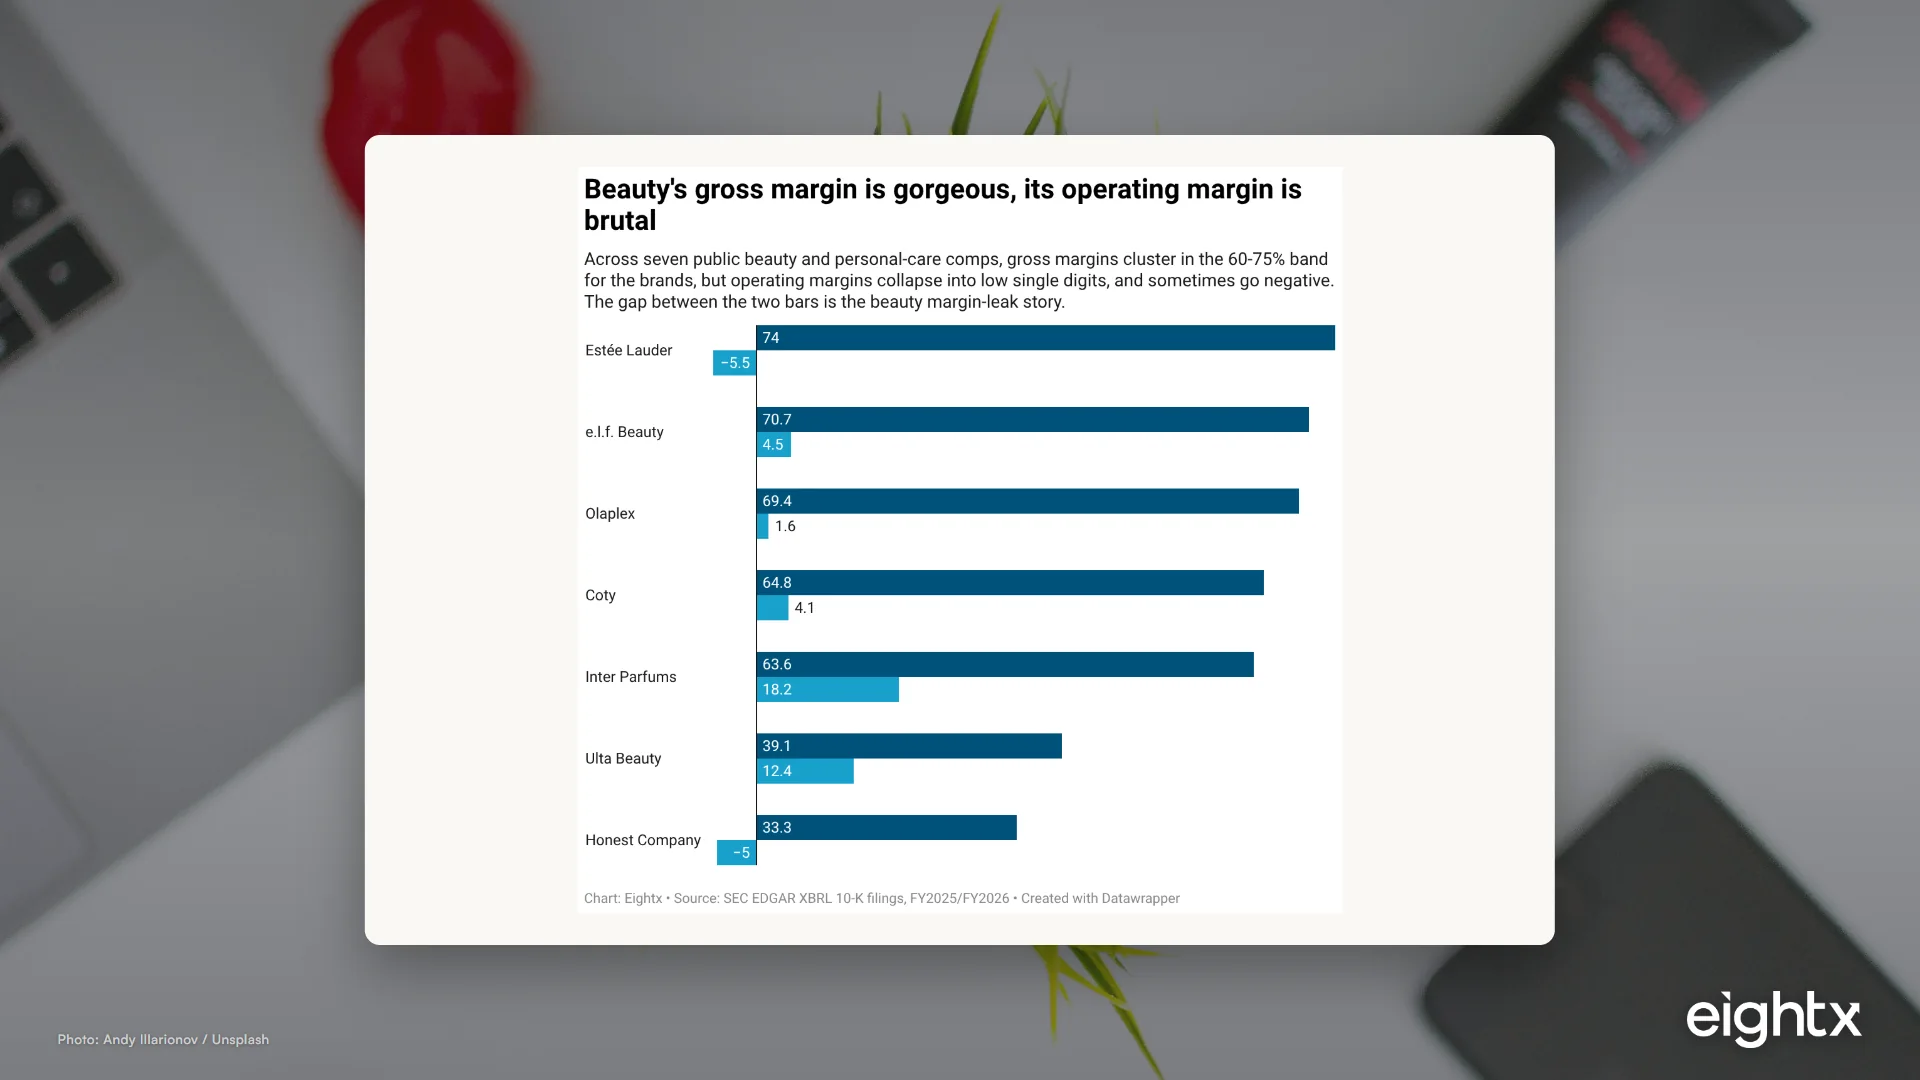
Across 7 public beauty comps in 2026, brand gross margins cluster at 64 to 74% but the median operating margin is just 4.1%. Beauty has the highest gross margin in consumer and one of the worst conversions to profit, because CAC of $40 to $100, slow inventory and SG&A drain the margin before it reaches the operating line.
Key Takeaways
- Beauty brand gross margins cluster at 64 to 74% across the public comps (e.l.f. 70.7%, Estée Lauder 74.0%, Olaplex 69.4%, Coty 64.8%, Inter Parfums 63.6%), the highest of any consumer category. The brand-only median is about 69%.
- Median operating margin across all 7 comps is just 4.1%. Beauty gives back the vast majority of its gross margin between the gross and operating line, and two of seven (Estée Lauder, Honest) ran operating losses in their latest fiscal year.
- DTC beauty CAC now runs $40 to $100+ per new customer and is rising 8 to 16% a year, against a roughly $66 AOV. With CAC often at or above AOV, first-order profit is frequently negative and the model lives on repeat rate.
- Public beauty inventory turns cluster at 1.5 to 2.9x per year, well below the 4 to 9x healthy target. Slow turns are the hidden working-capital cost of the category.
- Returns are where beauty wins: about 4 to 10% of orders versus apparel's 20 to 40%. The leak in beauty is CAC and inventory, not returns. Target LTV:CAC at or above 3:1 in margin dollars.
Beauty looks like the best business in consumer right up until you read past the gross-margin line. Public 10-K data from 7 beauty and personal-care comps, each company's most recent annual filing, puts brand gross margins in the 64 to 74% band, the highest of any consumer category. The same filings put the median operating margin across all seven at just 4.1%. That gap is the whole story. Beauty routinely keeps 70 cents of gross margin on the dollar and ends up with a nickel of operating profit, because customer acquisition, SG&A and slow-moving inventory drain it before it reaches the operating line. This report consolidates the margin, CAC, LTV, AOV, returns and inventory numbers a beauty operator at $5M to $50M actually needs, anchored on real public-company filings and cross-checked against 2026 DTC benchmark data.
What "healthy" actually means in beauty (the 70% / 4% line)
Start with the two numbers that define the category. Across the brand comps, gross margin runs e.l.f. 70.7%, Estée Lauder 74.0%, Olaplex 69.4%, Coty 64.8% and Inter Parfums 63.6%, with a brand-only median near 69%. The simple median across all seven comps is 64.8%, dragged down by retailer Ulta at 39.1% and value and CPG-leaning Honest at 33.3%. Operating margin tells a very different story: a median of 4.1%, a mean of 4.3%, and two outright operating losses (Estée Lauder at -5.5% after impairments and restructuring, Honest at -5.0%) in the latest fiscal year. The brand at the top of the operating table is Inter Parfums at 18.2%, and it gets there on a 63.6% gross margin that is the lowest of the brand set. That is the tell. Elite beauty profitability does not come from a fatter COGS markup. It comes from discipline on every line below the gross-margin line.
When I talk to founders running a brand this size, the first benchmark they quote me is always the gross margin, and in beauty it is almost always the wrong one to lead with. A brand sitting at 72% gross margin can still make no money if CAC is running above AOV and inventory is turning twice a year. The public comps prove the point at scale: even at hundreds of millions in revenue, beauty converts a 70% gross margin into low-single-digit operating profit far more often than not. Stop celebrating the 70% line. It is table stakes in this category.
| Company | Ticker | Revenue ($M) | Gross margin % | Operating margin % | Inventory turns (x/yr) | Fiscal year end |
|---|---|---|---|---|---|---|
| Estée Lauder | EL | 14,326.0 | 74.0 | -5.5 | 1.71 | 2025-06-30 |
| Ulta Beauty | ULTA | 12,392.8 | 39.1 | 12.4 | n/a | 2026-01-31 |
| Coty | COTY | 5,892.9 | 64.8 | 4.1 | 2.71 | 2025-06-30 |
| e.l.f. Beauty | ELF | 1,636.5 | 70.7 | 4.5 | 2.18 | 2026-03-31 |
| Inter Parfums | IPAR | 1,488.5 | 63.6 | 18.2 | 1.46 | 2025-12-31 |
| Olaplex | OLPX | 423.0 | 69.4 | 1.6 | 1.72 | 2025-12-31 |
| Honest Company | HNST | 371.3 | 33.3 | -5.0 | 2.90 | 2025-12-31 |
| Median (7) | 64.8 | 4.1 | 1.95 |
Where the margin goes: CAC, SG&A and the operating line
Walk the P&L down from gross margin and the leaks appear in order. The biggest is customer acquisition. DTC beauty CAC now runs $40 to $100+ per new customer and is climbing. Polar Analytics' beauty and personal care cut shows a $37.88 median CAC against a $66 median AOV, but broader 2026 panels run higher: First Page Sage at $61, and Mintel-cited health and beauty at $148 (up 16.5% year over year), with clinical skincare near $380. With CAC frequently at or above the roughly $66 AOV, first-order profit is often negative, and the whole model depends on the second and third order.
The second leak is everything else below the gross line. Marketing typically eats 20 to 30% of revenue in pure DTC beauty, and SG&A absorbs the rest. Olaplex is the cleanest worked example in the comp set: a 69.4% gross margin that converted to a 1.6% operating margin, as operating income collapsed from $66.9M to $7.0M year over year while it rebuilt brand and marketing spend. A beautiful gross margin produced almost no operating profit. Stack acquisition and SG&A together and you have explained most of the gap between the 70% gross line and the 4% operating line.
The pattern we see again and again is operators who fix the wrong leak first. They chase another point of COGS savings from a contract manufacturer while CAC quietly runs above AOV. When we have struggled to move a beauty brand's operating margin, the lever was almost never the cost of goods. It was getting CAC payback inside the first two orders and pulling the repeat rate up, because at a 70% gross margin the contribution on a retained customer is enormous and the contribution on a one-and-done customer is often negative.
The inventory problem nobody benchmarks
Inventory is the leak operators measure least and pay for most. A healthy fast-moving-beauty target is roughly 4 to 9 turns per year, though that band is a general fast-moving-consumables rule of thumb rather than a beauty-specific published benchmark. Public beauty comps mostly miss it badly: Inter Parfums turns 1.5x, Estée Lauder 1.7x, Olaplex 1.7x, e.l.f. 2.2x, Coty 2.7x and Honest 2.9x, a median near 1.95x. Every public beauty brand in the set sits below the working-capital benchmark. Finished goods, components and packaging, plus long formulation and fill lead times, tie up cash in stock instead of funding acquisition or paying down a line.
The reason this matters more than it reads: every turn you lose is roughly a quarter of a year of inventory you are financing. When I talk to founders this size, the ones in working-capital trouble are almost always running below 2 turns and carrying more than 150 days of stock, often with a long tail of slow shades and discontinued SKUs they will not write off. They feel the squeeze as a financing problem, when the root cause is assortment and demand forecasting. Fixing turns is unglamorous and it is one of the highest-return moves on the board, especially in a category where the gross margin makes the trapped cash so expensive.
CAC, LTV and the 3:1 line
Unit economics are where the category either works or quietly does not. The 2026 beauty benchmark looks roughly like this: AOV of $55 to $70 with a $66 median, blended CAC of $40 to $100, a 12-month repeat rate around 20 to 30% (30 to 45% for consumable refill products), and an implied 12-month LTV near $185 at the median, with a top quartile around $412. Treat $185 as the conservative 12-month anchor and the higher figures as multi-year or top-decile ceilings.
The single rule that governs all of it is LTV:CAC at or above 3:1, measured in margin dollars, not revenue. In beauty this is unusually strict, because CAC is often at or above AOV, which means the first order rarely covers acquisition on its own. A brand can hit 3:1 on revenue, feel safe, and actually be running closer to 1.5:1 once you strip the cost of goods and discounts out of LTV. The lever that saves the model is repeat rate. At a 70% gross margin, every additional order from a retained customer drops almost entirely to contribution, so a brand that lifts its 12-month repeat rate from 20% to 30% changes its LTV:CAC far more than one that shaves CAC by a few dollars. If your payback period stretches past the contribution margin on the first two orders, you are funding growth out of working capital, and that is exactly the bind that shows up as a cash crunch two quarters later.
Returns: the one place beauty wins
Returns are the leak that dominates apparel and barely registers in beauty. Online beauty return rates run about 4 to 10% of orders, often near 4 to 5%, against apparel at 20 to 40% and an all-ecommerce average near 19 to 21%. Beauty stays low for structural reasons: hygiene and resale rules mean many opened products cannot be accepted or resold, and testers, samples and shade-matching tools set expectations before purchase. One broader beauty and personal care dataset cites 12.3%, which is why the honest range is 4 to 10% rather than a single number, but most beauty-only studies sit at the low end.
The practical takeaway is to not over-index on returns. If you run a beauty brand and your operating margin is thin, the answer is very rarely sitting in your return rate. It is sitting in CAC and inventory turns. The brands that mistake beauty for apparel and pour effort into a returns-reduction program are usually solving a problem they do not have.
Stop benchmarking beauty on gross margin alone. The brands that survive 2026 are the ones managing the three line items below gross margin (CAC payback, repeat rate and inventory turns), not the ones with the prettiest COGS. A 70% gross margin is the price of entry; a 4% operating margin is the median outcome, and the gap between them is almost entirely within your control.
Where your brand sits: a scorecard
Run your own numbers against the band and the picture gets concrete fast. Gross margin below 65% is low for beauty and you need volume, mix or pricing to fix it. Between 65% and 75% is the broad healthy middle. Above 75% you have real room, but only if you protect it below the line. Then check the three leaks that actually decide profitability: is blended CAC under control relative to AOV with payback inside the first two orders, is your 12-month repeat rate at or above 30%, and are you turning inventory at least 3x? A brand that is green on gross margin but red on two of those three leaks is the most common profile we see in beauty, and it is also the most fixable.
This is the point of benchmarking at all. The comps set the direction and the ceiling, not your exact target, because they are far larger than a $5M to $50M brand. The Storeleads data underlines how small most beauty brands really are: the Shopify Beauty vertical spans 69,417 Skin & Nail Care stores, 53,040 Hair Care and 34,520 Make-Up & Cosmetics stores, and only about 3% of them are on Shopify Plus. The long tail is overwhelmingly sub-enterprise brands. But the shape holds at every size: gross margin is necessary and nowhere near sufficient. If your operating margin is stuck in the low single digits while your gross margin looks gorgeous, the answer is almost always sitting in CAC, repeat rate or inventory turns. If you want a second set of eyes on which leak is costing you the most, that is exactly the kind of read a fractional CFO is built for. For the deeper public-company cut, see the beauty retail vs DTC margins report and the apparel financial benchmark, which runs the same teardown on very different unit economics.
Sources and methodology
The hard margin numbers come from SEC EDGAR. We pulled annual XBRL financial statements for 7 beauty and personal-care tickers: e.l.f. Beauty (CIK 1600033), Estée Lauder (1001250), Ulta Beauty (1403568), Coty (1024305), Olaplex (1868726), Inter Parfums (822663) and Honest Company (1530979). Each metric uses the most recent fiscal-year filing per company, so fiscal year-ends differ: e.l.f. closes March 2026, Ulta closes January 2026, Estée Lauder and Coty close June 2025, and Olaplex, Inter Parfums and Honest close December 2025. We present these as "latest FY" with the year-end shown in the comps table rather than normalizing to a single calendar window.
Gross margin is gross profit divided by revenue. Operating margin is operating income divided by revenue. Inventory turnover is cost of revenue divided by the latest reported inventory tag in the returned XBRL, a COGS-based turns ratio. For Estée Lauder, Coty and Inter Parfums the inventory tag returned was the prior-year balance rather than the current fiscal year-end close, so those turns are computed on the latest available inventory figure and should be read as approximate rather than reconciled against the exact closing balance. Ulta's inventory was not separately tagged in the returned data, so its turns are marked n/a; as a retailer, its 39.1% gross and 12.4% operating profile is shown for contrast, not as a brand benchmark. Inter Parfums' revenue was derived as gross profit plus cost of revenue because the revenue tag was not returned at the top of the array. e.l.f.'s 4.5% operating margin is depressed by FY2026 acquisition amortization and integration costs, so the normalized figure runs materially higher.
The unit-economics figures (CAC, LTV, AOV, repeat rate and return rate) are third-party 2026 benchmark aggregations, not primary 10-K disclosures, because public filings do not report CAC or return rate as clean line items. CAC and AOV come from Polar Analytics ($37.88 median CAC, $66 median AOV), First Page Sage and Mintel via Amra & Elma. LTV and repeat-rate ranges come from MageLoyalty. Return-rate ranges come from NRF, Richpanel and the Banuba cosmetics returns study. The LTV:CAC standard of 3:1 in margin dollars is the cross-ecommerce 2026 benchmark.
Storeleads supplied the category-scale data. We queried Shopify store counts on the correct category leaves: Skin & Nail Care (69,417 stores, 2,170 on Shopify Plus), Hair Care (53,040) and Make-Up & Cosmetics (34,520, 1,202 on Shopify Plus), accessed 2026-06-11. Storeleads is used for store-count and size-band scale only; revenue and AOV estimates were not available at the current API tier, and Demandware-hosted stores such as e.l.f. were not accessible, so these are Shopify-only counts.
Three limitations are worth naming. First, the public comps skew far larger than the $5M to $50M operator this report serves, so they set direction and the margin ceiling, not the small-brand absolute. Second, the all-7 gross-margin median of 64.8% is pulled down by a retailer (Ulta) and a value brand (Honest), so we lead with the brand-only median near 69% and disclose the all-comp figure for transparency. Third, the inventory-turns proxy is a COGS-over-inventory ratio with mixed-vintage inventory tags for three comps, so treat the turns figures as directional. Full triangulation context, including the Perplexity and Parallel.ai source lists, lives in the research bundle for this post.
Frequently asked questions
what is a good gross margin for a beauty brand in 2026?
A healthy beauty brand gross margin in 2026 sits between 65% and 75%, with strong brands reaching 75 to 85% on premium lines. The brand-only median across the public comps is about 69%, and the simple median across all 7 comps is 64.8% once you include a retailer and a value brand. But gross margin alone is a weak health signal in beauty, because CAC, SG&A and slow inventory sit below it.
why is my beauty gross margin great but my operating margin terrible?
Because beauty leaks margin below the gross line more than any other consumer category. The public comps keep 64 to 74 cents of gross margin on the dollar but convert a median of just 4.1% to operating profit. Customer acquisition, marketing as 20 to 30% of revenue, and SG&A eat the spread. Olaplex is the clearest example: a 69.4% gross margin that converted to a 1.6% operating margin.
what is a typical cac payback period for a dtc beauty brand?
With CAC at $40 to $100+ and AOV around $66, beauty first-order profit is frequently negative, so payback usually lands in the second or third order, not the first. The practical target is payback inside 6 months of margin dollars. If CAC is above AOV and your repeat rate is under 25%, payback can stretch past a year, which is where working-capital strain starts.
what ltv to cac ratio should a beauty brand target?
Target LTV:CAC at or above 3:1, measured in margin dollars rather than revenue. Cross-ecommerce medians run about 3.4:1, with top quartile near 5.6:1. Because beauty CAC is often at or above AOV, the only thing that makes the model pencil is repeat rate, so the margin-dollar ratio matters far more than the revenue version.
what inventory turns are normal for a beauty ecommerce brand?
The healthy fast-moving-beauty target is 4 to 9 turns per year. Public beauty comps fall well short, clustering at 1.5 to 2.9x. Components, finished goods and long formulation lead times tie up cash. Below about 2x usually signals overstock or slow-moving SKUs, and it is one of the highest-impact numbers an operator can fix.
what is a normal aov for a dtc skincare or makeup brand?
Plan for an AOV of $55 to $70 for mass beauty, with a $66 median across recent panels. Bundles, kits and regimen sets can push AOV to $80 to $120, but that usually comes with higher CAC. Prestige and clinical lines run higher per order. AOV is the number you raise to make a high CAC pencil, so bundling and subscription starter sets are the usual levers.
what is the return rate for online beauty and cosmetics sales?
Online beauty return rates run about 4 to 10% of orders, often near 4 to 5%, versus apparel at 20 to 40% and all-ecommerce near 19 to 21%. Hygiene and resale rules block most returns, and testers and sampling set expectations. One broader beauty and personal care dataset cites 12.3%, but most beauty-only studies sit at the low end. Returns are not the beauty leak.
what's a realistic net margin for a beauty brand at $5m to $50m revenue?
Plan for a 3 to 10% net margin. The cross-DTC median sits in that band after CAC inflation, and beauty is no exception despite its high gross margin. Retention-led brands with controlled CAC and faster turns can reach 8 to 15% net, but if you are modeling 20%+ net at this size, the model is almost certainly too optimistic.
Related Eightx benchmarks: Beauty Ecommerce Gross Margin 2026 and Who's Buying Beauty Brands? Acquirers and Multiples 2026.