
eCommerce
Beverage Brand Financial Benchmarks 2026
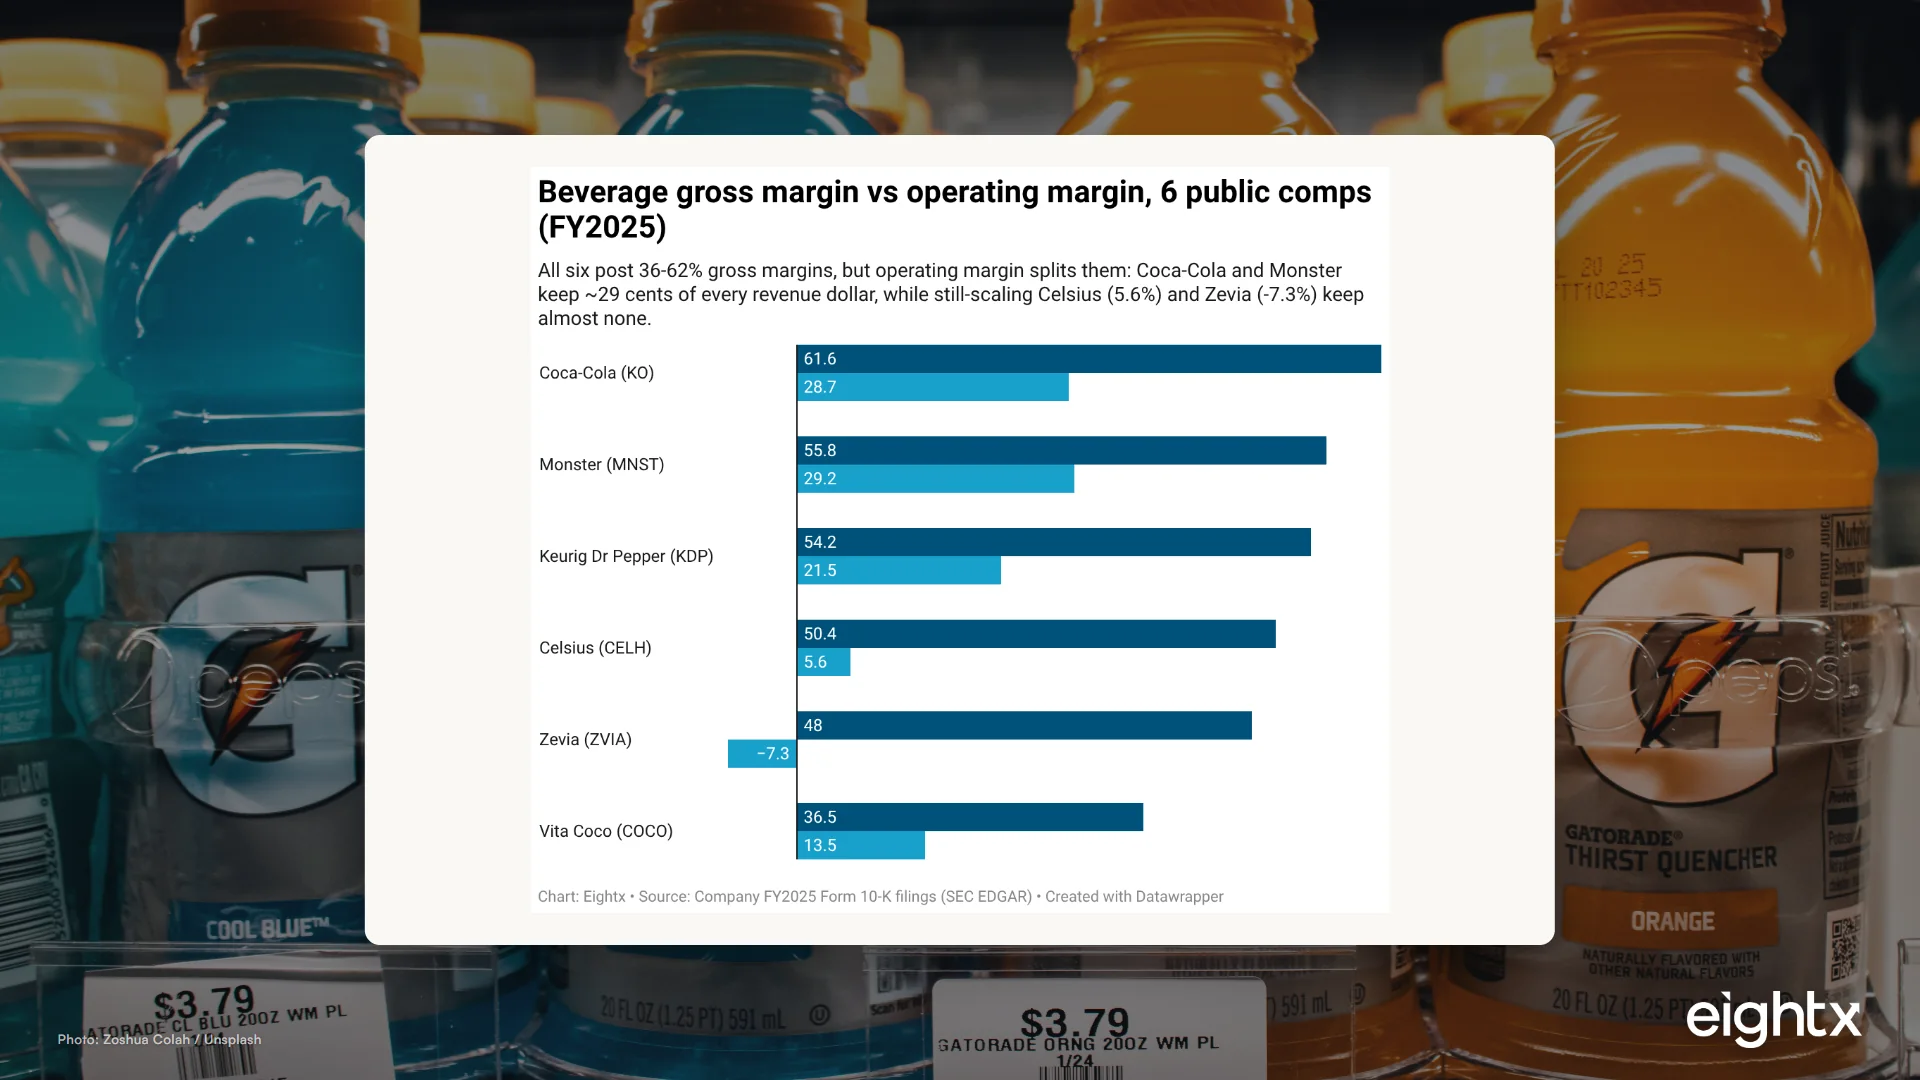
Public beverage gross margin spans 36 to 62% (median ~52%), but operating margin runs from -7.3% at Zevia to 29.2% at Monster. For a sub-$150M DTC beverage brand the deciding numbers are not gross margin: they are CAC of $45 to $53, repeat-purchase economics, and inventory turns, because a low-AOV consumable only pencils on the second order.
Key Takeaways
- Public beverage gross margin spans 36 to 62%, median ~52% (FY2025 10-Ks): Coca-Cola 61.6%, Monster 55.8%, Keurig Dr Pepper 54.2%, Celsius 50.4%, Zevia 48.0%, Vita Coco 36.5%. Gross margin is not the differentiator operators think it is.
- Operating margin is where scale shows up: -7.3% to 29.2%. Coca-Cola (28.7%) and Monster (29.2%) keep nearly 29 cents of every revenue dollar, while Celsius (5.6%) and Zevia (-7.3%) keep almost none. Median across the six is ~17.5%.
- DTC food and beverage has the lowest CAC of any vertical at $45 to $53, well under the $68 to $84 all-ecommerce range, but CAC has inflated roughly 40% into 2026 so the cushion is shrinking.
- A healthy beverage LTV:CAC is 3:1 or higher (cross-industry median 3.4:1). Because AOV is low and CAC is mid-range, almost no beverage brand is profitable on the first order. Repeat purchase is the entire model.
- Inventory turns range 3.9x to 9.5x; days inventory 38 to 94. For a small brand, every extra 30 days of stock on a heavy, low-margin SKU is real cash locked up. The working-capital cycle, not the P&L margin, is what strangles sub-$10M beverage brands.
Beverage looks like a simple business until you read past the gross-margin line. Public 10-K data from 6 beverage comps filed in early 2026 puts gross margin anywhere from 36.5% to 61.6%, a spread so wide it is almost useless as a benchmark on its own. The number that actually separates these companies is operating margin, and there the range is brutal: from -7.3% at Zevia to 29.2% at Monster. This report consolidates the margin, CAC, LTV, AOV, returns and inventory numbers a beverage operator at $5M to $150M actually needs, anchored on real public-company filings and cross-checked against 2026 DTC benchmark data. The thesis is simple: stop benchmarking yourself against Coca-Cola's 61% gross margin, pick the right revenue band and channel mix, then fix the one lever, usually CAC payback or inventory turns, that is actually capping your growth.
The margin spread is wider than you think
Start with the two numbers that define the category. Across the 6 public comps, gross margin runs from 36.5% at Vita Coco to 61.6% at Coca-Cola, with a median near 52%. That is a 25-point spread, and it tempts every operator into the wrong comparison. Operating margin tells the real story: Coca-Cola at 28.7% and Monster at 29.2% sit at one end, Keurig Dr Pepper at 21.5% and Vita Coco at 13.5% in the middle, and Celsius (5.6%) and Zevia (-7.3%) at the bottom. The median operating margin is roughly 17.5%, but that median hides a bimodal split between mature scale players who convert revenue to profit and still-scaling brands pouring everything back into SG&A and marketing.
When I talk to founders running a brand this size, the first benchmark they quote me is gross margin, and it is almost always the wrong one to lead with. A brand sitting at 50% gross margin and convinced it is healthy can still be deep in the red if its CAC payback runs past the second or third order and its SG&A is scaling faster than revenue. Celsius is the public-company version of exactly that profile: a perfectly respectable 50.4% gross margin converting to just 5.6% operating because the brand is still buying its growth. Gross margin is necessary and nowhere near sufficient.
| Company | Ticker | Revenue ($M) | Gross margin | Operating margin | Inventory turns | Days inventory |
|---|---|---|---|---|---|---|
| Coca-Cola | KO | 47,941 | 61.6% | 28.7% | 3.9x | 94 |
| Keurig Dr Pepper | KDP | 16,603 | 54.2% | 21.5% | 5.9x | 62 |
| Monster Beverage | MNST | 8,294 | 55.8% | 29.2% | 5.0x | 73 |
| Celsius Holdings | CELH | 2,515 | 50.4% | 5.6% | 9.5x | 38 |
| Vita Coco | COCO | 610 | 36.5% | 13.5% | 4.6x | 79 |
| Zevia | ZVIA | 161 | 48.0% | -7.3% | 4.5x | 81 |
| Median | 52.3% | 17.5% | 4.8x | 76 |
What "good" looks like at each stage
The comps set the ceiling, not your target, because they are far larger than a $5M to $150M brand. But the shape holds at every size, so it helps to translate it into stage-specific targets. At seed and early scale (under $5M), expect a 45 to 55% product gross margin and accept that you are likely pre-profit or barely breakeven at the operating line while you learn acquisition. By Series A and into the $10M to $50M band, you should be holding 50 to 60% gross margin before CAC and pushing operating margin out of the red toward 5 to 10%. Scaled DTC and omnichannel brands above $50M should be running 40 to 50% fully loaded and operating margins in the low double digits if the model is working.
Channel mix moves these numbers more than anything else. Pure DTC carries the fattest product gross margin, 50 to 70% before CAC, because you keep the full retail spread. Wholesale runs 35 to 45% once the retailer takes its cut, and distributor channels land at 25 to 40% after the broker and distributor margins stack. Trade spend, the slotting fees and promotional allowances retailers extract, can quietly pull another 10 to 20 points off the wholesale line. The detail behind these unit-economics targets sits in our beverage brand unit economics breakdown; this report is the summary view.
The DTC unit economics that actually decide it: CAC, LTV, AOV, repeat rate
For a sub-$150M DTC beverage brand, the public-company margins are a backdrop. The numbers that decide the business are the unit economics, and they are unusually unforgiving in beverage. The good news is that DTC food and beverage carries the lowest CAC of any vertical at $45 to $53, well under the $68 to $84 all-ecommerce range, helped by a Shopify food and beverage conversion rate of 6.22%, the highest of any category. The bad news is that CAC has inflated roughly 40% heading into 2026, so the cushion that made beverage forgiving is shrinking.
The trap is AOV. Beverage AOV sits at $35 to $65, low enough that a single $45 to $53 acquisition almost never pays back on the first order. That makes repeat purchase the entire model. A 30% repeat-purchase rate is a good non-subscription target, and replenishment subscriptions, the beverage-friendly model, churn just 4 to 7% per month versus 12 to 18% for curation boxes. Twelve-month LTV for DTC consumables and subscriptions runs $98 to $241, and the rule that governs all of it is LTV:CAC at or above 3:1 in margin dollars, with the cross-industry median at 3.4:1 and the top quartile at 5.6:1.
The pattern we see again and again is operators who treat the first order as the win. When we have struggled to move a beverage brand's profitability, the lever was almost never another point of COGS. It was getting the repeat rate from the low 20s into the low 30s and pulling CAC payback inside the second order's contribution margin. A brand that was sitting on a 22% repeat rate and a four-order payback period turned the corner once the second-order economics worked, not when it renegotiated its co-packer.
| Metric | Benchmark band | Source basis |
|---|---|---|
| DTC product gross margin (before CAC) | 50 to 60% | Foundry CRO / CPG operator data |
| Fully-loaded DTC margin (excl. marketing) | 40 to 50% | Foundry CRO / Eagle Rock CFO |
| CAC (blended) | $45 to $53 | Foundry CRO 2026 |
| LTV (consumables / subscription) | $98 to $241 | Vendor composite 2026 |
| LTV:CAC (healthy) | 3:1 to 5:1 | Eightx 2026 |
| AOV | $35 to $65 | Operator pricing data |
| Repeat purchase rate (90d) | 25 to 40% | Foundry CRO |
| Subscription monthly churn (replenishment) | 4 to 7% | Foundry CRO |
| Refund / replacement rate (shelf-stable) | 1 to 3% | Operator practice |
| Shopify conversion rate (food & beverage) | 6.22% | Shopify 2026 benchmark |
The hidden killer: inventory and the cash conversion cycle
Inventory is the leak operators measure least and pay for most, and in beverage it is brutal because the product is heavy, low-AOV and bulky to store. The public comps turn inventory anywhere from 3.9x per year at Coca-Cola (94 days of stock) to 9.5x at Celsius (just 38 days), with Celsius running fast precisely because it pushed distribution onto a major beverage partner. Days inventory clusters in the 70 to 94 range for most of the field. The cash conversion cycle, days inventory plus days receivable minus days payable, swings from deeply negative at the giants who fund themselves on supplier terms to around 88 days at Vita Coco, where the brand finances nearly three months of working capital before scale kicks in.
A footnote matters here: Coca-Cola's days payable of 431 and Keurig Dr Pepper's 143 are inflated by large accrual balances booked inside accounts payable, not pure supplier terms, so their cash conversion cycles look more extreme than a small brand could ever replicate. The lesson is not to copy Coca-Cola's payables-funded cycle. It is that the cash gap between paying your co-packer and collecting from customers is the real constraint on a small beverage brand.
When I talk to founders this size, the ones in working-capital trouble are almost always the ones carrying 90-plus days of a heavy SKU while running below 4 turns a year. They feel the squeeze as a cash-flow problem and reach for a line of credit, when the root cause is an inventory-planning and demand-forecasting problem. One brand was sitting on roughly 110 days of stock and treating it as a financing question right up until it became obvious the fix was ordering less, more often. Faster turns free up the exact working capital you would otherwise borrow to fund acquisition.
| Company | Days inventory (DIO) | Days receivable (DSO) | Days payable (DPO) | Cash conversion cycle |
|---|---|---|---|---|
| Coca-Cola (KO) | 94 | 27 | 431 | -310 |
| Keurig Dr Pepper (KDP) | 62 | 33 | 143 | -48 |
| Monster (MNST) | 73 | 54 | 47 | 81 |
| Celsius (CELH) | 38 | 39 | 12 | 66 |
| Vita Coco (COCO) | 79 | 38 | 29 | 88 |
| Zevia (ZVIA) | 81 | 24 | 67 | 39 |
Stop benchmarking your beverage brand against Coca-Cola's 61% gross margin. The number that decides whether you make money is not the headline markup, it is the spread between your CAC and your repeat-order economics, and the days of cash trapped in heavy inventory. A 52% gross margin is the price of entry. A 17% operating margin is the median outcome at scale, and for a small DTC brand the gap between them lives almost entirely in CAC payback and inventory turns.
How to use these benchmarks
Run your own numbers against the band and the picture gets concrete fast. First, pick your revenue band and channel mix, because a $5M pure-DTC brand and a $40M wholesale-led brand are not playing the same game and should not share a target. Then check the three levers that actually move beverage profitability. Is your repeat-purchase rate at or above 30%, or are you still trying to win on the first order against a $45-plus CAC? Is your LTV:CAC at or above 3:1 in margin dollars, not revenue dollars? And are you turning inventory at least 4x a year, or is cash trapped in 90-plus days of heavy stock?
A brand that looks green on gross margin but red on two of those three levers is the most common profile we see, and it is also the most fixable. The comps prove the ceiling exists; your job is to find your worst lever and fix that one first. If you want a second set of eyes on which leak is costing you the most, that is exactly the read a fractional CFO is built for. For the sibling category, the apparel financial benchmark runs the same teardown on a very different unit-economics profile.
Sources and methodology
The hard margin numbers come from SEC EDGAR. We pulled FY2025 Form 10-K data for six public beverage filers and their CIKs: Coca-Cola (KO, 21344), Keurig Dr Pepper (KDP, 1418135), Monster Beverage (MNST, 865752), Celsius Holdings (CELH, 1341766), The Vita Coco Company (COCO, 1482981) and Zevia PBC (ZVIA, 1854139). All fiscal years ended December 31, 2025, with filings dated February to March 2026. Gross margin is gross profit divided by revenue; operating margin is operating income divided by revenue; inventory turns is cost of revenue divided by inventory; days inventory is 365 divided by turns; days receivable is accounts receivable divided by revenue times 365; days payable is accounts payable divided by cost of revenue times 365; and the cash conversion cycle is days inventory plus days receivable minus days payable.
Several caveats are worth naming. Zevia's FY2025 cost of goods was derived as revenue minus gross profit. Coca-Cola and Keurig Dr Pepper carry large accrual balances inside the accounts-payable line, not pure trade payables, which is why their days payable and cash conversion cycles look extreme and should not be read as a small-brand benchmark. Inventory for several comps is the most recent reported balance-sheet value where the FY2025 closing instant was not separately tagged in the returned XBRL, so the turns figures are directional rather than reconciled. As a cross-check, Monster's own FY2025 press release reports a 55.8% gross margin on a net-sales basis, matching the 10-K-derived figure. PepsiCo was deliberately excluded because its beverage segment margins are not cleanly separable from Frito-Lay in the consolidated filing, so this comp set is pure-play beverage only.
The unit-economics figures (CAC, LTV, AOV, repeat rate, churn and conversion) are third-party 2026 benchmark aggregations, not primary 10-K disclosures, because public filings do not report CAC or repeat rate as clean line items. CAC, repeat rate and churn come from Foundry CRO's 2026 DTC food and beverage benchmarks. LTV by category is a 2026 vendor-composite range. The CAC-inflation figure and the LTV:CAC standard come from Yotpo. The Shopify food and beverage conversion rate of 6.22% is the Shopify 2026 vertical benchmark.
StoreLeads supplied the category context: the Food & Drink category spans 212,895 Shopify stores globally (82,297 in the US) versus 312,660 on WooCommerce, with 2.9% on Shopify Plus, 16.7% running Klaviyo and 4.2% running Recharge subscriptions. One limitation matters here: the StoreLeads search filter matches the top-level Food & Drink category, not a beverage-only subcategory, so those aggregates are Food & Drink-wide and should be read as a proxy for how few DTC stores have operationalized the repeat-purchase model the economics demand, not a beverage-specific count.
Two structural limitations close this out. First, the public comps skew far larger than the $5M to $150M operator this report serves, so they set direction and the margin ceiling, not the small-brand absolute. Second, the third-party benchmark ranges blend geographies, price points and subscription mixes, so treat them as the shape of the category rather than a single precise target. Full triangulation context, including the Perplexity and Parallel.ai source lists, lives in the research bundle for this post.
Frequently asked questions
what gross margin should a beverage brand have in 2026?
Across 6 public beverage comps the gross-margin range is 36.5% to 61.6% with a median near 52%. For a DTC beverage brand, target 50 to 60% product gross margin before CAC and 40 to 50% fully loaded after fulfillment. But gross margin is a weak health signal in beverage because CAC and repeat rate, not COGS, decide whether you make money.
is a 40% gross margin good for a beverage brand?
It is workable but tight. Vita Coco runs a 36.5% gross margin at over $600M in revenue and still posts a 13.5% operating margin, so 40% can work at scale with disciplined SG&A. For a sub-$50M DTC brand, 40% fully loaded is about the floor: below it, scaling is very hard unless your CAC is unusually low or your repeat rate is exceptional.
what's a healthy ltv to cac ratio for a dtc beverage brand?
Aim for LTV:CAC at or above 3:1, measured in margin dollars rather than revenue. The cross-industry median is 3.4:1 and the top quartile reaches 5.6:1. Because beverage AOV is low and CAC is mid-range, the ratio is built almost entirely on repeat purchases, not the first order.
what is the average cac for a dtc beverage brand in 2026?
DTC food and beverage CAC runs $45 to $53 in 2026, the lowest of any DTC vertical and well under the $68 to $84 all-ecommerce range. The catch is that CAC has inflated roughly 40% heading into 2026, so the historical acquisition cushion that made beverage forgiving is shrinking fast.
why is my beverage brand not profitable even though gross margin looks fine?
Because beverage leaks margin below the gross line and barely earns anything on the first order. A low AOV against a $45 to $53 CAC means the first purchase often loses money by design. If repeat purchase is weak, or inventory is turning slowly and trapping cash, a healthy 52% gross margin never reaches operating profit. Celsius posts a 50.4% gross margin and just 5.6% operating for exactly this reason.
what is a good repeat purchase rate for a beverage brand?
Around 30% is a good non-subscription target, and beating 25% already puts you above average. Replenishment subscriptions, the beverage-friendly model, churn just 4 to 7% per month versus 12 to 18% for curation boxes. Since a consumable only pencils on the second order, repeat rate is the single most important number to move.
how much inventory should a beverage brand carry?
Public beverage inventory turns range from 3.9x at Coca-Cola to 9.5x at Celsius, with days inventory of 38 to 94. For a small brand, every extra 30 days of stock on a heavy, low-margin SKU is real cash locked up. Faster turns free up the working capital you would otherwise need to borrow to fund acquisition.
what return or refund rate is normal for beverage ecommerce?
Physical returns are usually under 1 to 2% of orders because shelf-stable beverages are rarely sent back. The metric that matters is refunds and replacements for leakage or damage in transit, realistically 1 to 3% when fulfillment is dialed in, rising to 3 to 8% for fragile or cold-chain SKUs. Above 5% usually points to a packaging or carrier problem.
Related Eightx benchmarks: Beverage Brand Unit Economics and Celsius vs Vital Farms vs Beyond Meat.