
Margins
Beverage Brand Unit Economics: Why Drinks Are the Hardest CPG Margins (2026)
Beverages are the hardest CPG margins because the product sells for $1 to $3 a unit, weighs a pound or more, and ships as a liquid. Freight and warehousing alone can eat 12 to 18 percent of revenue, trade spend takes more, and gross margin often lands in the 45 to 55 percent band that demands real volume to clear overhead.
Key Takeaways
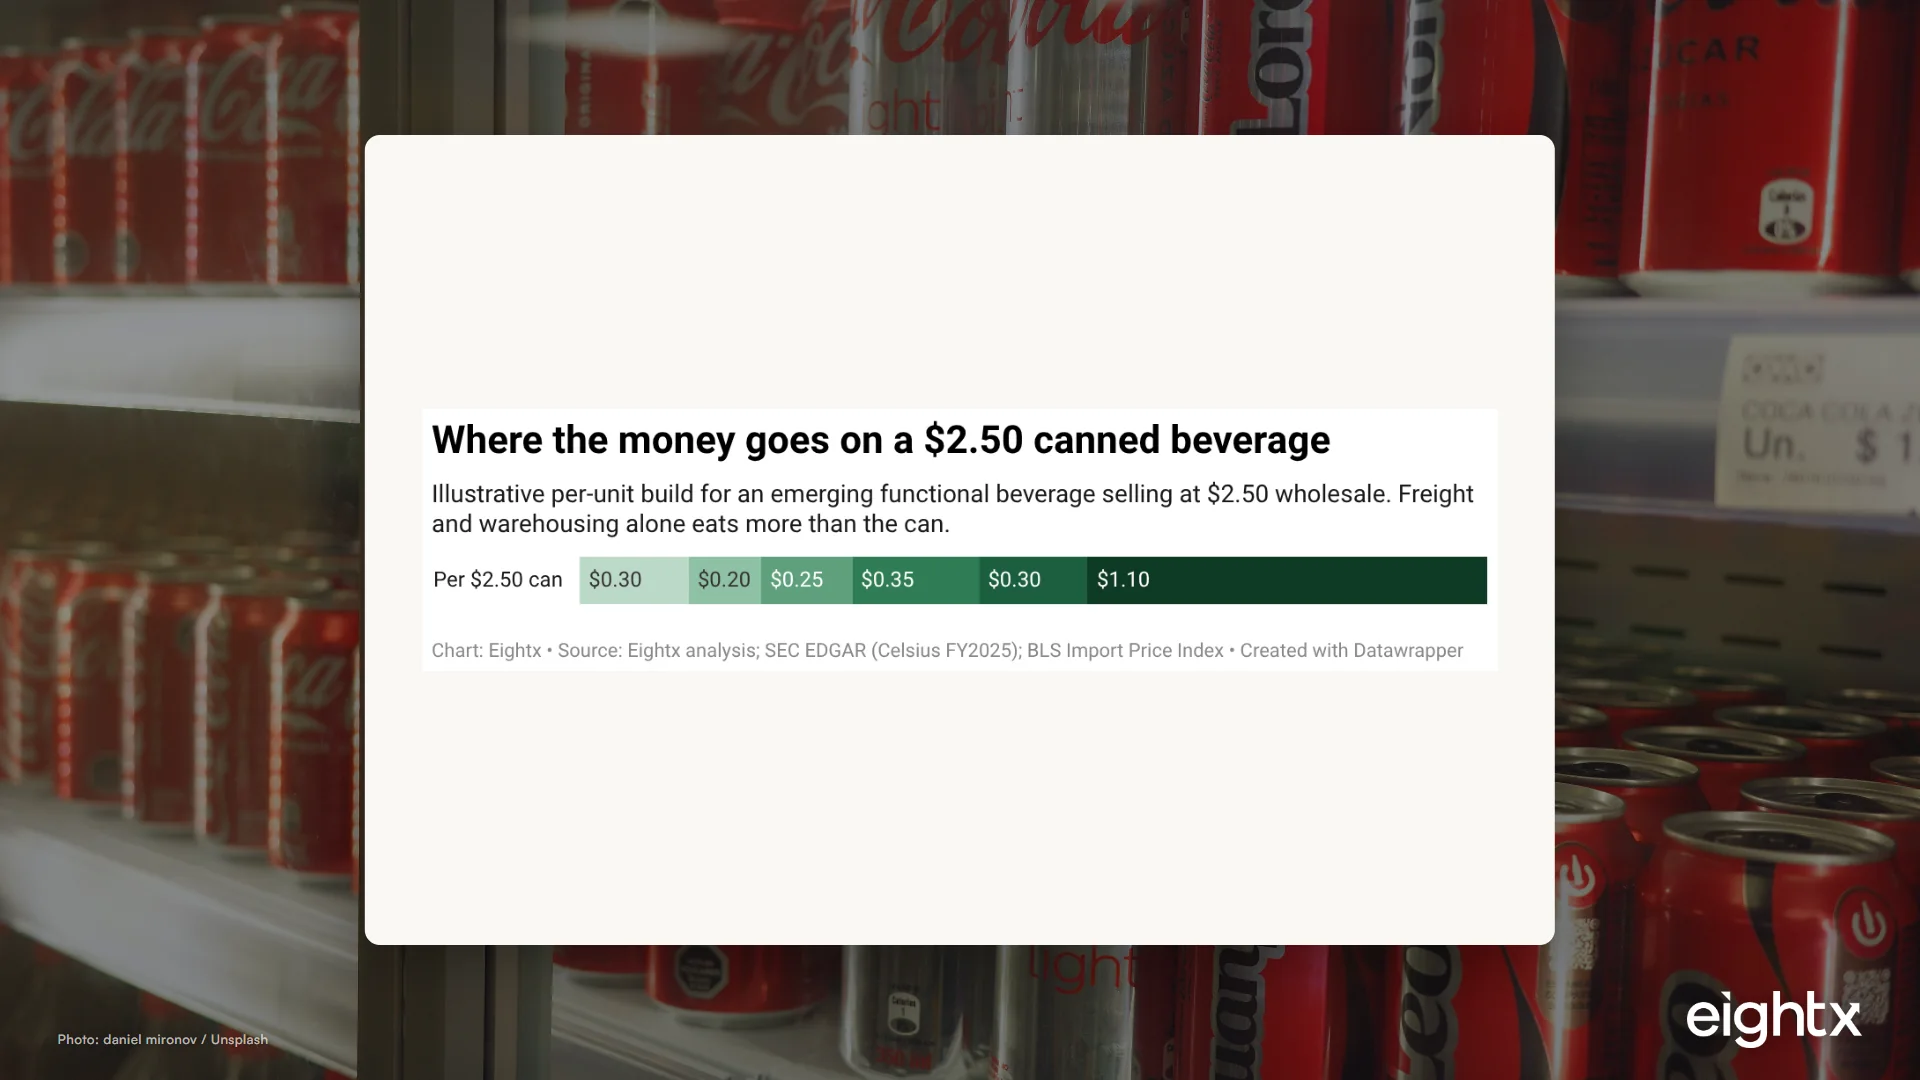
- On a $2.50 wholesale can, freight and warehousing (about $0.35) can cost more than the liquid or the can on its own, the single feature that makes beverage the hardest CPG vertical.
- Celsius (CELH) posted a 50.4 percent gross margin but only a 5.6 percent operating margin in FY2025 on $2.52B revenue, with SG&A near $799M (about 32 percent of revenue).
- Operating margin, not gross margin, is the real spread: Coca-Cola and Monster both clear ~29 percent operating margin on similar gross margins, so SG&A discipline and scale decide beverage profitability.
- Producer prices to make and move a drink have outrun inflation: soft-drink manufacturing PPI is up 39 percent since 2021, freight trucking 40 percent, and warehousing 52 percent.
- The math only closes on volume: at a $1.10 per-unit gross profit, you need roughly 2.7 million units a year just to fund a $3M operating base.
If you want to understand why beverage is the hardest margin in consumer packaged goods, do not start with the P&L. Start with a single can. It sells for one to three dollars. It weighs roughly a pound once you count the liquid and the container. And it ships as a heavy, low-value object across the same freight network that carries products worth ten times as much per pound. That combination is brutal, and it is why so many beverage brands grow revenue fast and never make a dollar of operating profit.
When I talk to founders running a beverage brand this size, the pattern is almost always the same. They are proud of a 50 percent gross margin and assume it drops to the bottom line. It does not. Freight eats it. Slotting eats it. The warehouse eats it. By the time the can is on a shelf and the trade spend is accrued, the contribution is a fraction of what the gross margin line implied. Below I walk the per-unit math, anchor it to public beverage numbers, and lay out what it actually takes to be profitable. For the broader category picture, this sits under our fractional CFO for food and beverage brands work.
Why beverages are structurally the worst margin in CPG
Every CPG category fights cost. Beverage fights four costs at once, and they compound.
Low price per unit. A can sells for $1 to $3 at wholesale. A jar of premium skincare sells for $20 to $40. Both take a finite amount of management, freight booking, and overhead to move. When the unit is cheap, every fixed cost becomes a bigger percentage of the sale.
Weight and cube. Liquid is heavy. A pallet of beverage hits the weight limit of a truck long before it fills the space. You pay to ship water. Compare that to apparel or supplements, where you fit far more retail value into the same trailer.
Packaging cost. The can or bottle is a real line item, commonly 25 to 40 percent of beverage COGS. Aluminum cans run about $0.08 to $0.16 each and glass bottles run $0.20 to $0.45, roughly two to four times more, before you add labels, secondary packaging, and shrink wrap. Glass also breaks, which adds damage and freight cost.
A low starting gross margin. Beverage gross margins cluster in the 45 to 55 percent band, below beauty and supplements. You begin the race with less margin to give away, and beverage hands more of it to freight than any other category. On top of that, the cost to make and move a drink has been climbing: BLS producer prices for soft-drink manufacturing are up 39 percent since January 2021, general freight trucking up 40 percent, and warehousing up 52 percent. The squeeze is real and it is coming from both the can and the truck.
The per-can unit economic model
Here is an illustrative build for an emerging functional beverage selling at $2.50 a can to a distributor or retailer. These are planning numbers, not one brand's actuals, but they reflect the cost pattern we see across beverage clients.
Walk it line by line:
| Line item | Per $2.50 can | % of price |
|---|---|---|
| Liquid and ingredients | $0.30 | 12% |
| Can and packaging | $0.20 | 8% |
| Co-pack and fill | $0.25 | 10% |
| Freight and warehousing | $0.35 | 14% |
| Trade and slotting | $0.30 | 12% |
| Gross profit left | $1.10 | 44% |
The headline is the freight line. At $0.35, freight and warehousing costs more than the liquid and more than the can. That is the sentence that defines beverage. In beauty or supplements, freight is a rounding error against the sale price. In beverage, it is the single largest cost after the gross profit itself. Add trade and slotting, which the consumer never sees, and a 50-something percent theoretical gross margin has already become a 44 percent number that still has to fund marketing, sales salaries, and the back office.
This is exactly why I push founders to stop managing to gross margin off the invoice and build the contribution number instead. When I talk to operators at this stage, the ones who get profitable are the ones who can tell me their contribution per can after shipping, payment processing, and trade, not just the gross margin their co-packer quoted them.
What the public beverage leaders tell us
The clearest reality check comes from the public market. Celsius Holdings (CELH) is the beverage growth story of the decade, and its FY2025 Form 10-K, filed with the SEC, shows why even winning is hard. Revenue of $2.52B, gross profit of $1.27B, a 50.4 percent gross margin. That is a strong beverage gross margin. But operating income was only $141M, a 5.6 percent operating margin, because selling, general, and administrative expense ran roughly $799M, about 32 percent of revenue.
Now put it next to the established players. Monster (MNST) earned a 55.8 percent gross margin and a 29.2 percent operating margin in FY2025. Coca-Cola (KO) earned 61.6 percent gross and 28.7 percent operating. Same category, similar gross margins, and yet the operating margin ranges from 29 percent down to 5.6 percent. That spread is the whole lesson: beverage operating margin is decided by SG&A discipline and scale, not by the gross line everyone quotes.
| Company | Revenue | Gross margin | Operating margin | SG&A % of revenue |
|---|---|---|---|---|
| Coca-Cola (KO) | $47.9B | 61.6% | 28.7% | 30.3% |
| Monster (MNST) | $8.3B | 55.8% | 29.2% | n/a (combined opex) |
| Celsius (CELH) | $2.5B | 50.4% | 5.6% | 31.8% |
Read the Celsius line again. A category leader at $2.5B in revenue, with a healthy gross margin, converts under six cents of every revenue dollar to operating profit. The gap between gross margin and operating margin is the whole story of beverage: distribution, marketing, and the people required to win shelf and hold velocity consume almost everything the gross margin produced.
How much volume it actually takes
Because the per-unit dollars are small, beverage profitability is a volume equation, not a price equation. There is a rule I come back to constantly with ecommerce founders: the typical ecommerce company has to bring in four to five dollars of revenue to cover every dollar of fixed cost. Beverage is the sharpest version of that rule, because the contribution per unit is so thin.
Take the illustrative $1.10 gross profit per can. Suppose your fixed operating base, salaries, warehouse, software, marketing floor, is a modest $3M a year. The quickest breakeven formula is fixed cost over contribution per unit:
$3,000,000 / $1.10 = roughly 2.7 million units a year just to cover that base before a dollar of profit, and before any growth marketing.
That is about 113,000 standard 24-can cases. For a brand still building distribution, that is a serious number, and it explains why beverage brands raise so much capital. Even Celsius, the category winner, ran positive financing cash flow of $583M in FY2025 and carries $677M of long-term debt: outside money is funding the gap between low per-unit margin and the volume required to make fixed costs disappear. When we have worked through this with operators, the thing that surprises them is that fixed costs do not scale down with a slow month. Whether you sell one unit or ten thousand, you still pay the salaries, the software, and the warehouse minimum. That is why beverage has to be run to a volume target, not a price target.
What to do about it
If you run a beverage brand, here is the order of operations I would work through.
- Build the per-unit model first, fully loaded. Liquid, packaging, co-pack, inbound freight, outbound freight, warehousing, trade, and slotting. Not the gross margin off your invoice, the contribution margin after every variable cost. If you do not know your per-can contribution, you are flying blind.
- Attack freight before you attack ingredients. Freight is your biggest non-obvious cost. Optimize pallet configuration, ship full truckloads, locate inventory near demand, and negotiate carrier rates on weight. A point of freight is worth more than a point of ingredient cost, and the 3PL bill alone often lands at 12 to 15 percent of revenue for an emerging brand.
- Choose cans unless positioning forces glass. Cans are cheaper, lighter, and do not break. If glass is core to the brand, price for it and accept the freight penalty consciously.
- Map your channels by contribution, not revenue. Wholesale contribution often runs around 30 percent while DTC runs 20 to 30 percent once parcel is loaded. The pattern we see again and again is a founder convinced DTC is the high-margin channel, then discovering they are spending more on shipping a heavy can than they charge for it. Know which channel actually makes money, the way we lay out in the CPG channel margin map.
- Accrue trade spend in the close. Brands routinely discover trade is 20 percent of wholesale, not the 12 they assumed, because it was never accrued. Bigger retailers expect co-marketing and end caps, and slotting can run thousands of dollars per SKU just to get on shelf. That surprise is the difference between a profitable line and a losing one.
- Set a volume target tied to your fixed base. Know your breakeven units. Manage the business toward cases shipped at a healthy contribution, not toward top-line revenue that hides the margin problem.
Sources and methodology
The per-unit build is an illustrative Eightx planning model for an emerging functional beverage at a $2.50 wholesale price, not a single brand's reported actuals. Component ranges reflect patterns across beverage clients and published norms, cross-checked via Perplexity and Parallel.ai against beverage logistics and packaging sources; they are directional, not a single market quote. Re-run every number against your own COGS before making decisions.
The public benchmark figures are pulled from each company's FY2025 Form 10-K via SEC EDGAR XBRL. Celsius Holdings (CIK 1341766): revenue $2,515.3M, gross profit $1,267.3M (50.4 percent), operating income $141.1M (5.6 percent), SG&A $798.8M (31.8 percent), operating cash flow $359.4M, financing cash flow +$582.8M, long-term debt $676.9M. Monster Beverage (CIK 865752): revenue $8,294.3M, gross profit $4,632.2M (55.8 percent), operating income $2,419.4M (29.2 percent). Coca-Cola (CIK 21344): revenue $47,941M, gross profit $29,544M (61.6 percent), operating income $13,762M (28.7 percent), SG&A $14,521M (30.3 percent).
Input-cost direction is from the BLS Producer Price Index: soft drink and ice manufacturing (PCU31211) rose from 145.0 in January 2021 to about 202.0 in April 2026 (+39 percent), general freight trucking (PCU484) from 151.8 to 212.7 (+40 percent), and warehousing and storage (PCU493) from 110.7 to 167.9 (+52 percent). The series use different base years, so they describe trend, not relative level. April 2026 values are flagged preliminary by BLS.
The freight-as-a-share-of-revenue figure has two anchors: roughly 5.5 percent of revenue at scale, per the SONAR beverage transportation spend white paper, and 12 to 18 percent for emerging DTC-heavy brands, an Eightx operator estimate combining 3PL cost (around 12 to 15 percent of revenue) with parcel and returns. Trade-spend ranges of 15 to 25 percent of gross sales at maturity and 20 to 35 percent at launch are from the Plante Moran 2026 Food and Beverage Outlook. Aluminum can and glass bottle unit costs are directional industry ranges, not a single quoted price.
Operator-voice observations are anonymized and paraphrased from Eightx founder calls and are not attributed to any named client.
Frequently Asked Questions
why are beverage margins so hard compared to other cpg categories?
Beverages combine the four worst traits for margin in one product: a low price per unit (often $1 to $3), heavy weight from liquid and packaging, a bulky cube that fills a truck on weight before volume, and a gross margin band of roughly 45 to 55 percent. Freight and warehousing alone can run 12 to 18 percent of revenue for an emerging brand, so the math only works at high volume.
what is a good gross margin for a beverage brand?
For an emerging functional beverage, a fully loaded gross margin in the 45 to 55 percent range is typical, and public leader Celsius posted 50.4 percent in FY2025. The number that matters more is contribution margin after freight, warehousing, and trade spend, because a strong gross margin off the invoice can still leave thin dollars once those loads are in.
how much does freight cost as a percentage of revenue for beverages?
Beverage companies average roughly 5.5 percent of revenue on transportation at scale, but emerging brands shipping smaller volumes and using DTC parcel often see 12 to 18 percent once warehousing and returns are included. Because a can or bottle is heavy and cheap, freight is a larger share of the sale price than in almost any other CPG category.
how many units does a beverage brand need to sell to be profitable?
It depends on your per-unit gross profit and overhead. At an illustrative $1.10 gross profit per $2.50 can and a $3M operating base, you need about 2.7 million units a year just to break even before marketing. Beverage is a volume game: the per-unit dollars are small, so profitability comes from cases shipped, not price.
are aluminum cans or glass bottles cheaper for a beverage brand?
Aluminum cans run about $0.08 to $0.16 per unit as a directional range, while glass bottles run $0.20 to $0.45, roughly two to four times more. Glass also weighs more and breaks, which raises freight and damage costs. For most emerging brands, cans are the cheaper and lighter choice unless the category or positioning demands glass.
why does celsius have high revenue but a thin operating margin?
Celsius posted $2.52B in revenue and 50.4 percent gross margin in FY2025, but operating margin was only 5.6 percent because SG&A reached about $799M, near 32 percent of revenue. Beverage requires heavy marketing and distribution to win shelf and hold velocity, so even a category leader converts only a small slice of revenue to operating profit.
how much should i budget for trade spend and slotting as a beverage brand?
Plan for trade spend of 15 to 25 percent of gross sales at maturity and 20 to 35 percent in launch years, covering slotting, free fills, promotions, and displays. It is recorded as a reduction of gross sales and is routinely under-accrued, which is why so many beverage P&Ls look better on paper than in the bank.
is dtc or wholesale more profitable for a beverage brand?
It is not the slam dunk for DTC that founders assume. Wholesale contribution margin is often around 30 percent and DTC contribution runs roughly 20 to 30 percent once parcel shipping is loaded, and on a heavy product DTC shipping can quietly cost more than you charge for it. Map each channel by contribution dollars, not revenue, before you pick one.