
eCommerce
Canada Ecommerce AOV Benchmark 2026
Canada's general ecommerce AOV is about US$65 (~C$91) in mid-2026, but the actionable benchmark is your vertical band: apparel US$70-95, beauty US$55-75, supplements US$55-80, home goods US$50-75. Convert at 0.7155 CAD/USD and compare your trailing-90-day basket to your category median.
Key Takeaways
- Canada's general ecommerce AOV is about US$65 (~C$91) in mid-2026 (CEIC). It's the closest thing to a Canada-specific headline number, but the actionable cut is your vertical band, not the national average.
- Ecommerce is only 7.1% of Canadian retail trade ($5.1B in March 2026, StatCan), versus ~20.5% globally. A smaller online share means each order has to work harder.
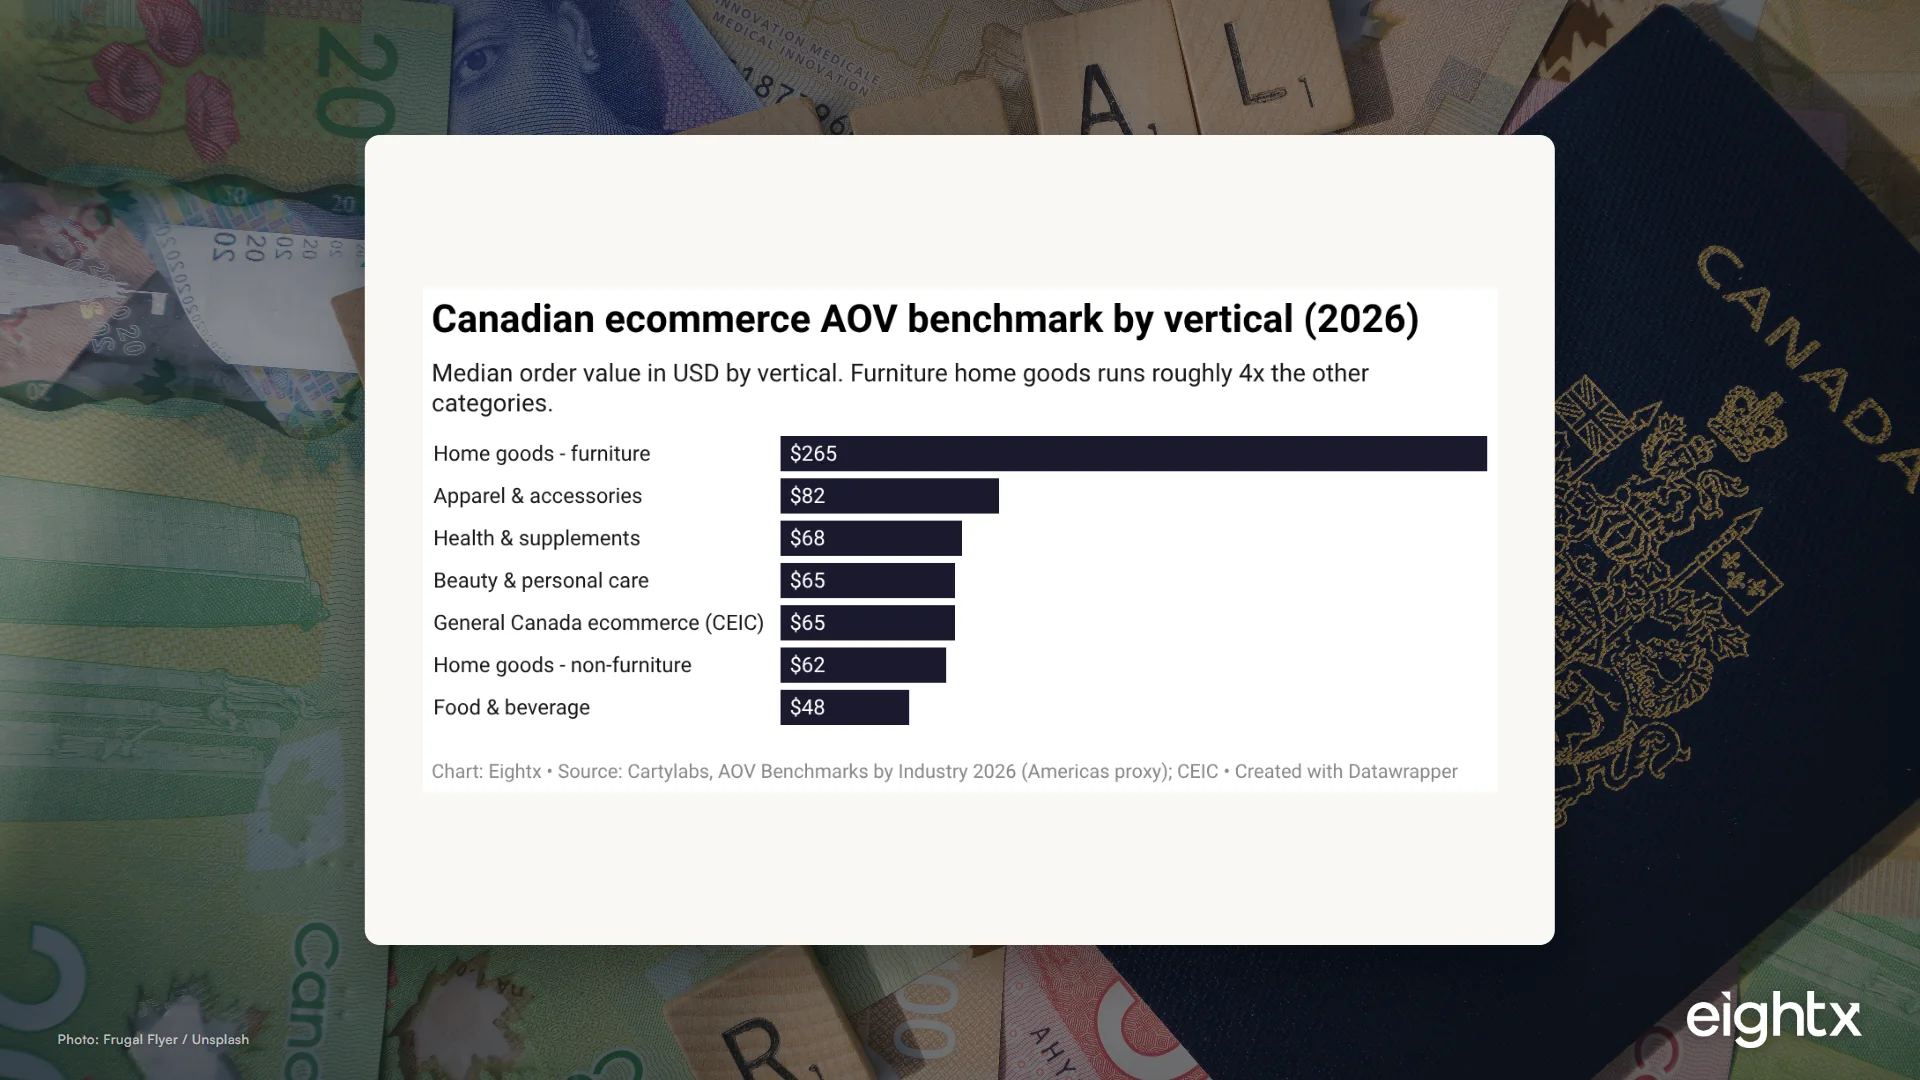
- Vertical median AOV bands (USD, 2026): apparel $70-95, beauty $55-75, supplements $55-80, home goods (non-furniture) $50-75, food & beverage $40-55. Furniture runs $180-350.
- A weak loonie is a hidden margin tax. CAD/USD bottomed near 0.69 in January 2025 and trades ~0.72 now, versus ~0.75 in early 2024. If you buy inventory in USD, that's a standing landed-cost headwind even when AOV holds flat.
- A well-set free-shipping threshold lifts AOV 15-25% (24.3% with a progress bar, Baymard). Best practice sets the threshold 20-30% above your current AOV.
If you run a Canadian DTC brand, the average order value (AOV, the average dollar amount a customer spends per order) is one of the few numbers you can move this quarter without spending more on ads. The hard part is knowing what to compare it to. The clean Canada-specific figures are scarce, the vendor benchmarks are quoted in US dollars, and a weak loonie quietly distorts both your reported basket size and your real margin. This post pulls the best available Canadian data together: Statistics Canada retail trade, Bank of Canada FX, and published vendor AOV bands, so you can place your number against your vertical and decide whether to act.
What the Canadian ecommerce AOV benchmark actually is in 2026
The single best Canada-wide number we can point to is about US$65 (roughly C$91) in mid-2026 (CEIC), at the ~0.7155 CAD/USD rate from the Bank of Canada on June 12, 2026. That is the general ecommerce AOV across every category, and it is genuinely Canada-specific rather than a noun-swapped US figure.
But treat it as a framing number, not a target. A clean, Canada-only AOV broken out by vertical does not exist in the open data. Statistics Canada publishes retail trade and ecommerce share, not per-order baskets; the Bank of Canada publishes FX and rates; and the vertical AOV bands come from vendor benchmarks (Cartylabs, CEIC) that are global or Americas proxies. So the honest picture is a blend: a real Canadian headline figure stitched to USD vertical bands you have to convert and contextualize.
When I talk to founders running $5M to $30M Canadian DTC brands, the first thing they want is a single number to beat. The more useful answer is almost always: forget the national average, find your vertical band, and ask whether you are at, above, or below the median tier. That is the cut that tells you what to do next.
One caveat to nail down before you compare anything: the vendor bands below are in USD. To compare like-for-like to a Canadian basket, divide the USD figure by ~0.7155 to get CAD, or multiply your CAD AOV by ~0.7155 to land in USD. US$65.21 / 0.7155 is about C$91.
AOV by vertical: where your apparel, beauty, supplements, and home-goods numbers should land
Here is the actionable cut. The median tier is where most healthy brands in each category sit; the top-25% and top-10% tiers show what the strongest baskets in each category look like.
Apparel leads the everyday verticals at a US$70-95 median, with supplements and beauty close behind and home-goods non-furniture in the same neighborhood. Furniture is the outlier: a US$180-350 median, roughly four times the other categories, because unit prices are high and orders are infrequent. Food and beverage sits lowest at US$40-55, which is structural, not a failure, since the category is high-frequency and low-ticket.
| Vertical | Bottom 25% | Median | Top 25% | Top 10% |
|---|---|---|---|---|
| Apparel & accessories | $50-70 | $70-95 | $100-140 | $140+ |
| Beauty & personal care | $35-55 | $55-75 | $80-115 | $115+ |
| Health & supplements | $30-55 | $55-80 | $90-130 | $130+ |
| Home goods (non-furniture) | $30-50 | $50-75 | $90-130 | $130+ |
| Home goods (furniture) | $120-180 | $180-350 | $350-500 | $500+ |
| Food & beverage | $25-40 | $40-55 | $60-90 | $90+ |
The pattern we see again and again: a brand convinced its AOV is weak is actually sitting right on its vertical median and just comparing itself to the wrong category. A C$95 apparel basket is not behind, it is dead-on the median once you convert. Find your row before you panic.
Why Canadian AOV runs below the US (and below global penetration)
Ecommerce is only 7.1% of total Canadian retail trade as of March 2026, about $5.1B seasonally adjusted, up from 7.0% in February and 5.7% in November 2025 (Statistics Canada, The Daily). Global ecommerce penetration runs around 20.5% (eMarketer/Shopify forecast). Canada sits well below.
That gap matters for AOV in a way that is easy to miss. A less-mature online channel means a larger share of high-consideration, big-basket purchases still happen in stores, so the online baskets that do land skew smaller. It also means your competitive set is thinner online, which is an opportunity, but it puts more weight on each order to carry its own acquisition cost. The macro backdrop is supportive: total Canadian retail sales hit $72.67B in March 2026, up 3.4% year-over-year (StatCan v1446859483), and with CPI up 2.8% over the same window, real retail growth is roughly 0.6%. Consumers are spending more dollars but barely more in real terms, so AOV gains have to come from basket engineering, not from a rising tide.
When we've seen brands misread this, it is usually by benchmarking against US Shopify averages (US$85-92, Littledata) and concluding they are failing. They are not. They are comparing a less-penetrated, smaller-basket market to a more-mature one. Benchmark Canada to Canada.
The hidden margin tax: a weak loonie on USD-priced inventory
This is the part of the AOV conversation that almost never shows up in a benchmark table, and it is the one that quietly costs the most. The Canadian dollar bottomed near 0.6924 on January 3, 2025, and trades around 0.7155 in June 2026, versus roughly 0.75 in early 2024 (Bank of Canada, FXCADUSD).
If you buy inventory priced in USD, as many Canadian DTC brands do, that move is a roughly 5% landed-cost headwind on every order versus two years ago. Your AOV can hold perfectly flat in CAD while your contribution margin per order erodes, because the cost side moved against you in a currency your customer never sees. The pattern we see again and again: a founder celebrates a stable or rising CAD AOV and cannot work out why cash is tighter. The answer is on the cost line, in USD.
The partial offset is the easing cycle. The Bank of Canada overnight rate fell from 5.00% in mid-2024 to 2.25% since October 30, 2025 (BoC V39079), a 275-basis-point easing that should support discretionary spend into 2026. And average weekly earnings reached $1,333.23 in March 2026, up 3.5% year-over-year (StatCan v54026327), ahead of the 2.8% CPI, so households have modest real income gains. That is a tailwind for basket sizes, but it does not undo the FX hit on your cost of goods. Model both.
| Indicator | Latest value | Period | YoY | Source |
|---|---|---|---|---|
| Total retail sales (SA) | $72.67B | 2026-03 | +3.4% | StatCan v1446859483 |
| Ecommerce share of retail | 7.1% | 2026-03 | n/a | StatCan 20-10-0056-01 |
| CPI all-items | 168.0 | 2026-04 | +2.8% | StatCan v41690973 |
| Avg weekly earnings | $1,333.23 | 2026-03 | +3.5% | StatCan v54026327 |
| CAD/USD | 0.7155 | 2026-06-12 | n/a | BoC FXCADUSD |
| BoC overnight rate | 2.25% | 2026-06 | -50bp | BoC V39079 |
The three levers that actually move AOV: free shipping threshold, bundling, upsell
If your AOV is below your vertical band, the fastest fix is almost never a price increase. It is a free-shipping threshold set just above your current basket, a bundle, and a single relevant upsell at checkout.
A well-set free-shipping threshold lifts AOV roughly 15-25%, and adding a cart progress bar that shows how close a shopper is to qualifying pushes the point estimate to about 24.3%, versus 17.8% for a bare threshold (Baymard). The average DTC free-shipping threshold is $59 in 2026, up 12% year-over-year. The rule that works: set your threshold about 20-30% above your current AOV. If your trailing-90-day AOV is C$90, a threshold near C$110-115 nudges one more item into the cart without feeling unreachable.
| Tactic | AOV uplift | Source |
|---|---|---|
| Free-shipping threshold (bare) | +17.8% | Shopify Plus / Baymard 2025 |
| Free-shipping threshold + progress bar | +24.3% | Baymard 2025 |
| Threshold set 20-30% above current AOV | +15-25% | Vendor "30% rule" 2026 |
| Shoppers who add items to qualify (lift among them) | +30% | Industry compilations 2024-26 |
When I talk to founders this size, the order of operations I push is: threshold first (cheapest to test, hardest to get wrong if you respect the 20-30% rule), then a two-item bundle priced just over the threshold, then a single post-purchase upsell. Only after those three have run for a full 90 days do I look at list price, because a weak loonie may already have eaten the margin room a price increase would otherwise create. Move basket size before you move price.
How to benchmark your own brand this quarter
The whole point of a benchmark is a decision, so here is the operator checklist:
- Pull your trailing-90-day AOV in CAD from your platform. Use 90 days, not last month, to smooth promo spikes.
- Convert to USD at ~0.7155 (multiply your CAD AOV by 0.7155) so it is comparable to the vendor bands above.
- Find your vertical row in the table and decide: bottom 25%, median, top 25%, or top 10%.
- If you are below your vertical median, set a free-shipping threshold 20-30% above your AOV, add a progress bar, and build one bundle priced just over the threshold.
- Separately, check your landed cost in CAD. If you buy in USD, model the FX headwind explicitly so you are not celebrating a flat AOV while contribution margin slips.
Your AOV benchmark is not the national C$91 average. It is your vertical band, converted to a common currency, with the FX headwind on your cost line modeled honestly. Get those two right and you will know exactly which lever, threshold, bundle, or upsell, to pull this quarter, before you spend another dollar on traffic.
For the cost side of the same picture, see our Canada ecommerce CAC benchmark, and to compare markets, the Australia ecommerce AOV benchmark. If you want a second set of eyes on the margin math, our interim CFO services start with exactly this kind of benchmark-and-act review.
Sources and methodology
This benchmark is built primarily on Canada's own national statistics, pulled directly via data tools with no fabricated figures, then triangulated against published vendor benchmarks for the vertical AOV cut that the open data does not provide.
Statistics Canada supplies the retail and macro backbone. Total retail sales come from Table 20-10-0056-01, vector v1446859483, seasonally adjusted: March 2026 reads $72,666,223 thousand, up 3.41% year-over-year from $70,269,650 thousand in March 2025. The ecommerce share of retail (7.1% in March 2026, $5.1B seasonally adjusted) is from the same table and the StatCan Daily release of May 22, 2026. CPI is all-items, vector v41690973, latest April 2026 at 168.0, up 2.81% year-over-year. Average weekly earnings are from Table 14-10-0220-01, vector v54026327, industrial aggregate including overtime, latest March 2026 at $1,333.23, up 3.50% year-over-year.
The Bank of Canada supplies FX and policy rates. CAD/USD is series FXCADUSD: the trough was 0.6924 on January 3, 2025, the latest reading 0.7155 on June 12, 2026, against roughly 0.7464 in early 2024. The overnight rate is series V39079, which stepped down from 5.00% through mid-2024 to 2.25% on October 30, 2025, held since.
The Canada-specific headline AOV (US$65.21, June 2026) is from CEIC, the closest available Canada-only ecommerce AOV aggregate. Vertical AOV bands are from Cartylabs, "AOV Benchmarks by Industry 2026" (May 2026), quoted in USD and applied to Canada as an Americas proxy because published Canada-by-vertical AOV is not openly available. Free-shipping threshold uplift figures are from Baymard (via easyappsecom 2026) and industry compilations.
A Storeleads geo cut of Canadian Shopify stores provides market-context only: 170,499 active Canadian Shopify stores, including 3,855 Shopify Plus, with vertical store counts led by apparel (33,977), home and garden (19,075), and beauty and fitness (15,702). Storeleads does not expose per-store or per-vertical AOV, so it is used here for geo store-count context, not for the AOV figures.
Two methodology caveats matter for how you read this. First, most vertical AOV figures are global or Americas proxies, not Canada-only prints, and are labeled as such. Second, the vendor bands are in USD; we state the FX rate and the CAD conversion so a Canadian operator can compare like-for-like. The StatCan 7.1% is a point-in-time monthly share and should not be conflated with the ~12% annual-average forecasts (ReportLinker) shown for context.
Frequently asked questions
what is a good average order value for canadian ecommerce brands in 2026?
There is no single good number. The general Canadian ecommerce AOV sits around US$65 (~C$91) in mid-2026, but that blends every category. The useful benchmark is your vertical band: apparel runs a US$70-95 median, beauty US$55-75, supplements US$55-80, home goods (non-furniture) US$50-75, and food & beverage US$40-55. Good means at or above your vertical's median, not above the national average.
what's the average aov for a shopify store in canada?
Published Shopify-specific AOV figures land in the US$85-92 range (Littledata), which sits a bit above the general Canadian ecommerce number because Shopify skews toward DTC brands with higher basket sizes than marketplaces. Treat that as a global proxy, not a Canada-only print, and always compare your own store to its vertical band rather than a platform-wide average.
how does canadian ecommerce aov compare by vertical - apparel vs beauty vs supplements vs home goods?
Apparel sits highest among the everyday verticals at a US$70-95 median, with supplements (US$55-80) and beauty (US$55-75) close behind, and home goods non-furniture around US$50-75. Furniture is the outlier at US$180-350 because the unit price is high and orders are infrequent. Food & beverage is lowest at US$40-55.
how does the cad/usd exchange rate affect average order value benchmarks for canadian dtc operators?
It affects your margin more than your AOV. Vendor benchmarks are quoted in USD, so a weaker loonie makes your CAD AOV look larger when converted, but if you buy inventory priced in USD, the same weak loonie raises your landed cost. CAD/USD fell from ~0.75 in early 2024 to ~0.72 now, so the same order carries roughly 5% more cost of goods than two years ago even when the basket size is flat.
does offering a free shipping threshold actually increase aov for canadian ecommerce stores?
Yes, consistently. A well-set free-shipping threshold lifts AOV roughly 15-25%, and adding a progress bar that shows shoppers how close they are pushes the uplift to about 24.3% (Baymard). The catch is setting it right: too low and you give away margin, too high and customers abandon.
where should i set my free shipping threshold relative to my aov?
Set it about 20-30% above your current AOV. If your trailing-90-day AOV is C$90, a threshold around C$110-115 nudges shoppers to add one more item without feeling out of reach. Pair it with a cart progress bar and a single recommended add-on near the threshold price to capture the lift.
is canadian ecommerce aov lower than us aov, and why?
Slightly, for two structural reasons. First, ecommerce is only about 7.1% of Canadian retail versus a higher online share in the US, so the channel is less mature and baskets skew smaller. Second, a weaker loonie means USD-denominated benchmarks convert to a higher CAD figure, which can mask a real gap. On a like-for-like basis, Canadian baskets tend to run a touch below comparable US verticals.
my aov is below my vertical benchmark - should i fix price, bundling, or upsell first?
Start with the free-shipping threshold and a bundle, not a price hike. A threshold set 20-30% above your AOV plus a two-item bundle priced just over the threshold moves basket size without touching unit price or risking conversion. Raise list price only after you have tested the threshold and confirmed your contribution margin per order, because a weak loonie may already be eating the room a price increase would create.