
eCommerce
Canada Ecommerce CAC Benchmark 2026: by vertical
No published Canada-only CAC benchmark exists, so use the North-America proxy and localize it: blended ecommerce CAC runs ~$68-$84 USD, food ~$45-$65, apparel ~$66-$120. Convert to CAD and add the loonie's premium, since US$1 of ad spend costs about C$1.39 at US$0.72.
Key Takeaways
- There is no published Canada-only CAC-by-vertical dataset. Every benchmark floating around is a global or North-America aggregate. The honest move is to use those ranges as a proxy and localize them, not pretend a Canadian number exists.
- Best-available CAC by vertical (North-America proxy, USD): food and beverage ~$45-$65, beauty ~$42-$80, apparel ~$66-$120, supplements ~$80-$130, home goods ~$45-$98. Blended ecommerce CAC clusters ~$68-$84.
- The loonie near US$0.72 is a hidden CAC tax. US$1 of Meta or Google spend costs about C$1.39, so a 'US$60' benchmark CAC is really ~C$84 for a Canadian brand buying USD-priced inventory.
- The Bank of Canada cut the overnight rate from 5.00% to 2.25%. Cheaper capital makes a longer CAC payback more survivable in 2026 than it was in 2024, even as ad costs keep rising.
- Ecommerce is only ~6% of Canadian retail trade (StatCan, Oct 2025). The market is smaller and less penetrated than the US, so paid auctions are thinner, not automatically cheaper.
Most of the CAC numbers a Canadian operator finds online are American numbers wearing a maple-leaf sticker. Customer acquisition cost (CAC, what you pay in marketing to land one new customer) is one of the most-searched ecommerce benchmarks, and almost none of the published figures are actually Canadian. So this post does two honest things at once: it gives you the best-available vertical CAC ranges and labels them clearly as North-America proxies, and it adds the Canadian layer the generic posts ignore, the exchange rate and rate-cut context that changes how you should read every one of those numbers.
There is no real Canada-only CAC benchmark, so localize the proxy
Start with the uncomfortable truth: there is no rigorous, published, Canada-only CAC-by-vertical dataset anywhere. Every benchmark in circulation, including the ones in this post, is a global or North-America aggregate. Vendors like First Page Sage and the analytics platforms publish blended ecommerce CAC and a vertical breakdown, but the underlying sample is overwhelmingly US-weighted. Pretending otherwise would be the noun-swap trick: take a US figure, change the flag, and call it a Canadian benchmark.
The useful response is not to throw the numbers out. It is to treat them as a proxy and localize. When I talk to founders running a Canadian brand in the $3M to $30M range, the mistake I see most is benchmarking their CAC against a US headline number in isolation, then panicking or relaxing for the wrong reason. The number on the screen is in USD, it ignores the loonie, and it ignores that the Bank of Canada has quietly changed what a given payback period costs you.
So the localization recipe, which the rest of this post walks through, is three moves: convert the benchmark to Canadian dollars, layer the FX premium onto the portion of your spend that is priced in USD, and then judge the result against your own margin, LTV:CAC, and payback rather than the headline. The vertical ranges below are the North-America benchmark this Canadian view is built on; everything Canada-specific is layered on top of them.
Average ecommerce CAC by vertical (the proxy you should actually use)
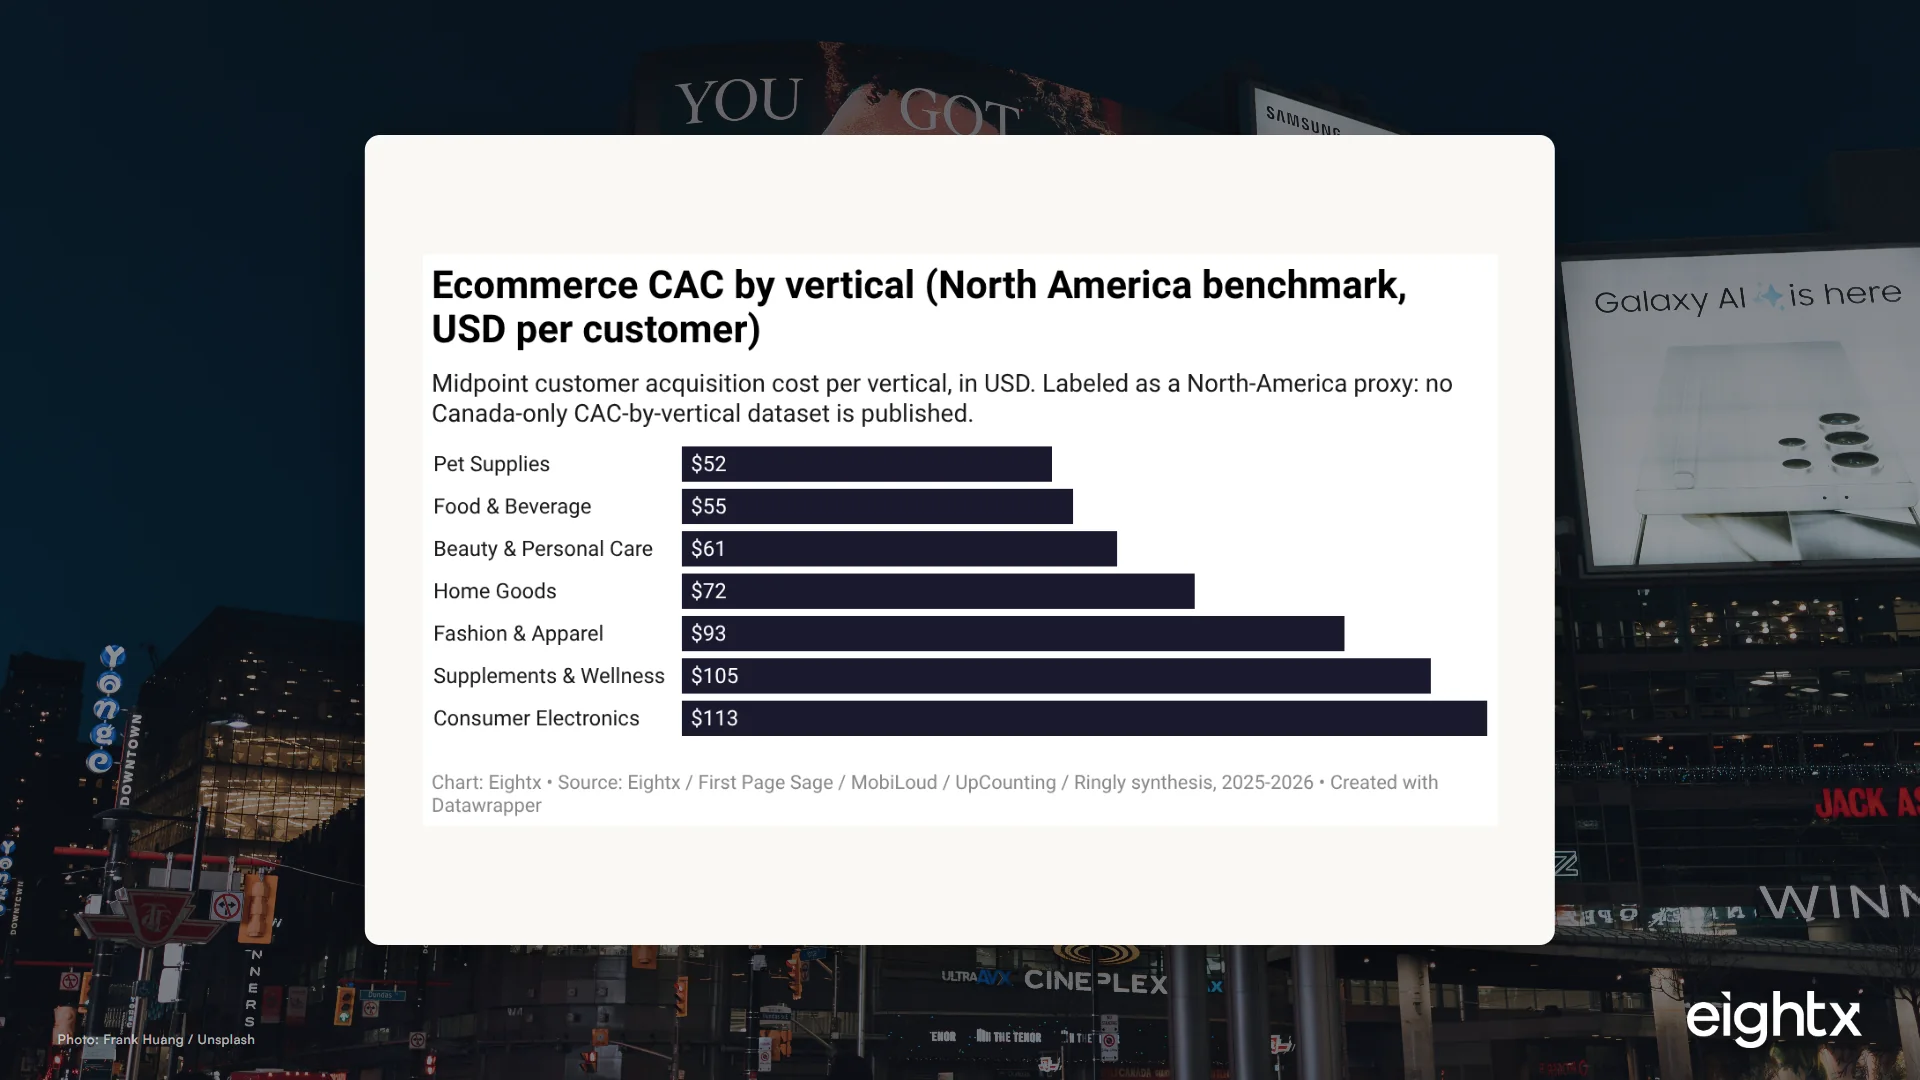
Here is the best-available vertical breakdown, in USD, as a North-America proxy. Food and beverage and beauty sit at the low end because intent is high and reorder frequency does a lot of the payback work. Apparel, supplements, and consumer electronics run highest, dragged up by discounting, returns, and longer consideration cycles. Blended across all of ecommerce, CAC clusters around $68 to $84, and one Shopify-wide fully-loaded figure runs as high as ~$318 (up about 16% year over year) once every cost, including overhead and discounts, is allocated rather than just paid media.
The table below carries the wider ranges and an indicative LTV:CAC for each vertical, which matters more than the point estimate. A $93 apparel CAC at 2.5:1 is a very different business from a $55 food CAC at 4.5:1, even though both look like normal ecommerce.
| Vertical | Avg CAC (USD) | Typical range (USD) | Indicative LTV:CAC |
|---|---|---|---|
| Food & Beverage | $53 | $25-$80 | ~4.5:1 |
| Beauty & Personal Care | $61 | $28-$120 | ~3.2:1 |
| Pet Supplies | $52 | $30-$90 | ~3.8:1 |
| Home & Lifestyle | $72 | $45-$300 | ~3:1 |
| Fashion & Apparel | $93 | $32-$250 | ~2.5:1 |
| Supplements & Wellness | $105 | $80-$130 | ~3:1 |
| Consumer Electronics | $85 | $35-$150 | ~2.1:1 |
The pattern we see again and again is that operators anchor on the average and ignore the range. The range is the point. If your supplements brand is at $130 CAC you are at the top of the band, not broken, but you have no room for an FX surprise or a payback period that drifts past three months. Knowing where you sit in the spread is what turns a benchmark into a decision.
The loonie is a hidden CAC tax
This is the section the US posts cannot write, and it is the one that actually changes Canadian decisions. As of June 10, 2026, one Canadian dollar buys about US$0.7179. Flip that around and US$1 of Meta or Google inventory costs roughly C$1.39. So a benchmark that reads "$60 USD CAC" is not $60 of your money. It is about C$84 before the ad auction even clears.
Every USD figure in the vertical table inflates by roughly 39% once it lands in your CAD-denominated P&L, assuming the spend is priced in USD. That is the catch worth being precise about: the premium only applies to the portion of spend actually billed in US dollars. Meta and Google inventory, most US-based influencer and affiliate deals, and USD SaaS all carry it. Domestic CAD-billed channels, organic, email, and SMS do not. When we have worked through this with a brand selling mostly into Canada, the realistic blended premium often lands closer to 25% to 30% than the full 39%, because a chunk of acquisition is not USD-priced at all. The discipline is to apply the FX tax line by line, not to your whole CAC number.
A "$60 USD" benchmark CAC is about C$84 for a Canadian brand buying USD-priced ad inventory. The loonie does not change your strategy, but it changes your math. Benchmark in the currency you actually spend, not the one the report was written in.
There is a second-order cost here too. Payment processing on USD invoices often carries a conversion fee on top of standard rates, so the FX hit is not only on media. The operator move is to bill and get paid in the same currency you spend wherever you can, and to use multi-currency payout tools so you are not round-tripping through a forced conversion on every transaction.
The macro backdrop: rate cuts versus the exchange rate
Two Canadian macro forces are pulling in opposite directions, and an operator should hold both. The Bank of Canada cut its overnight rate from 5.00% in early 2024 to 2.25%, held since October 2025. That roughly halved the cost of the capital that finances your CAC payback and your inventory. Meanwhile the loonie drifted near US$0.72, keeping that persistent premium on USD-priced ad spend.
The practical read is that payback math got more forgiving even as ad costs rose. A 90-day CAC payback that strained your cash in 2024 is materially cheaper to carry in 2026 at half the borrowing cost. That does not make your CAC lower. It makes a higher CAC more survivable, which is a different and more useful thing to know when you are deciding whether to push spend.
For context on market size: Statistics Canada reported retail ecommerce sales of $4.1B in October 2025, about 6.0% of total retail trade, easing to $4.0B and 5.7% in November. Total retail trade is running near $72.7B a month (seasonally adjusted, March 2026). Canada is a smaller, less ecommerce-penetrated market than the US, so paid auctions are thinner but not automatically cheaper. The Storeleads geo cut shows about 170,499 Canadian Shopify stores, with roughly 21,625 of them running Klaviyo, a rough proxy for how many brands have invested in the retention and data tooling that usually comes with tracking CAC and LTV seriously. If you are reading this and tracking the metric at all, you are already ahead of most of the market.
What "good" looks like: LTV:CAC, payback, and channel mix
A CAC number means nothing on its own. It only means something against lifetime value and payback. The targets are the same in Canada as anywhere: aim for LTV:CAC of at least 3:1 and a payback period of one to three months. Below 3:1 you are buying revenue you cannot fund. Far above it, you are usually under-spending and leaving growth on the table.
Channel mix is where the CAC number actually gets built, so plan media against a channel ladder, not a single blended figure.
| Channel | Low CAC (USD) | High CAC (USD) | Median (USD) |
|---|---|---|---|
| Google brand terms | $4 | $18 | $11 |
| Meta retargeting | $12 | $40 | $26 |
| Meta prospecting | $35 | $120 | $68 |
| Google non-brand | $40 | $140 | $72 |
The cheapest "CAC" on that ladder, brand terms, is mostly harvesting demand you already created, so do not confuse it with new-customer acquisition. Prospecting is where you actually pay to grow, and where the FX premium bites hardest because it is almost entirely USD-priced. When I talk to founders this size, the ones with healthy unit economics are not the ones with the lowest blended CAC. They are the ones who know which channels are creating demand versus harvesting it, and who fund prospecting deliberately instead of hiding behind a flattering blended average. Always read CAC next to LTV by vertical, because CAC without LTV is half a number.
How to benchmark your own CAC against this (operator checklist)
Five steps to turn these proxies into a real read on your own brand.
1. Convert the benchmark to CAD first. Take the USD vertical figure and divide by ~0.72 (roughly multiply by 1.39) so you are comparing in the currency your P&L is actually in. A US$93 apparel benchmark is about C$130.
2. Apply the FX premium line by line, not to the whole number. Only USD-billed spend carries the loonie tax. Split your channels into USD-priced (Meta, Google, most US influencer and affiliate) and CAD-priced (domestic media, organic, email, SMS), and inflate only the first bucket.
3. Judge against your margin, not the headline. A C$130 apparel CAC is fine at a 65% gross margin and a $180 AOV, and a problem at a 40% margin. The benchmark tells you where you sit in the market; your margin tells you whether you can afford it.
4. Check payback, then check the rate environment. Aim for one to three months. Then remember the cost of carrying that payback is roughly half what it was in 2024, so a payback that felt scary then may be acceptable now.
5. Re-localize every quarter. The CAD/USD rate moved enough in 2025 alone (a roughly 7% swing) to change effective CAC without you touching a campaign. Re-run the conversion when the loonie moves, not just when your CAC does. CAC is one input; judge it alongside the rest of your Canadian metric set rather than in isolation.
Sources and methodology
The vertical and channel CAC figures are a synthesis of vendor-published benchmarks (Eightx, First Page Sage, and UpCounting) gathered and cross-checked through a triangulation layer in 2025 and 2026. These are global and North-America aggregates, not Canada-specific. We label them as a proxy throughout because no rigorous Canada-only CAC-by-vertical dataset is published anywhere, and that absence is itself a finding operators should know about.
The Canadian macro layer comes from primary sources. Total retail trade and its trend are from Statistics Canada Table 20-10-0056-01 (vector v1446859483), seasonally adjusted monthly, January 2023 through March 2026. The ecommerce share, $4.1B and 6.0% in October 2025, comes from the most recent Statistics Canada releases in The Daily, because the dedicated ecommerce-share table (20-10-0072-01) is marked inactive. We cite The Daily rather than the inactive table.
The exchange-rate work uses Bank of Canada daily CAD/USD data (FXCADUSD), with the latest reading of 0.7179 on June 10, 2026. The effective cost of US$1 in Canadian dollars (about C$1.39) is the inverse of that rate. The FX conversion to CAD is our localization step, not a vendor figure: the underlying CAC numbers are published in USD, and we divide by the CAD/USD rate to express them in Canadian dollars.
The interest-rate path is the Bank of Canada overnight rate target (series V39079), which moved from 5.00% in early 2024 down through a series of cuts to 2.25%, held since October 2025. We use it to frame the cost of financing CAC payback, not as a direct input to any CAC figure.
The store-count context comes from a Storeleads geo cut filtered to Canada, retrieved June 11, 2026: about 170,499 Shopify stores, 74,224 WooCommerce, and 21,625 Canadian Shopify stores running Klaviyo. The count endpoint returns reliable totals but did not return per-store sales or visit fields in this run, so we use the counts as a market-maturity proxy only, not for any revenue aggregation.
A note on limitations: CAC is notoriously inconsistent across sources because of what each one loads into the number (paid media only versus fully allocated). Treat every figure here as a range and an order of magnitude, not a precise target, and weight your own measured CAC over any benchmark when the two disagree.
Frequently asked questions
what is the average customer acquisition cost for ecommerce brands in canada?
There is no published Canada-only figure, so the honest answer is a North-America proxy: blended ecommerce CAC clusters around $68 to $84 USD, with wide spread by vertical (food and beverage ~$45 to $65, apparel ~$66 to $120, supplements ~$80 to $130). Convert to CAD and a $68 USD blended number is roughly C$95.
how does cac differ by vertical for canadian dtc and cpg brands?
A lot. Food, beverage, and beauty sit at the low end ($42 to $80 USD) because purchase intent is high and order frequency helps payback. Apparel, supplements, and consumer electronics run highest ($80 to $150 USD) on heavier discounting, returns, or considered purchases. Your vertical sets your starting expectation before any of your own execution.
what is a good ltv to cac ratio for a canadian ecommerce brand?
The same 3:1 rule holds in Canada as everywhere else: aim for lifetime value at least three times CAC, with one to three months of payback. Below 3:1 you are buying revenue you cannot fund; well above it you are probably under-spending and leaving growth on the table.
how does the cad/usd exchange rate affect ecommerce cac in canada vs the us?
If you buy ads priced in USD and earn revenue in CAD, the exchange rate is a direct tax on CAC. At US$0.72, every US$1 of ad spend costs about C$1.39, so a US$60 benchmark CAC is really about C$84 of your money. US operators never pay this premium, which is why you cannot read a US headline number at face value.
why is there no canada-specific cac benchmark and can i just use us numbers?
Canada is too small a market for vendors to publish a clean vertical CAC dataset, so what circulates is global or North-America aggregate. You can use US numbers as a starting proxy, but you have to localize them: convert to CAD and add the FX premium on any USD-priced ad spend before you judge your own performance.
how do bank of canada rate cuts change what cac i can afford?
The overnight rate fell from 5.00% to 2.25%, which roughly halved the cost of the capital that finances your CAC payback and inventory. That does not lower your CAC, but it makes a longer payback survivable. A 90-day payback that strained cash in 2024 is more affordable in 2026 at half the borrowing cost.
how much of canadian retail is actually ecommerce?
About 6.0% of total retail trade as of October 2025, roughly $4.1B CAD in a month where total retail ran near $72.7B. That is a smaller, less-penetrated market than the US, so paid auctions are thinner but not automatically cheaper.
how do i convert a us cac benchmark into a real canadian number?
Two steps. First, divide the USD figure by the CAD/USD rate (about 0.72) to get the CAD equivalent, which is roughly multiplying by 1.39. Second, only apply that premium to spend that is actually priced in USD: domestic CAD-billed channels and organic do not carry the FX tax.
Related Eightx benchmarks: Canada ecommerce KPI benchmark 2026: AOV, CAC, conversion and return rate by vertical and Average Canadian ecommerce margin by vertical (2026): Aritzia, Lululemon, Roots and StatCan benchmarks. For hands-on help with your numbers, talk to our fractional CFO team.