
Insights
Consumer Electronics Financial Benchmarks 2026
A healthy consumer-electronics ecommerce brand in 2026 runs a 33-45% gross margin, a roughly $76 CAC against a ~$260 average order value, a ~10% return rate, and 3.5x or better inventory turns. The public comps prove unit economics, not topline growth, decide survival in this thin-margin vertical.
Key Takeaways
- Median gross margin across six public consumer-electronics comps is 43.4% (latest 10-K), ranging from GoPro's 33.6% to Garmin's 58.7%. A single-category DTC brand should underwrite to the low end of that, not the diversified-public median.
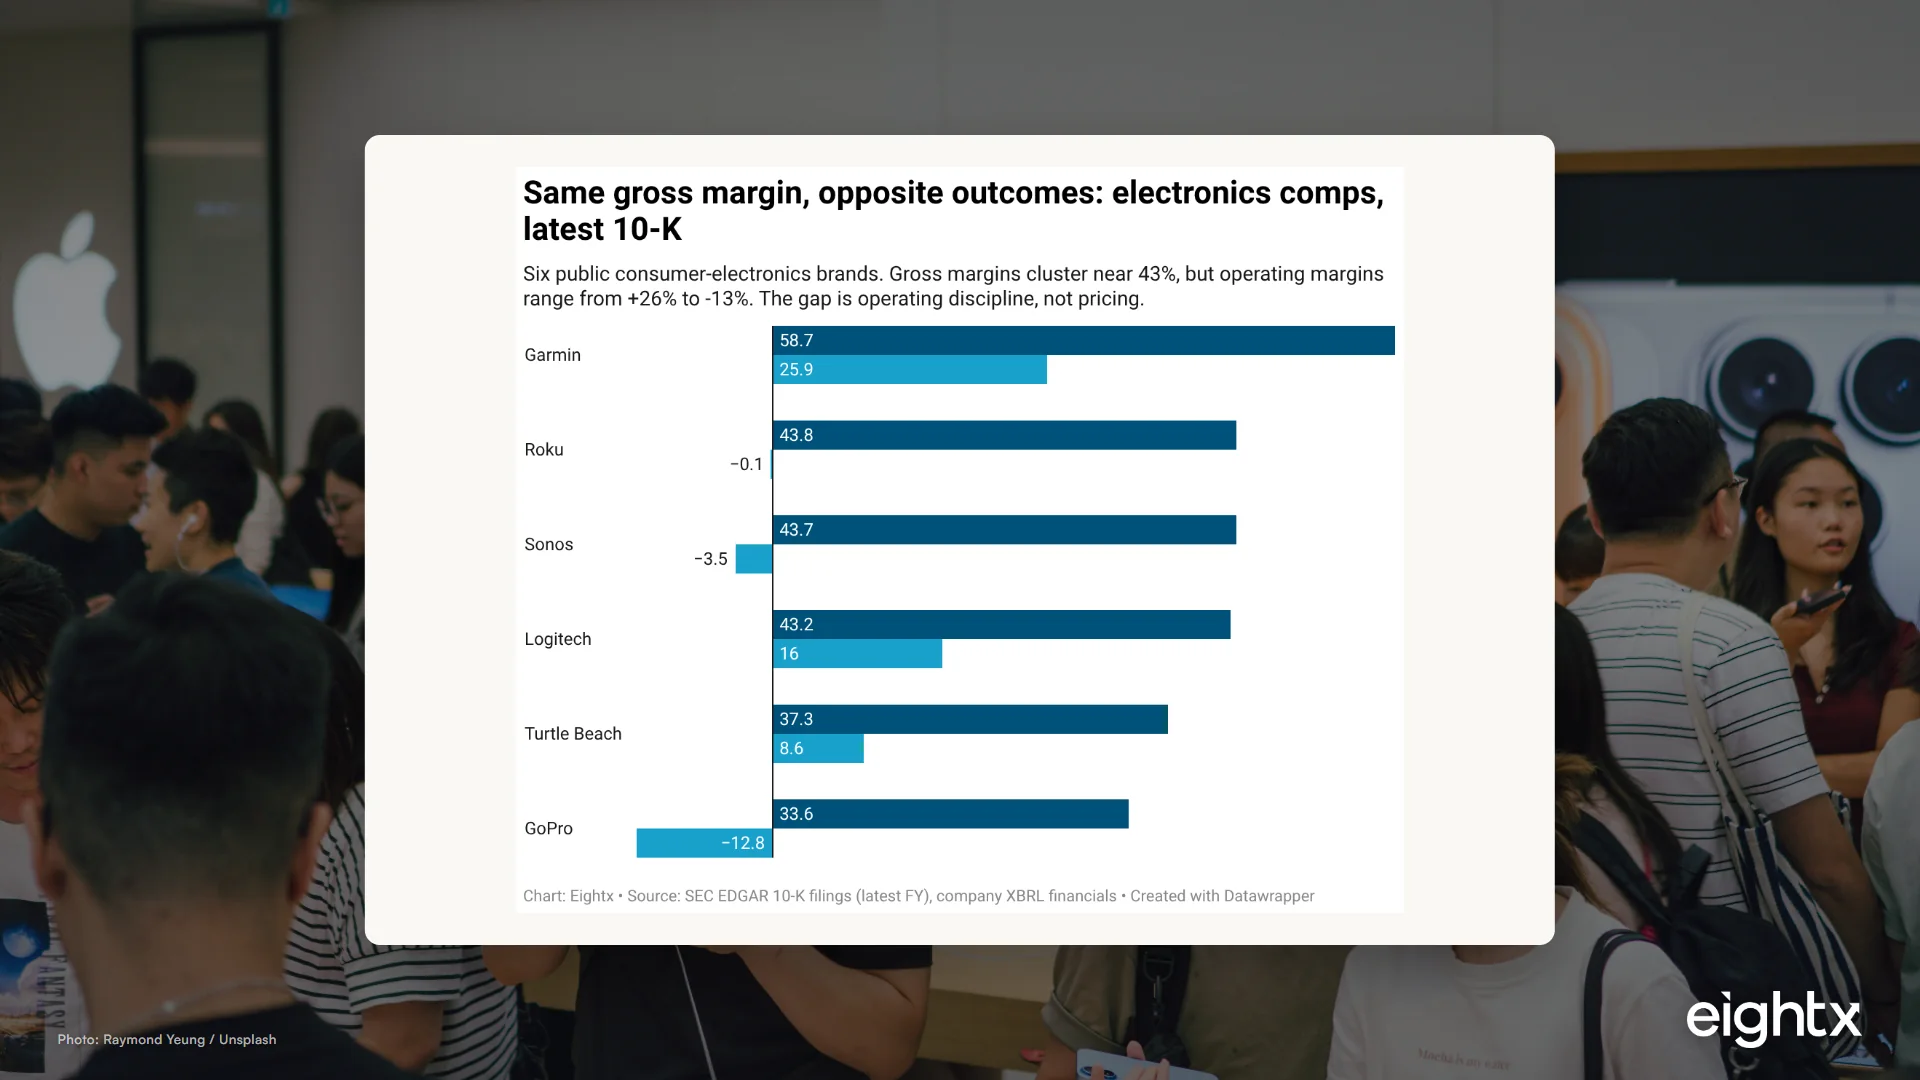
- Operating margins swing from +26% to -13% on nearly identical gross margins. Sonos and Logitech both run ~43% gross margin yet sit ~19 points apart on operating margin. In electronics the P&L is decided below the gross-margin line.
- Average CAC is ~$76 per customer (FirstPageSage 2026), one of the highest of any ecommerce vertical, and reportedly up ~40% year-over-year as paid-media efficiency erodes (Yotpo 2026).
- Online return rate is ~10% (smart-home devices ~13%) versus ~19.5% for all-ecommerce. Lower than apparel, but on a 35% gross margin each return is a bigger share of profit than the rate suggests.
- Hardware-pure inventory turnover runs ~3.5x a year, roughly 100+ days of stock. In a category where products go obsolete, that days-on-hand number is a cash-and-write-down risk, not just a working-capital line.
Consumer electronics is the hardest vertical in ecommerce to run profitably. Gross margins sit 15 to 25 points below beauty or apparel, customer acquisition (CAC, the all-in cost to win one customer) is among the most expensive on any platform, and rapid obsolescence punishes anyone carrying too much stock. This report aggregates the numbers operators are actually working against in 2026: six public consumer-electronics comps from their latest SEC 10-K filings, the Storeleads census of ~123,000 active electronics storefronts, and triangulated DTC benchmarks for CAC, AOV (average order value), return rate, and LTV:CAC (lifetime value to acquisition cost). Use it to grade your own P&L.
The electronics margin problem in one chart
Here is the single most important fact in this report: six public consumer-electronics brands run nearly the same gross margin and land on wildly different operating margins. Garmin clears +25.9% operating margin and Logitech +16.0%, while GoPro sits at -12.8%, Sonos at -3.5%, and Roku at -0.1%. Sonos and Logitech both run roughly 43% gross margin yet sit about 19 points apart at the operating line. That gap is not pricing. It is operating discipline: opex, CAC, and how tightly the model is run below the gross-margin line.
This is the thing to internalize before you read another benchmark. In a 60-70% gross-margin category like beauty, you can absorb a lot of operating slop and still print a profit. In electronics, where you start with 40-something points of gross margin, every point of CAC inefficiency or returns leakage or excess inventory comes straight out of a thin cushion. When I talk to founders running an electronics brand in the $10M to $50M range, the pattern is almost always the same: the gross margin is fine, and the operating margin is bleeding out somewhere they have not instrumented yet.
Gross margin: what "good" looks like, and why it's lower here
The median gross margin across the six comps is 43.4%, ranging from GoPro at 33.6% to Garmin at 58.7%. But the high end is misleading for a DTC operator. Garmin's 58.7% reflects aviation, marine, and fitness segments with software and subscription attach. Logitech's 43.2% rides on a broad accessory catalog. A single-category, pure-hardware DTC brand does not have that mix, so it should underwrite to the lower band, call it 33-42%, and treat anything above 45% as evidence of real accessory or software attach rather than device pricing alone.
The three-year trend matters too: GoPro has been roughly flat in the low 30s, Turtle Beach has climbed from 29% to 37%, and Garmin has held near 58%. A rising gross margin in this category usually means a brand is shifting mix toward higher-margin accessories or software, not raising device prices, because device pricing is capped by spec-and-price competition. Tariffs and import costs press directly on COGS here in a way they do not in apparel; for how that flows through, see our electronics import tariff map for 2026.
| Company | Ticker | Revenue ($M) | Gross margin % | Operating margin % | Inventory turns (x/yr) | R&D % of revenue | Fiscal year |
|---|---|---|---|---|---|---|---|
| Garmin | GRMN | 7,246 | 58.7 | 25.9 | 2.0 | 15.5 | FY2025 |
| Logitech | LOGI | 4,841 | 43.2 | 16.0 | 5.6 | 6.5 | FY2026 (Mar) |
| Roku | ROKU | 4,737 | 43.8 | -0.1 | 16.8 | 15.4 | FY2025 |
| Sonos | SONO | 1,443 | 43.7 | -3.5 | 3.5 | 19.4 | FY2025 (Sep) |
| GoPro | GPRO | 652 | 33.6 | -12.8 | 3.6 | 19.5 | FY2025 |
| Turtle Beach | TBCH | 320 | 37.3 | 8.6 | 2.8 | 5.3 | FY2025 |
CAC, AOV, and the LTV:CAC math
This is where electronics brands live or die. Average CAC for the sector is about $76 per customer (FirstPageSage 2026), one of the highest of any ecommerce vertical, and 2026 reports flag CAC up roughly 40% year-over-year across ecommerce as paid-media efficiency keeps eroding. The structural offset is a high average order value: around $260 globally, with DTC carts running $80-130 when they are accessory-heavy and $180-300+ when they carry a core device.
Now walk the math. The 2026 healthy LTV:CAC benchmark is 3:1, with a cross-vertical median near 3.4:1. At a $76 CAC, 3:1 implies you need roughly $228 of lifetime contribution per customer. On a one-and-done device purchase at a 35% gross margin (the low end of the band a pure-hardware brand should plan for), a single $260 order throws off about $91 of gross contribution, barely more than the $76 it cost to acquire the customer and nowhere near the $228 the 3:1 bar demands. That is the whole problem in one line: the hero product alone rarely clears the bar. The brands that hit 3:1 do it on the second, third, and fourth purchase, accessories, warranties, and consumables.
When we work with electronics operators on this, the move that changes the model is rarely a CAC cut. It is attach. The pattern we see again and again is that a brand obsessing over shaving $76 down to $60 would do far better building a $40 accessory that 30% of buyers add, because that accessory carries a much fatter margin and needs no new acquisition spend. One brand we worked through this with had been treating their bundle attach as a merchandising afterthought; once it became a tracked unit-economics lever, their blended contribution per customer moved more than any ad-account optimization had.
Returns: smaller than apparel, but they hurt more
Consumer-electronics online return rates run about 10%, with smart-home devices closer to 13% (McKinsey 2026), versus roughly 19.5% for all-ecommerce. So on the surface electronics looks better than the average and far better than apparel. The catch is margin. A return on a 60% gross-margin beauty product is annoying; a return on a 35% gross-margin device is a profit event.
Here is why. When a $260 device comes back, you lose the gross margin on that sale, you eat reverse-logistics cost, and you often cannot resell the unit as new, so it goes to a refurb or open-box channel at a discount. On a thin margin, one return can wipe out the contribution from several clean sales. That is why a 10% return rate in electronics is not "half as bad" as apparel's 20%; relative to the margin you are protecting, it can be just as expensive.
When I talk to founders this size, returns are the line they consistently under-instrument. They know the rate, but they have never multiplied it by the fully-loaded cost per return, so they do not realize a 2-point reduction in return rate is often worth more than a 10% lift in ad efficiency. Fixing sizing-equivalent issues (clearer specs, better unboxing instructions, proactive setup support) is some of the highest-ROI work an electronics brand can do, and almost none of it shows up in a media dashboard.
Inventory turns and the obsolescence clock
The hardware-pure comps turn inventory about 3.5x a year, which is roughly 100+ days of stock on hand. Logitech leads at 5.6x, Garmin turns just 2.0x on its diversified catalog, and the cluster sits in between. Roku's 16.8x is excluded from the hardware median because it is a platform and advertising business that carries almost no device inventory; including it would flatter the picture.
In a category where products go obsolete, days-on-hand is not just a working-capital line, it is a write-down risk. Every extra week of stock is a week closer to the next model shipping and your current units losing value. For a smaller DTC brand without Garmin's balance sheet, the cash-conversion hit compounds the obsolescence hit: cash is trapped in stock that is quietly depreciating. When we've struggled with this alongside operators, the brands in real trouble were the ones sitting at 140-180 days who had been managing inventory on a quarterly cadence instead of a monthly one. Aim for 4-6x turns on fast movers, and watch days-on-hand monthly on anything with a product cycle.
The benchmark scorecard: are your numbers healthy?
Pull your own P&L and grade it against the table below. This is the self-assessment the whole report points to: in electronics the margin is thin enough that the unit economics, CAC payback, return rate, and inventory turns, decide whether you survive, not topline growth.
| Metric | Electronics benchmark | All-ecommerce context | Source |
|---|---|---|---|
| Gross margin | 33-45% (43% comp median) | 50-70% beauty/apparel | SEC comps / Shopify |
| Online return rate | ~10% (smart-home ~13%) | ~19.5% all categories | Capital One / McKinsey 2026 |
| Average CAC | ~$76 | ~$20-60 mid-ticket | FirstPageSage 2026 |
| Average order value | ~$260 | $50-150 many verticals | Ecommerce Foundation 2026 |
| LTV:CAC | 3:1 healthy minimum | 3.4:1 cross-vertical median | Yotpo 2026 |
| Inventory turnover | 3.5x hardware median | 6.5x big-box retail | SEC comps / CSI Market |
The Storeleads census frames who is competing here: about 54,800 active Consumer Electronics storefronts on Shopify (123,100 across all platforms), of which only ~2.7% are on Shopify Plus. That is a very long tail of sub-scale brands competing against the public names above. Most of them are working with the lower-band margins, not Garmin's. If your numbers beat the benchmark column, you have a defensible model; if two or more are below, that is where a fractional CFO earns their fee before you scale spend into a leaky funnel.
In electronics, the gross margin tells you almost nothing about whether the business works. Six public brands run roughly 43% gross margin and land anywhere from +26% to -13% at the operating line. The number that decides your fate is below the gross-margin line: CAC payback, return cost, and how many days your cash sits in depreciating stock. Grade those three before you grade your topline.
Sources and methodology
Primary, SEC EDGAR. Latest 10-K financials were pulled for six public consumer-electronics comps: GoPro (CIK 1500435, FY2025), Sonos (CIK 1314727, FY2025 Sep year-end), Garmin (CIK 1121788, FY2025), Logitech (CIK 1032975, FY2026 Mar year-end), Turtle Beach (CIK 1493761, ticker TBCH, FY2025), and Roku (CIK 1428439, FY2025). Gross margin is gross profit divided by revenue, operating margin is operating income divided by revenue, inventory turnover is cost of revenue divided by ending inventory, and R&D% is R&D divided by revenue.
The Roku caveat. Roku is a legitimate public consumer-electronics filer, but its economics are platform and advertising driven, with very low device inventory and a 16.8x inventory turn. We include it in the comps table for context and exclude it from the hardware-pure inventory-turn median (3.5x). Note also that the ticker HEAR resolves to a medical-device filer in EDGAR, not Turtle Beach, which trades as TBCH; we used TBCH.
Fiscal-year mismatch. The six comps have different fiscal year-ends (calendar, September, and March), so cross-comp comparisons are latest-fiscal-year snapshots, not identical periods. For a category benchmark this is acceptable; for a precise peer comparison you would normalize to a trailing-twelve-month basis with quarterly pulls.
Storeleads category census. Consumer Electronics counts were pulled from Storeleads for the /Consumer Electronics category: 123,132 storefronts across all platforms, 54,807 on Shopify, 1,504 on Shopify Plus (2.7% of Shopify electronics), and 15,310 in the US (28%). Category counts are the reliable aggregate; per-store sales and visit estimates were not available at this API tier.
DTC benchmark triangulation. The CAC, AOV, return-rate, and LTV:CAC figures are not SEC-grade primary data; they are clearly-labeled benchmark-report figures, triangulated across Perplexity and Parallel.ai from FirstPageSage 2026 (CAC ~$76), Ecommerce Foundation 2026 (AOV ~$260), McKinsey 2026 (return rate ~9.7-11%, smart-home ~13.2%; all-ecommerce ~19-20% per NRF/Happy Returns), Yotpo 2026 (LTV:CAC 3:1 benchmark, 3.4:1 cross-vertical median), and CSI Market 2024 (big-box electronics inventory turnover ~6.54x). The brief's matrix explicitly calls for both SEC comps and benchmark-report figures in this report.
Frequently asked questions
what is a good gross margin for a consumer electronics dtc brand?
The public comps median is 43.4%, but the profitable diversified names (Garmin, Logitech) carry software and accessory mix that a single-category hardware brand does not. For a pure-hardware DTC electronics brand, underwrite to roughly 33-42% and treat anything above 45% as a sign you have real accessory or software attach, not just device pricing.
what is the average cac for a consumer electronics ecommerce brand in 2026?
About $76 per customer (FirstPageSage 2026), which is one of the highest of any ecommerce vertical, and 2026 reports flag it up roughly 40% year-over-year. The offset is a high average order value (~$260), but only if your first order actually carries that ticket. Accessory-heavy carts with $80-130 AOVs make a $76 CAC very hard to pay back on the first purchase.
what return rate should i budget for a consumer electronics brand?
Budget around 10% for general consumer electronics and closer to 13% for smart-home devices. That is lower than apparel or the ~19.5% all-ecommerce average, but on a 35% gross margin a 10% return rate eats a much larger share of your profit than the headline number suggests, because you lose the margin plus the reverse-logistics and refurb cost.
how does ltv:cac benchmark for electronics vs other ecommerce verticals?
The healthy minimum is the same 3:1 everyone targets, with a cross-vertical median near 3.4:1. The problem in electronics is hitting it. At a $76 CAC you need roughly $228 of lifetime contribution, which is hard on a one-and-done device purchase. Brands that clear the bar do it on accessories, warranties, and consumables, not the hero product.
what inventory turnover should a consumer electronics brand target to avoid obsolescence?
The hardware-pure public comps cluster around 3.5x a year, roughly 100+ days of stock. For a smaller DTC brand without a diversified balance sheet, aim for 4-6x on your fast movers and watch days-on-hand on anything with a product cycle, because in electronics slow stock does not just tie up cash, it loses value as newer models land.
why are consumer electronics margins lower than apparel or beauty?
Three structural reasons: the bill of materials is a bigger share of price (components, batteries, displays), tariffs and import costs land directly on COGS, and the category competes on spec-and-price in a way apparel and beauty do not. Beauty and apparel routinely run 50-70% gross margin; electronics rarely clears 45% without a software or accessory mix.
how do public electronics companies like garmin make money if margins are thin?
Garmin is the exception, not the rule. Its 58.7% gross margin reflects aviation, marine and fitness segments with software and subscription attach, not pure consumer hardware. The lesson for a DTC brand is that the profitable public names earn their margin on mix and software, so if you are pure hardware you should plan for the lower band and find your own attach revenue.
how many days of inventory is too many for an electronics brand?
Past about 120 days you are in the danger zone for anything with a product cycle. At 3.5x turns you are already sitting near 100+ days, and we have seen brands at 140-180 days of stock take real write-downs when the next model shipped. The cash-conversion hit compounds the obsolescence risk, so days-on-hand is the metric to watch monthly, not quarterly.
Related Eightx benchmarks: Ecommerce tech stack cost as % of revenue and 2026 eCommerce KPI Benchmark Report (SEC 10-K Data).