
Supply Chain
Electronics and Accessories Import Tariff Map 2026
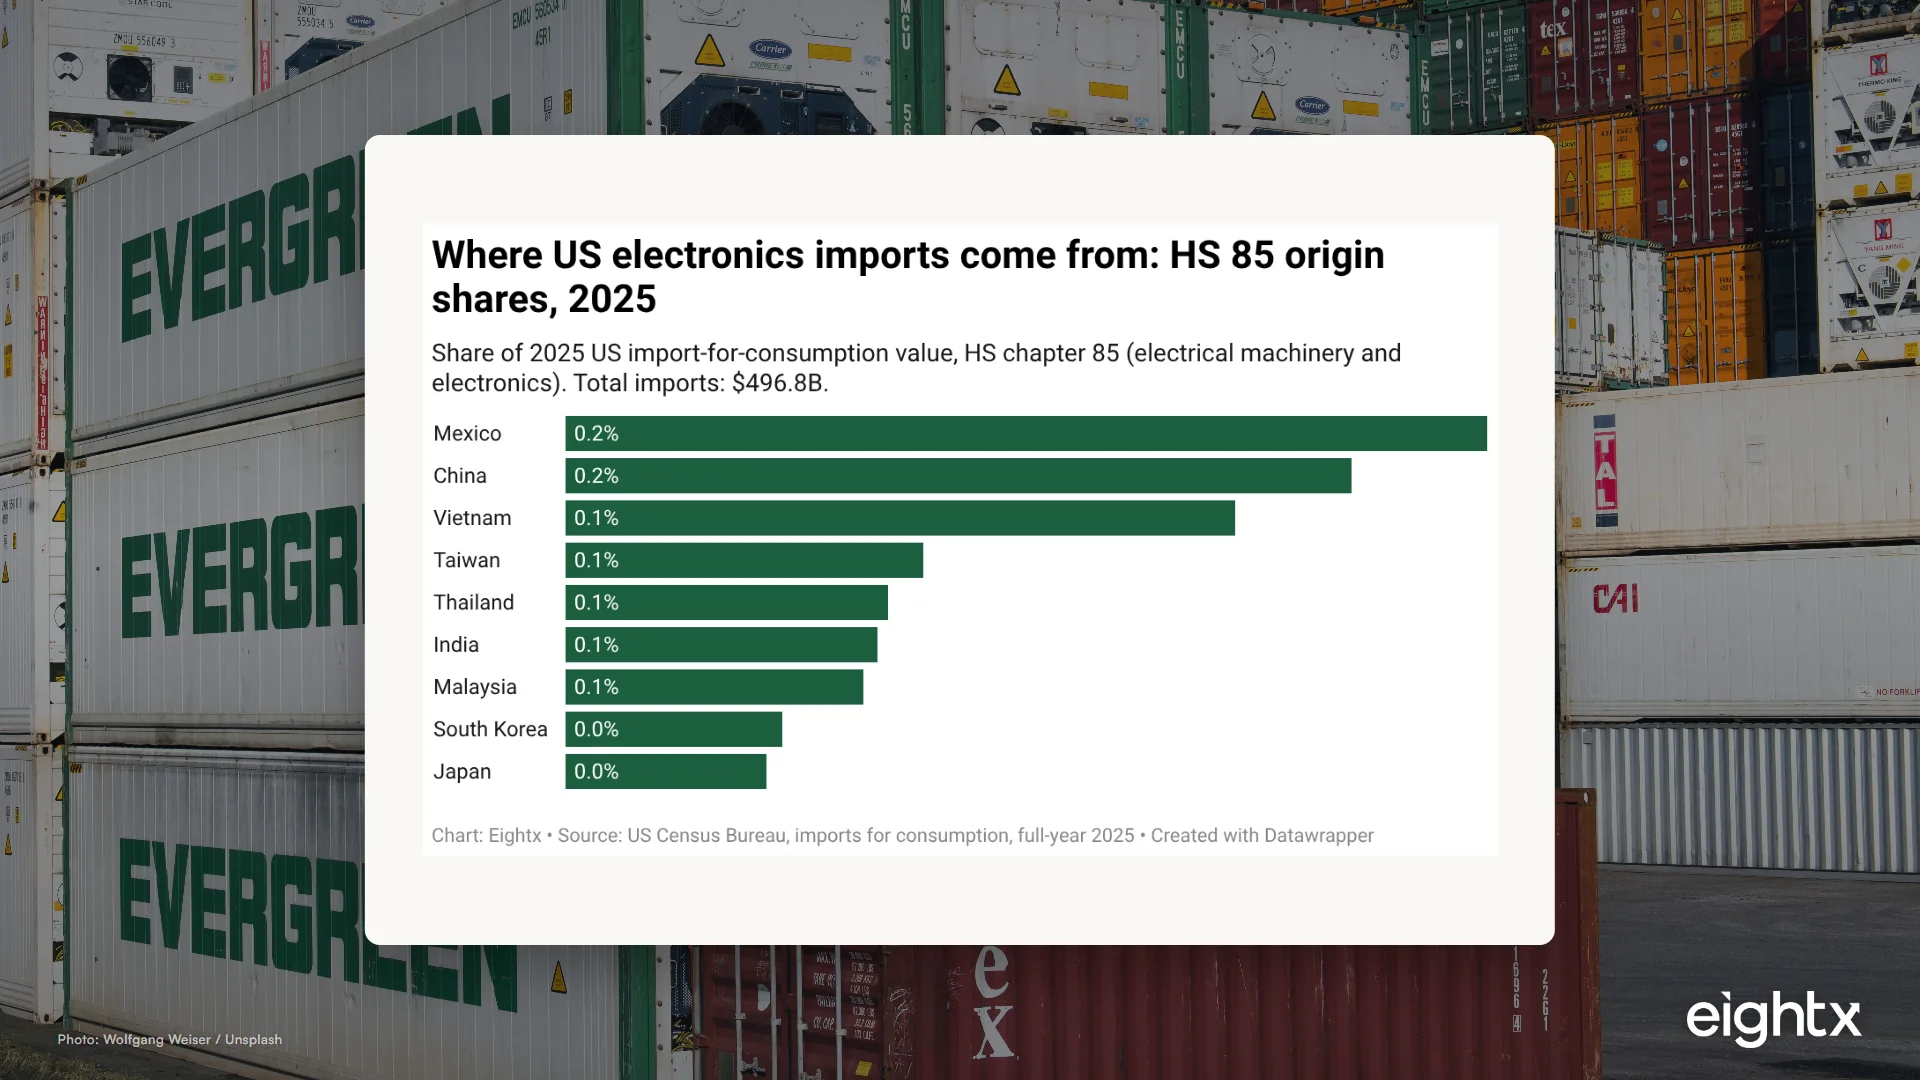
Electronics (HS chapter 85) is the largest US import category by value at $496.8B in 2025. Mexico leads at 18.3 percent, China is second at 15.6 percent and Vietnam third at 13.3 percent. China exposure is higher in accessories, so your sub-category, not the chapter average, decides your 2026 tariff hit.
Key Takeaways
- Electronics (HS 85) is the single largest US import category by value: $496.8B in 2025, far ahead of apparel, furniture or toys.
- Mexico is the number-one origin at 18.3%, ahead of China at 15.6% and Vietnam at 13.3%, so electronics is less China-concentrated than most founders assume.
- Accessories are more China-exposed than devices: audio gear (HS 8518) is 22.2% China versus 15.6% for the chapter, yet Vietnam already leads that sub-category at 47.2%.
- Phones and networking gear (HS 8517) now lean on Vietnam (24.4%) and India (17.1%) ahead of China (20.2%), the China-plus-one shift visible in the customs data.
- There is no single China rate: the 2026 stack runs from roughly 30% to 55%+, so your landed cost depends on your HS code and origin, not the headline number.
Ask a founder where their electronics come from and most will say China. Ask their customs broker and you get a more useful answer: it depends on the exact product, and for the category as a whole in 2026 the largest single source is not China at all. It is Mexico.
Electronics is the biggest story in US trade that operators underweight. HS chapter 85, electrical machinery and electronics, was the largest US import category by value in 2025 at $496.8B. That is bigger than apparel, footwear, furniture and toys combined. If you sell anything with a battery, a chip or a cable, you sit in the most valuable and most fought-over import pool there is, and your 2026 tariff exposure depends entirely on which corner of it you occupy.
Electronics is the largest import category, by a wide margin
We pulled full-year 2025 US import data from the Census Bureau for HS chapter 85 and ranked the origins. The headline: at $496.8B, electronics dwarfs the consumer categories founders usually worry about. For comparison, the largest US import categories for DTC show furniture at roughly $61B and toys at $14B. Electronics is in a different weight class, which is exactly why the tariff fight over it is so intense.
The second surprise is the origin mix. People assume electronics equals China. The data says otherwise.
Mexico is the number-one origin at 18.3%, ahead of China at 15.6% and Vietnam at 13.3%. That is final assembly migrating into USMCA and into Southeast Asia. China is real and large, but it is a minority of a very large pie, and the trend line is moving away from it. When I talk to founders running an accessories brand this size, the first reaction to that chart is disbelief, then a slightly nervous question: "so where does that leave my SKUs?" The honest answer is that the chapter map and your map are two different things.
The numbers behind the map
Here is the same data as a table, with 2025 import value and share for the top origins.
| Origin | 2025 US imports | Share of HS 85 |
|---|---|---|
| Mexico | $90.7B | 18.3% |
| China | $77.7B | 15.6% |
| Vietnam | $65.8B | 13.3% |
| Taiwan | $35.2B | 7.1% |
| Thailand | $31.9B | 6.4% |
| India | $30.7B | 6.2% |
| Malaysia | $29.3B | 5.9% |
| South Korea | $21.1B | 4.3% |
| Japan | $19.8B | 4.0% |
| All others | $94.4B | 19.0% |
The top three alone are 47% of the chapter. Add Taiwan and Thailand and you cover more than 60%. For a chip-and-cable category this is a strikingly diversified base, and it gives most electronics brands more sourcing optionality than, say, a toy brand stuck at 66% China.
Accessories carry more China risk than devices
This is the part that matters most for DTC and CPG brands, because very few of you import bare microchips. You import finished goods, and the China exposure inside chapter 85 is wildly uneven by sub-category.
Two examples from the same 2025 Census pull tell the story:
- Phones and networking gear (HS 8517): a $148.7B sub-category where Vietnam now leads at 24.4%, India is 17.1% and China has slipped to 20.2%. This is the "China plus one" shift showing up in the customs data, not a forecast. Assembly for handsets and routers has genuinely moved.
- Audio accessories (HS 8518), the headphones, earbuds, speakers and microphones bucket: a $12.0B sub-category that is 22.2% China-sourced, well above the 15.6% chapter average.
So the accessory point is real: if you sell the small stuff, your China share runs hotter than the chapter. But here is the twist that the founder narrative misses. Even in audio accessories, the China-plus-one move is already winning.
Vietnam is now the number-one origin for audio accessories at 47.2%, more than double China at 22.2%. The pattern we see again and again is that operators assume their charging cables and earbuds are "all China" and then discover, when they actually tag the purchase orders, that a big share already ships from Vietnam, Mexico or Malaysia. The headline-versus-reality gap cuts both ways. Here are the two sub-category tables in full.
| Origin | 2025 US imports | Share of HS 8517 |
|---|---|---|
| Vietnam | $36.2B | 24.4% |
| China | $30.0B | 20.2% |
| India | $25.5B | 17.1% |
| Thailand | $18.4B | 12.4% |
| Malaysia | $7.0B | 4.7% |
| Origin | 2025 US imports | Share of HS 8518 |
|---|---|---|
| Vietnam | $5.66B | 47.2% |
| China | $2.66B | 22.2% |
| Mexico | $1.64B | 13.7% |
| Malaysia | $0.43B | 3.6% |
| All others | $1.61B | 13.3% |
The lesson is the same one we hammer on across average CPG tariff impact as a percent of COGS: the sub-category and your specific supplier list decide your exposure, not the chapter average. Assume nothing about your own mix until you have pulled it.
What 2026 tariffs actually do to electronics
Origin is half the story. The duty stacked on each origin is the other half, and in 2026 that stack has more layers than at any point in the past decade. Based on current US trade actions, the rough picture looks like this.
| Origin | Reciprocal layer | Section 301 / other layers | Notes |
|---|---|---|---|
| China | 10% | 7.5% to 100% (301) + 20% IEEPA + 10% Sec 122 | De minimis suspended; postal ~30% to 54% or $50 to $100+/item |
| Mexico | 0% (USMCA-qualifying) | 25% (non-qualifying) | USMCA rules of origin decide |
| Vietnam | 20% | None | 40% penalty if CBP finds transshipment (no remission) |
| Taiwan | 20% | None | Generally near MFN otherwise |
| Malaysia | 19% | None | Near MFN on the base duty |
| Semiconductors (Sec 232) | None | 25% (eff Jan 15, 2026) | Advanced chips only; finished phones and laptops excluded |
For covered Chinese electronics, those layers commonly stack to somewhere in the low-30s to 55%-plus, depending on the HTS line. There is one important carve-out worth knowing: smartphones, laptops and certain finished devices have largely been kept out of the Section 232 semiconductor tariff, so their duty is driven by the country program above rather than a device-specific chip surcharge. That helps flagship-device importers more than it helps accessory brands.
The thing operators tell us, over and over, is that the level is not even the hard part. The volatility is. When I talk to founders importing from a single origin, the recurring line is some version of "the biggest impact for us has not been the rate, it has been not knowing what the rate will be next quarter." A stack with five moving layers and live litigation is not a number you set and forget. It is a number you model and re-model.
The de minimis change you cannot ignore
If you drop-ship low-value electronics straight from Asia, 2026 changed your model. The $800 Section 321 de minimis allowance that let brands send parcels duty-free was suspended for all countries, and for China-origin parcels in particular the postal-network treatment is reported around 30% to 54% ad valorem or a per-item charge of roughly $50 to $100-plus. For a $25 phone case shipped one at a time from Shenzhen, that is not a rounding error, it is the whole margin.
This is also where the transshipment trap bites. One operator put the risk plainly: "if you send it to Canada or Mexico or whatever and then to the US, you will still pay, because the product is going to say made in China." Routing the same Chinese-made goods through a third country does not launder the origin. CBP looks at where the product was actually made, and Vietnam carries a 40% penalty with no remission for exactly this. Most brands respond by bulk-importing into the US or running a genuine nearshore hub, which raises landed cost but removes the per-parcel uncertainty. The gap between cross-border and domestic fulfillment economics is closing fast.
The map is the same for everyone in the category. Your landed-cost outcome is not, because it depends on your specific SKUs, your exact HS codes and your real origin mix. The founders who win in 2026 are the ones who stop quoting themselves the headline China number and start modeling their own stack, line by line, before they reprice.
What to actually do about it
This is where I push founders hardest. The map is shared. The outcome is yours alone.
- Pull your real origin mix by SKU. Tag your last 12 months of purchase orders by country of origin and 10-digit HTS code. The chapter average is a starting point, never your number. Accessory-heavy catalogs almost always skew more China than the founder guesses, and yet the audio data shows plenty of accessory supply has already moved. You will not know which is true for you until you tag it.
- Model the duty by HS line, not by country. Two products from the same factory can carry very different rates. Get the 10-digit code right before you quote yourself a tariff, and confirm whether a device exclusion applies.
- Translate it to contribution margin, not gross margin. A tariff hits the same line as cost of goods, so it eats your contribution margin before ad spend. The way we frame it on calls: a typical ecommerce brand has to bring in four to five dollars of revenue to cover a single dollar of fixed cost, so a duty that lands on the COGS line does damage well before it reaches the bottom of the P&L. We build a per-product view of margin after COGS, freight, duty and ads so the decision is about real dollars, not a headline percent.
- Stress-test your de minimis dependence. If a meaningful share of revenue ships cross-border under the old $800 rule, model it at the new dutiable rate today. Decide whether to bulk-import or nearshore before the cash hit forces the decision.
- Price the switch, do not assume it. Moving accessories to Vietnam, India or Mexico carries its own 20%, 18% or 0%-to-25% layer plus freight, lead time and quality-control cost, and the choice between air and sea freight swings both the cash and the margin on every one of those lanes. Here is a point most founders miss: diversifying out of China buys you lead-time optionality, not just tariff savings. When everyone else is still placing a China order, paying a 30% deposit and waiting six months, a brand with a second source closer to home can simply move faster. Sometimes that optionality pays for the switch on its own. Sometimes it does not. The map tells you where to look; the landed-cost math tells you whether to move.
For the full cross-category picture and how electronics compares to apparel, footwear and beauty, see our DTC sourcing map. And if your catalog is China-heavy, the broader risk view is in China import dependence for DTC.
Sources and methodology
Figures are US imports for consumption (customs value) for full calendar-year 2025, pulled from the US Census Bureau international-trade data using the imports time-series at month 12 (full-year cumulative). The variable is CON_VAL_YR, imports for consumption at customs value, with country code Total For All Countries used as the denominator for share.
The category is HS chapter 85 (electrical machinery and electronics, $496.8B total, 218 partner rows). Sub-category figures use HS heading 8517 (telephone and networking equipment, $148.7B) and HS heading 8518 (audio: headphones, speakers, microphones, $12.0B). "Share" is each origin country's value divided by the chapter or heading total from all countries.
Tariff figures are typical 2026 ranges triangulated from public White House presidential proclamations and executive orders, USTR and CBP guidance, the Federal Register and trade-tracker tables. The primary actions referenced include the July 2025 reciprocal-rate order (Vietnam 20% with a 40% transshipment penalty, non-USMCA Mexico 25%), the July 2025 suspension of duty-free de minimis treatment, the November 2025 US-China arrangement (10% reciprocal on China, suspended to November 10, 2026) and the January 2026 Section 232 semiconductor proclamation (25% on advanced chips, finished-device carve-out).
Several layers, including the IEEPA fentanyl tariff and the Section 122 surcharge, are subject to ongoing litigation in 2026 that may change how duties are collected, so the China stack is presented as a reported range rather than a single hard rate. These ranges are not a substitute for a line-by-line 10-digit HTS lookup for your specific products.
Census figures are import value (customs value), not units, and reflect country of origin as declared at entry, so transshipment can understate true China content. Data refreshes quarterly. Related tariff context is drawn from our coverage of Amazon and DTC tariff exposure.
Frequently Asked Questions
what is the largest us import category in 2026?
Electronics. HS chapter 85, electrical machinery and electronics, was the largest US import category by value at $496.8B in 2025, far ahead of furniture, apparel or toys. It is roughly seven times the size of the apparel chapters combined.
where do most us electronics imports come from?
By 2025 import value, Mexico is the top origin at 18.3%, then China at 15.6% and Vietnam at 13.3%. Taiwan, Thailand, India, Malaysia, South Korea and Japan fill out the rest. The mix is far less China-concentrated than most operators expect.
are electronics accessories more exposed to china tariffs than devices?
Often yes. Audio accessories like headphones and speakers (HS 8518) are 22.2% China-sourced, above the 15.6% chapter average, even though Vietnam now leads that bucket at 47.2%. Finished phones and networking gear (8517) have shifted toward Vietnam and India, so accessory brands usually carry more China risk than device brands.
how much are 2026 us tariffs on electronics from china?
There is no single rate. Covered Chinese electronics stack the base duty plus Section 301, a 20% IEEPA layer, the 10% reciprocal rate under the US-China truce and the new 10% Section 122 surcharge, so effective rates commonly land from the low-30s to 55%-plus depending on the HTS line. Treat the headline number as a starting point, never your answer.
does sourcing electronics from mexico avoid tariffs?
Largely, for goods that qualify under USMCA rules of origin, which face roughly a 0% country-specific layer. Non-qualifying products of Mexico can face about 25%. That USMCA break is the structural reason Mexico is the number-one electronics origin and why final assembly keeps moving there.
what is the vietnam tariff on electronics and the transshipment penalty?
Vietnam carries a roughly 20% reciprocal tariff on top of the base duty. Goods that CBP judges to be routed through Vietnam while actually finished in China face a 40% transshipment penalty with no remission, so a paper move to Vietnam without real production there can cost more, not less.
what happened to de minimis for electronics in 2026?
The $800 Section 321 de minimis allowance was suspended for all countries, and China-origin parcels in particular face ad valorem duty reported around 30% to 54% of value or a per-item charge of roughly $50 to $100-plus. If you drop-ship low-value electronics straight from China, those orders became expensive and slow, pushing most brands toward bulk import or a nearshore hub.
are smartphones and laptops hit by the new semiconductor tariff?
Not directly. The Section 232 semiconductor tariff (25%, effective January 15, 2026) targets advanced chips, not finished consumer devices. Smartphones, laptops and tablets stay excluded as finished goods, so their duty is driven by the country program rather than a device-specific chip surcharge.